© 2016, IRJET | Impact Factor value: 4.45 | ISO 9001:2008 Certified Journal
| Page 1569
Controller design for integrating processes
N.Naveen chowdary
1,R.Kiranmayi
2, T.Manohar
31Student , Dept.of Electrical &Electronics Engineering, JNTUACEA, Anantapuramu, A.P.,India.
2Professor, Dept.of Electrical &Electronics Engineering, JNTUACEA, Anantapuramu, A.P.,India.
3Lecturer, Dept.of Electrical &Electronics Engineering, JNTUACEA, Anantapuramu, A.P.,India
---
Abstract: A simple method of designing the controllers for modified form of smith predictor is proposed for integrating plus time
delay (IPTD), and double integrating plus time delay (DIPTD). Set point tracking controller is tuned by direct synthesis method. The disturbance rejection controller is considered as a proportional-derivative (PD) controller. Set point weighting is considered for reducing undesirable overshoots and settling times in the modified smith predictor. The desired closed loop time constant that satisfies the robust performance, suitable values are provided based on the extensive simulation studies. Simulation examples are considered to illustrate the useful tuning rules. A significant improvement in control performance is obtained.
Keywords: Modified Smith Predictor, ISE, IAE, Robustness.
I. INTRODUCTION
Time delay systems commonly appear in many practical control applications and thus also in a lot of related research works. They are also called dead-time systems, systems with after effect. The presence of time delay can severely complicate control design because it impairs the stability and performance of the control loops. One of the classical tools for overcoming the time delay is known as the Smith predictor. This effective compensation structure has been published as early as in the late 1950s [8]. The smith predictor is a popular and very effective long dead time compensator for stable processes. A number of methods have been proposed to overcome the problem of controlling a process with an integrator and long dead time. A new smith predictor that isolates the set point response from the load disturbance response, and improved closed loop performances was proposed. The modified smith predictor having the controllers named as set point Tracking controller and disturbance rejection controller. Set point tracking controller is based on specifying the desired closed loop transfer function for set point change. Disturbance rejection controller was designed to reject the load disturbance for - integrating processes with large time delay. For the modified Smith predictor [1] proposed new tuning rules for the following integrating plus time delay, integrating plus first order plus time delay models.
Rao.et.al [2] proposes tuning rules for set point weighted modified smith predictor for integrating processes. The double two degree of freedom structure have been designed using a two degree of freedom-IMC tuning approach for a processes with general transfer function in[3]. Chia and lefkowitz [4] proposes the internal model based control scheme for integrating processes. The authors in [5] have reported a two degree of freedom control implementation of PID controller in series with second order filter (equivalent to the modified smith predictor controller). Lu, Wang proposed double two degree of freedom control scheme with four controllers for integrating and unstable processes with time delay in [6].
© 2016, IRJET | Impact Factor value: 4.45 | ISO 9001:2008 Certified Journal
| Page 1570
The main contribution of the present study is to improving the closed loop performances as compared to the recently reported strategies are achieved with less number of controllers. Section 2 provides the controller designing methods for both set point tracking controller and disturbance rejection controller, followed by section 3 describes the various parameter selections. Section 4 gives simulation study for given three examples and finally section 5 provides conclusion to this paper.II. CONTROLLER DESIGN
The modified smith predictor as shown in fig.1, where represents the nominal model of actual process ( ) which is to be controlled. Whereas are two controllers used for set point tracking and load disturbance rejection.
Fig.1. modified smith predictor
The process models for the controller designing for the integrating processes are:
IPTD: ( ) (1)
DIPTD: ( ) (2)
Where , and T are the time delay, gain and the time constants of the process model. The set point weighting parameter is used to reduce the undesirable peak over shoots and settling time [2]. The closed loop transfer functions between the output and the set point and the input load disturbance under nominal conditions ( ) are given by
(3)
( )
( )( ) (4)
© 2016, IRJET | Impact Factor value: 4.45 | ISO 9001:2008 Certified Journal
| Page 1571
2.1 controller design
Direct synthesis method is used for designing of the set point tracking controller based on the desired closed loop transfer function for set point change. The numerator of the desired transfer function is set equal to the numerator of the actual transfer function. is considered for the IPTD model whereas for DIPTD process models, is assumed as a PD controller having transfer function ( ) .
2.1.1 IPTD process model:
Substitute (1) and in (3), the obtained transfer function is:
(5)
Assuming the desired transfer function as follows:
( ) =
(6)
Where is the desired closed loop time constant for set point tracking response. By comparing equations (5) and (6), the proportional controller is:
; (7)
2.1.2 DIPTD process model:
By using (2), (3) and = ( ),
( )( )
( ) ( )
⁄
( ) ( )
( )
By comparing the above obtained and desired closed loop transfer functions, the following rules for DIPTD process model are:
; (8)
A set point filter with transfer function equal to (
) is used to remove the over shoot for DIPTD process model.
2.2 controller design
© 2016, IRJET | Impact Factor value: 4.45 | ISO 9001:2008 Certified Journal
| Page 1572
( ) (9)Where
⁄ .
The slope of nyquist curve at any frequency is numerically equals to the phase derivative of L (jω) at . The derivative of loop transfer function with respect to ω is expressed as follows:
( ) = ( ) ( ) ( ) ( ) (10)
And also, we have
ln ( ) = ln| ( )| ( ) (11) differentiating (9) and (11) with respect to ω,
( )
= j (12)
( )
= ( )[
* | ( )|+
+j
* ( )+
] (13)
Using (9),(12)and(13) equation (10) reduces to
( ) = j ( )+ ( ) (14)
Where x = (1+j )( * | ( )|++j * ( )+ )
Assuming ( )= * | ( )|+| and
( ) = * ( )+ | , we get
( )
| = ( ){j ( )( +j )} (15)
The slope of nyquist curve at is therefore given by
(16)
Where ( ). Assuming tan (Ψ- ) = a becomes ( ) (17)
The derivative term of PD controller can be obtained from (17) for given (which is set equal to the gain cross over frequency) and Ψ. Using the condition |L (j )| = 1, the proportional gain is obtained for the IPTD and DIPTD process models as follows:
√ (18)
© 2016, IRJET | Impact Factor value: 4.45 | ISO 9001:2008 Certified Journal
| Page 1573
III. PARAMETER SELECTION
The selection of desired closed loop time constant for an IPTD process model with k=1 and is taken. k=1, is taken for DIPTD small time delay process model. And k=1, for DIPTD large time delay process model. The effect of on robust stability and robust performance is studied by introducing of +10% perturbations in the process time delay. The variation of desired closed loop time constant is , and for IPTD and DIPTD as follow:
Fig.2. Effect of on the closed loop response IPTD process model.
Table.1. Performance measure of in IPTD process model after disturbance creation.
Time
constant( ) (sec) (sec) (sec)
13.3 17 --- 17
14.6 18.3 72 14.7
15.8 19.5 66 17
© 2016, IRJET | Impact Factor value: 4.45 | ISO 9001:2008 Certified Journal
| Page 1574
Table.2. Performance measure of in DIPTD process model with small time delay after disturbance creation.
Time
constant( ) (sec) (sec) (sec)
5.3 5.6 44 0.25
7.4 10.2 68 10.6
10.2 15.2 214.2 27
Fig.4. Effect of on the closed loop response DIPTD process model with large time delay.
Table.3. Performance measure of in DIPTD process model with large time delay after disturbance creation.
Time
constant( ) (sec) (sec) (sec)
--- --- --- ---
25.3 31.2 145 115.3
23 30.5 127 161
It can be observed that fails to give the robust performance for the considered process models. These responses are obtained by giving a unit step change in the set point at time t=0 and inverse step load disturbance of magnitude 0.1 at plant input at t=80. It is to be noted that the nominal and perturbed responses corresponding to are satisfactory. Furthermore the same trend is observed by varying over a wide range and hence recommended for IPTD process models. Similarly recommended for DIPTD model. Gain cross over frequency ( ) is used as a measure of system performance and also system robustness. Gain cross over frequency is related to the rise time and therefore to the bandwidth of the closed loop system. Astrom [10] has shown that the gain cross over frequency satisfies the following inequality
arg { ( )} - - (20)
© 2016, IRJET | Impact Factor value: 4.45 | ISO 9001:2008 Certified Journal
| Page 1575
over frequency, with preferably steeper slopes before and after the cross over and hence is assumed as -1 [11]. For the process models considered in the present study, the above inequality reduces to the following:(21)
The values of the is considered in the present work are and and the corresponding values of are 1.05 and 0.52 respectively. For an IPTD process model with k=1 and = 5, controller parameters corresponding to the various values of and that stabilize the closed loop system [1]. The closed loop responses for an inverse step load disturbance of magnitude 0.1 at the plant input as in [1]. Minimum settling is obtained corresponding to and ψ = and hence, and ψ are taken as and respectively for IPTD process model. Similarly, = is recommended for DIPTD process model and ψ is taken as 45 degrees for DIPTD process model.
IV. SIMULATION RESULTS
Integral of the absolute error (IAE), integral of the squared error (ISE), settling time ( ) are the performance measures that have been used to compare various tuning methods. IAE, ISE are mathematically defined as follows:
ISE = ∫ ( ) (22)
IAE = ∫ | ( )| (23)
Where e(t) is the difference between the set point input and controlled variable. A small value of the ISE or IAE implies fast set point tracking and load disturbance rejection.
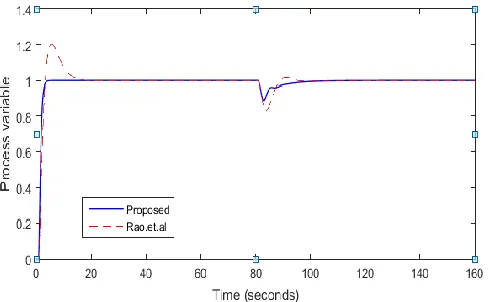
4.1. Example 1. Rao et al. [2] proposed ( ⁄ ), and for an IPTD process model
( ) . Whereas the proposed method yields and . A unit step change in the set
point at time t=0 and negative step load disturbance of magnitude 0.1 at the plant input at t=80 are introduced to compare the performances of Rao.et.al [2] and proposed method. The resulting process variables are shown in fig. 5(a) and the performance measures are given in table4. It can be observed that the proposed method results in least settling time and minimum IAE for both set point tracking and load disturbance rejection. The robustness of the tuning methods is checked by introducing an uncertainty of 10% in the process time delay and the perturbed system outputs are shown in fig. 5(b). It is to be noted that number of controller parameters is more in [2] as compared to the proposed scheme.
© 2016, IRJET | Impact Factor value: 4.45 | ISO 9001:2008 Certified Journal
| Page 1576
Fig. 5(b). Ex1 perturbed responseTable.4. Performance measure of example1 after disturbance creation.
Tuning
method IAE` ISE (sec) Mp%
Proposed 2.542 0.8593 32 1.6
Rao.et.al[2] 4.584 1.565 59 ---
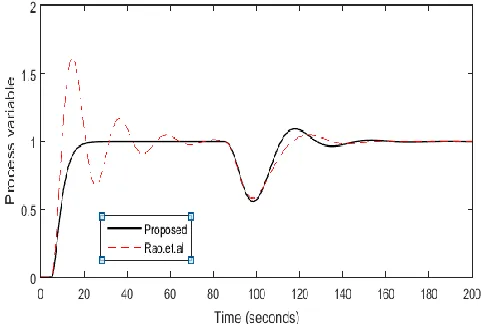
4.2. Example 2. For an DIPTD process model considered the plant model ( ) with small time delay. The proposed controllers are ( ) and ( ). And a negative step load disturbance of magnitude 0.1 at the plant input t=80. Rao et al. [2] proposed the parameters obtained for are , , , with tuning parameter selected , , the set point weighting parameter is chosen . the ( ) is disturbance rejection controller. The robustness of the proposed method is checked by introducing an uncertainty of 5% in the process time delay. The resulting variables and perturbed system outputs are shown in Fig. 6(a) and 6(b). Though the DIPTD process model of proposed method controllers satisfies the results of IAE, ISE as shown in table5. Settling time and maximum peak over shoots are very less compare to the Rao.et.al [2], so the DIPTD process model of proposed method gives good nominal and perturbed performances, and proposed method is gives good robust performance.
[image:8.612.177.431.92.247.2] [image:8.612.186.431.542.693.2]© 2016, IRJET | Impact Factor value: 4.45 | ISO 9001:2008 Certified Journal
| Page 1577
Fig.6(b). Ex2 perturbed responseTable.5. performance measures of example2 after disturbance creation.
Tuning
method IAE ISE (sec) Mp%
Proposed 0.8371 0.4988 37 ---
Rao.et.al[2] 3.269 1.357 32 1.5
4.3. Example 3. A DIPTD process model with large time delay ( ) . the proposed controllers are ( ) and ( ). a unit step change in the set point and a negative step input of 0.01 in load at t=80 sec. Rao.et.al [2] the parameters obtained for are , , and , , the set point weighting parameter , and the controller is (0.008+0.13s). The nominal and perturbed responses are shown in fig. 7(a) and 7(b).
The proposed controllers for DIPTD process model gives good nominal response as well as less integral of the squared error and integral of the absolute errors as shown in table6. And which gives good robustness of the system.
[image:9.612.184.431.91.249.2] [image:9.612.186.430.532.694.2]© 2016, IRJET | Impact Factor value: 4.45 | ISO 9001:2008 Certified Journal
| Page 1578
Fig.7(b). Ex.3 perturbed response.Table.6. performance measures of example3 after disturbance creation.
Tuning
method IAE ISE (sec) Mp%
Proposed 6.085 3.156 100 9
Rao.et.al[2] 12.28 4.939 107 5
V. CONCLUSIONS
A simple method of designing controllers for the modified smith predictor is proposed. Set point weighting is incorporated for integrating plus time delay and double integrating plus time delay process models. The set point tracking controller is tuned using direct synthesis method, whereas the controller used for load disturbance rejection is considered as proportional derivative controller (PD). The double integrating plus time delay models for both large time delay and less time delay simulations are obtained. Good nominal and robust control performances are achieved with the designed controllers. It is observed that based on the simulation study results, the proposed control scheme gives improved performance with less number of controller parameters as compared to the recently reported tuning methods.
REFERENCES
[1] Moina Ajmeri and Ahmad Ali, “Simple tuning rules for integrating process with large time delay” Asian journal of control,vol.18,No.2,pp.18,2015.
© 2016, IRJET | Impact Factor value: 4.45 | ISO 9001:2008 Certified Journal
| Page 1579
[3] Tan, W., “Analysis and design of a double two-degree of-freedom control scheme,” ISA Trans., Vol. 49, pp.311–317(2010).
[4] Chia, T.-L., and I. Lefkowitz, “Internal model-based control for integrating processes,” ISA Trans., Vol. 49,pp. 519–527 (2010).
[5] Mataušek, M. R., and A. I. Ribić, “Control of stable, integrating and unstable processes by the modified Smith predictor,” J. Process Control, Vol. 22, pp. 338–343 (2012).
[6] Lu, X., Y.-S. Yang, Q.-G. Wang, and W.-X. Zheng, “A double two-degree-of-freedom control scheme for improved control of unstable delay processes,” J. Process Control, Vol. 15, pp. 605–614 (2005).
[7] Ali, A., and S. Majhi, “PID controller tuning for integrating processes,” ISA Trans., Vol. 49, No. 1, pp. 70–78 (2010).
[8] D. E. Seborg, T. F. Edgar, and D. A. Melli champ, Process Dynamics and Control, John Wiley &Sons, NJ, 2004. [9] Smith, O. J., “A controller to overcome dead time,” ISAJ., Vol. 6, No. 2, pp. 28–33 (1959).
[10] Ǻström, K. J., “Limitations on control system performance,” Eur. J. Control, Vol. 6, pp. 2–20 (2000).
[11] Wang, Q. G., H. Ru, and X. G. Huang, “An effective frequency domain approach to tuning non-PID controllers for high performance,” ISA Trans.Vol.41, pp. 37–49 (2002).
[12] Morari, M., and E. Zafiriou, Robust Process Control, Englewood Cliffs, Prentice Hall (1989).
[13] Rao, A. S., V. S. R. Rao, and M. Chidambaram, “Direct synthesis-based controller design for integrating processes with time delay,” J. Franklin Inst.-Eng. Appl.Math., Vol. 346, pp. 38–56 (2009).
[14] Mataušek, M. R., and A. D. Micić, “A modified Smith predictor for controlling a process with an integrator and long dead time,” IEEE Trans. Autom.Control, Vol. 41, pp. 1199–1203 (1996).