Research article Available online www.ijsrr.org
ISSN: 2279–0543
International Journal of Scientific Research and Reviews
Formation Constant and Free Energy Values of 1:1 Complexes of
1-Bromohexane, 1-Bromodecane, 1-Bromooctane with
O-Nitro Phenol In Cs
2Sivashankar P.
*and Umamaheswari A.
Department of Physics, Government Arts college, Coimbatore, Tamilnadu, India E-mail:- [email protected] Tel.:-9092222363
ABSTRACT
Molecular interaction has been studied by FTIR spectroscopy of bromodecane, 1-bromohexane, 1-bromooctane with o-nitro phenol in carbon disulphide (CS2) at room temperature.
Formation constant and free energy values has been calculated from absorbance of the FTIR spectrum. The result about elucidate proton donating ability of o- nitro phenol.
KEYWORDS: FT-IR; formation constant; free energy;
* Correspoinding author .
P. Sivashankar
Department of physics, Government Arts college Coimbatore, Tamilnadu, India
1.
INTRODUCTION:-
Molecular interaction is huge in the field of molecular biology, chemistry, physics and material design because of importance of these interactions1, scholars have paying their attention to these interactions. The scholars carried out the task of studying the molecular interactions in binary and ternary solutions2-14 These measurements are used to identify the nature of complexes and to evaluate formation constants of the complex formed by AB and AB2 complexes Quing Liu et al.15
investigated infrared spectroscopy studies in 20 different pure organic solvents through the solute-solvent. FTIR investigation of the properties of organic compounds is of great value in understanding the nature of molecular interaction between the molecules keeping both the industrial and scientific interests16. In present study is expected to provide better understanding of solute- solute interactions of 1-Bromodecane, 1-Bromohexane, 1-Bromooctane and O-nitro phenol in Carbon di sulphide using FTIR spectroscopic measurement. To elucidate the effect of medium and role of specific solute-solute interactions on the stability of 1:1 complex formation donor to acceptor
2. EXPERIMENTAL
2.1
MATERIAL
1-Bromodecane, 1-Bromohexane, 1-Bromooctane, O- Nitro phenol, with purity >99% (spectroscopic grade) were purchased from precession scientific company in Coimbatore and used without any further purification. AR grade Carbon disulphide. The physical parameters of all the
chemicals used in this study were checked against their literature values.
2.2. RECORDING OF FT-IR SPECTRA
SHIMADZU series FT-IR spectrometer was used in the present study with double beam operation. The scanning range of frequency is 4000 – 400 cm-1 . The accuracy of measurement with this instrument is ± 0.01 cm-1. The cell used in a variable path length NaCl end plates. The thickness of cell was maintained at 0.05cm for all measurements. Distilled samples of Bromodecane, 1-Bromohexane, 1-Bromooctane and O-nitro phenol were used. The instrument scans the spectra 50 times in minute.
3. CALCULATION
3.1 FORMATION CONSTANT AND FREE ENERGY OF THE 1:1 COMPLEX
NASH METHOD
interaction are assumed to be obeying Beer’s law at a given frequency characteristic of the 1:1 complex.17,18 Here one assumes that the existence of a chemical equilibrium of the from.
A+B AB (1)
Where B is a donor molecule and A is an acceptor. For purposes of orientation, one assumes that only A and AB absorb in the wavelength region of interest and for temporary mathematical convenience, it is taken that the concentration of A is to be very small relative to that of B. the equilibrium constant appropriate to reaction (1) is given in concentration units by
Kc = (2)
Where Cab is the formation constant of the complex AB and Ca and Cb are the formal
concentrations of A and B per centimeter of the path (A) is given by
A= εaCa+εabCab (3)
Where εa and εab are the molar absorptivities of species A and AB respectively. In the absence
of complexing agent B, the total absorbance per centimeter is given by
Ao=εaCao (4)
Where Cao is the initial concentration of A. If one divides equation (3) by equation (4) and
substitutes for Cab from equation (2).
=
[
]
(5)
By introducing conservation of species A
Cao = Ca+Cab (6)
And invoking equation (2) on second time one finds
=(kcb+1)-1 (7)
When equation (7) is substituted into equation (5) which results
=[
]
1+KCb) (8)
For convenience, let one defines
=Z (9)
=α (10)
and Cb= (11)
Then the equation (8) becomes
Z = ⁄⁄ (12)
Y = (13)
When now one defines
X = (14)
And substitutes equation (14) into equation (13) a linear equation results
Y = X(k-α)-k (15)
The physical significance of the equation (15) is quite clear. When the reciprocal of the donor concentration is plotted against the reciprocal of one minus the absorbance ratio value and a straight line should result if 1:1 complex formation occurs. The intercept of this line is the negative of the formation constant and the slope is related to the molar absorptivity of the complex.
3.2 FREE ENERGY
The free energy.18,19 function provided the measure of chemical affinity under conditions of constant temperature and pressure energy changes in a chemical reaction can be defined as,
ΔG=G(product)-G(Reaction) (1)
Where ΔG=0, there is no network obtainable, the system is in a stable of equilibrium. When ΔG is positive, network must be put in to the system to effect the reaction can proceed spontaneously with accomplishment of the network. The larger amount of this work that can be accomplished the further removed is the reaction from equilibrium. For this reason –ΔG as often been called the during force of the reaction.
Using the formation constant, obtained in the present investigation, the free energy (ΔG) were calculated for the systems under consideration with the relation.
ΔG= -RT ln K11 (2)
Where R is gas constant.
The absolute temperature 298K and K11 is formation constant. The free energy of the bond
formation obtained at 25ºC for the system and values are given in table 5.9.
4. RESULT AND DISCUSSION
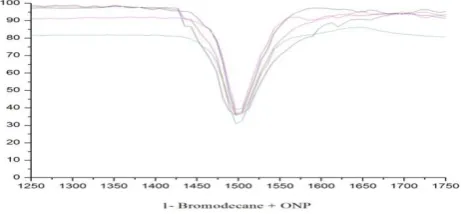
The FTIR spectral has been present for binary and ternary complexes in fig carbonyl bands in the range is (1215 - 1589). From ternary complexes proton acceptor fixed from 0.03 mol l-1 proton donor (o-nitro phenol) concentration from 0.03-0.11mol l-1 by changing concentration increases increasing concentration Fig (1-3). Absorbance values given in table (1-3). from this data reveal that the existence of 1:1 complex formation carbonyl group.
The association between donor (o- nitro phenol) A and acceptor (1-Bromodecane,
A+B↔AB, if only 1:1complexes are present. The formation constant (K) for the 1:1 complex
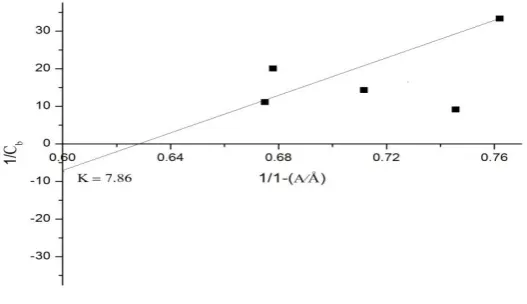
is calculated with the help of Nash(1960) method this interaction are assumed to be obeying Beer’s law at a given characteristic frequency of the 1:1 complex. The physical significance of Y from Nash method. Reciprocal of donor concentration (Y = [A]-1) is plotted against the reciprocal of one minus absorbance ratio (A/Å) at X axis. It gives a straight line for 1:1 complex formation. The intercepts of plot are shown in plot (1-3).
Free energy has been calculated according to equation 2 with help of formation constant. Free energy values increase in the order 1-bromohexane < 1-bromooctane <1-bromodecane. This change indicate that proton donating ability of proton donor varies of o-nitro phenol.
5. CONCLUSION:-
Results reveal that proton donation ability of O-nitro phenol proton accepting ability is linearly increasing. Bromooctane greater than Bromodecane but Bromodecane greater than 1-Bromohexane.
6. REFERENCE:-
1. S. Tsuzuki, K. Honda, T. Uchimaru, M. Mikami, K. Tanabe, Journal of American chemical society, 2000; 122: 3756-3753
2. K. Rajagopal, S. Chenthilnath, Journal of Thermo chemical. Act A, 2010, 498: 45-53 3. K. Rajagopal, S. Chenthilnath, A. K. Nain, Journal of Molecular Liquid. 2010; 151: 23-29 4. K. Rajagopal, S. Chenthilnath, Journal of Chemical Thermodynamics. 2010; 42: 675-683 5. K. Rajagopal, S. Chenthilnath, Journal of Molecular Liquid. 2011; 160: 72-80
6. K. Rajagopal, S. Chenthilnath, Chinese Journal of Chemical Engineering 2010; 18: 804-816 7. N. Deenadayalu, P. Bhujrajh, Journal of Chemical Thermodynamics. 2006; 38: 278-282 8. J. B. Asbury, T. Steinel, M. D. Fayer, Journal of Physical Chemistry B, 2004; 108:
6544-6554
9. J. Chowdhary, B. M. Ladanyi, Journal of Physical Chemistry B, 2009; 113: 4045-4053 10.D. S. Dudis, J. B. Everhart, T. M. Branch, S. S. Hunnicutt, Journal of Physical Chemistry,
1996; 100: 2083-2088\
11.S. Hammerum, Journal of American chemical society, 2009; 131: 8627-8635
12.P. Lenain, M. Mandado, R. A. Mosquera, P. Bultinck, Journal of Physical Chemistry A, 2008; 112: 7898-7904
14.W. Haijun, Z. Guokang, C. Mingzhi Journal of Chemical Thermodynamics. 1993; 25: 949-956
15.Quing Liu, Wenqiang sang, Xiaomin XU, Journal of Molecular Structure, 2002; 608: 253 16.Weissberger, A.Technique of Organic Chemistry. Wiley Interscience, New York 1970
17.V. E.Borisenko, Yu. A. Zavjalova, T.G. Tretjakova, Z. S. Kozolva, A.Koll, Journal of Molecular Liquid. 2004; 109: 125.
18.P. Sivagurunathan, K. Dharmalingam and K.Ramachandran, Indian Journal of Physics. 2005; 79(12): 1403.
19.Th. Zeegers – Huyskens, P. Huyskens, H. Ratajczak and W.J. Orvile- Thomas (Eds.), Molecular Vibrations, 1980; 2: 107.
Fig 1. FT-IR Spectra of o-nitro phenol with 1-Bromohexane in CS2 system
Fig 2. FT-IR Spectra of o-nitro phenol with 1-Bromooctane in CS2 system
Table:- 1o-nitro phenol with 1-Bromohexane in CS2 system of C-N Stretching vibration and carbonyl
absorbance.
Concentration Free Band Absorbance
Inverse of the observed concentration
C-N Band
Absorbance X =
0.03 1.4621 33.4896 0.4109 0.7537
0.05 1.3617 19.9840 0.4064 0.7685
0.07 1.4302 14.2430 0.4106 0.7547
0.09 1.3177 11.1185 0.4130 0.7470
0.11 1.3030 9.0802 0.4212 0.7220
Table:- 2 o-nitro phenol with 1-Bromooctane in CS2 system of C-N Stretching vibration and carbonyl absorbance.
Concentration Free Band Absorbance
Inverse of the observed concentration
C-N Band
Absorbance X =
0.03 0.0278 33.2447 0.4083 0.7621
0.05 0.1097 19.9880 0.4370 0.6781
0.07 0.2410 14.2430 0.4247 0.7118
0.09 0.0308 11.0619 0.4382 0.6750
0.11 0.1053 9.0662 0.4134 0.7457
Table:- 3 o-nitro phenol with 1-Bromodecane in CS2 system of C-N Stretching vibration and carbonyl
absorbance.
Concentration Free Band Absorbance
Inverse of the observed concentration
C- N Band
Absorbance X =
0.03 0.0278 32.7547 0.4225 0.7181
0.05 0.1097 19.9880 0.4132 0.7464
0.07 0.2410 14.2857 0.4162 0.7370
0.09 0.0358 11.234 0.4746 0.5926
0.11 0.1053 9.0801 0.4463 0.6580
Plot:- 2 o-nitro phenol with 1-Bromooctane in CS2 system of C-N Stretching vibration and carbonyl absorbance.
Plot:- 3 o-nitro phenol with 1-Bromodecane in CS2 system of C-N Stretching vibration and carbonyl absorbance.
Table – 4Formation constant and Free energy values of 1:1 complexes
System Nash method Free energy
K11 lit mol-1 -∆G11
O-nitro phenol+
1-Bromohexane 5.16 4.07
1-Bromooctane 7.86 5.11