INTERNATIONAL JOURNAL OF PHARMACEUTICS & DRUG VOL.4 ISSUE 1, 2016; 30 – 34 ; http://ijpda.com; ISSN: 2348
RESEARCH ARTICLE
DEVELOPMENT AND V
LIDATION OF UV SPE
TROPHOTOMETRIC M
THOD FOR ESTIMATION
OF SAXAGLIPTIN IN BULK
AND PHARMACEUT
DOSAGE FORM
Sanjeev V. Deshpande*, Madhumita A. Roy, Shubhangi C. Daswadkar
Department of Quality Assurance Technique D.Y. Patil College Of Pharmacy, Akurdi, Pune
Maharashtra state, India.
Date Received: 24th December 2015; Date Accepted:
January 2016 Date published: 15th January 2016
Email: [email protected]
Abstract: Three simple, precise and economical UV spe trophotometric methods have been developed for the e timation of Saxagliptin in bulk and pharmaceutical fo mulations. Saxagliptin is an antidiabetic drug belonging the chemical class is dipeptidyl peptidase
(DPP-4) inhibitor. Saxagliptin has absorbance maxima at 211 nm in zero order spectrum method (Method A), and in the first order derivative spectra, showed sharp peak at 204 nm when n = 1 (Method B). The drug followed the Beer- Lambert’s law in the concentration range of 5 µg/ml in all two methods. Results of the analysis, val dated statistically and by recovery studies were found to be satisfactory.
Key words: Saxagliptin (onglyza); Ultraviolet spectroph tometry; Zero order spectrum; First order derivative & spectroscopy
INTRODUCTION:
Saxagliptin previously identified as BMS-oral hypoglycemic (anti-diabetic drug) of the peptidase-4 (DPP-4) inhibitor class of drugs.
PHARMACEUTICS & DRUG ANALYSIS ISSN: 2348-8948
DEVELOPMENT AND
VA-LIDATION OF UV
SPEC-TROPHOTOMETRIC
ME-THOD FOR ESTIMATION
IN BULK
AND PHARMACEUTICAL
DOSAGE FORM
Sanjeev V. Deshpande*, Madhumita A. Roy, Shubhangi
Department of Quality Assurance Technique, Padm. Dr. D.Y. Patil College Of Pharmacy, Akurdi, Pune-411044,
2015; Date Accepted: 11th
January 2016
economical UV spec-trophotometric methods have been developed for the es-timation of Saxagliptin in bulk and pharmaceutical for-antidiabetic drug belonging the chemical class is dipeptidyl peptidase-4 enzyme sorbance maxima at 211 nm in zero order spectrum method (Method A), and in the first order derivative spectra, showed sharp peak at 204 nm when n = 1 (Method B). The drug followed the centration range of 5-50 g/ml in all two methods. Results of the analysis,
vali-tically and by recovery studies were found to
Saxagliptin (onglyza); Ultraviolet spectropho-tometry; Zero order spectrum; First order derivative &
-477118, is an ) of the dipeptidyl class of drugs. Chemically,
Saxagliptin is (1S,3S,5S)-2-[(2S
adamantyl)acetyl]-2-azabicyclo[3.1.0]hexane
carbonitrile. DPP-4 is an enzyme that breaks down incretin hormones. As a DPP
tin slows down the breakdown of incretin hormones, i creasing the level of these hormones in the body. It is this increase in incretin hormones that is responsible for the beneficial actions of saxagliptin, including increasing i sulin production in response to meals and decrea rate of gluconeogenesis in the liver Dipeptidyl peptidase 4's role in blood glucose regulation is thought to be through degradation of GIP and the degrad
1.Because incretin hormones are more active in response to higher blood sugar levels (and are less active in r sponse to low blood sugar), the risk of dangerously low blood sugar (hypoglycemia) is lo
notherapy.Saxagliptin is not official in any of the pharm copoeias and Merck Index & Martindale,The Complete Drug Reference. Literature survey has indicated that there are reported few analytical methods for determination of Lornoxicam in plasma by UV spectroscopy, HPLC, and other few methods like RP-HPLC has been reported for analysis of combination formulation of saxa
the objective of the work is to develop simple, precise, accurate, sensitive, rapid and economical U
Spectrophotometric methods for the estimation of Saxa liptin (SXG) in bulk and pharmaceutical formul
Figure 1: Chemical structure of Saxagliptin
MATERIALS AND METHODS Materials
Saxagliptin (SXG) bulk drug was obtained from Neuland laboratories ltd, Hyderabad, Telangana India. The co mercially tablets of SXG are available in Indian market as Onglyza tablet containing 5mg Saxagliptin. Other chem cals used were analytical or HPLC
used were Class A grade.
Instruments
Shimadzu UV - 1700 UV/VISIBLE spectrophotometer
30
S )-2-amino-2-(3-hydroxy-1-
azabicyclo[3.1.0]hexane-3-4 is an enzyme that breaks
DPP-4 inhibitor, saxaglip-akdown of incretin hormones, in-creasing the level of these hormones in the body. It is this
crease in incretin hormones that is responsible for the beneficial actions of saxagliptin, including increasing in-sulin production in response to meals and decreasing the
in the liver Dipeptidyl peptidase-egulation is thought to be
and the degradation of GLP-.Because incretin hormones are more active in response to higher blood sugar levels (and are less active in re-sponse to low blood sugar), the risk of dangerously low blood sugar (hypoglycemia) is low with saxagliptin
mo-Saxagliptin is not official in any of the pharma-copoeias and Merck Index & Martindale,The Complete
erence. Literature survey has indicated that there are reported few analytical methods for determination of m in plasma by UV spectroscopy, HPLC, and
HPLC has been reported for analysis of combination formulation of saxagliptin. Hence the objective of the work is to develop simple, precise, accurate, sensitive, rapid and economical UV Visible methods for the estimation of Saxag-(SXG) in bulk and pharmaceutical formulations.
Figure 1: Chemical structure of Saxagliptin
DS:
Saxagliptin (SXG) bulk drug was obtained from Neuland laboratories ltd, Hyderabad, Telangana India. The com-mercially tablets of SXG are available in Indian market as Onglyza tablet containing 5mg Saxagliptin. Other
chemi-ical or HPLC-grade and glassware
Available online at http://ijpda.com
with UV probe 2.10 software and 1 cm matched quartz cells were used for absorbance measurements. Analytical balance used for weighing standard and sample was SHIMADZV AUX 220 Uni Bloc PAT 1987.
Preparation of standard stock solution
Accurately weighed 10 mg of SXG working standard was transferred into a 100 mL volumetric flask it was dis-solved with Methanol which further sonicated for10 min. The volume was made up to 100 mL with distilled water to give the solution containing 100 µg/mL of SXG.
Selection of λmax
The standard stock solution was further diluted with wa-ter to get a 10 µg/mL of concentration. The solution was scanned between 200 and 400 nm using water as blank. The UV spectrum of SXG in water had shown λmax at 211 nm in zero order spectrum (method A) and 204 nm in first order derivative method (method B). Hence, it was selected for the analysis of SXG (Figure 1 and 3).
Preparation of the calibration curve
Aliquots of standard stock solution were further diluted with water to get the solutions of concentration 5–50 µg/mL. The absorbances were measured at 211 nm and 204 nm against water as blank. All measurements were repeated three times for each concentration. The calibra-tion curve was constructed by plotting mean of absor-bance against corresponding concentration.
Preparation of the sample solution :
Method A: Aliquots of standard stock solution were pi-petted out and suitably diluted with distilled water to get the final concentration of 5, 10,15,20, upto 50 µg/ml of standard solutions. The solutions were scanned in the spectrum mode from 400 nm to 200 nm wavelength range and the zero order derivative spectra was obtained (Fig.2). The maximum absorbance of Saxagliptin was observed at 211 nm. The drug followed the Beer-Lambert’s law in the concentration range of 5-50 µg/ml. The calibration curve was plotted as absorbance against concentration of Saxag-liptin. The coefficient of correlation (r), slope and inter-cept values of this method are given in Table III. The con-centrations of sample solutions were determined from calibration curve.
Method B: The first order derivative spectra at n=1 showed a sharp peak at 204.0 nm (Fig.4). The absorbance difference at n=1 (dA/dl) was calculated by the inbuilt software of the instrument which was directly propor-tional to the concentration of the standard solution. The standard drug solutions were scanned in the first order derivative spectra. A calibration curve was plotted taking the absorbance difference (dA/dl) against the
concentra-tion of Saxagliptin. The coefficient of correlaconcentra-tion (r), slope and intercept values of this method are given in Table III. The method was applied for determination of concentra-tion of sample soluconcentra-tion.
METHOD VALIDATION:
The developed method was validated as per ICH guide-lines’ for following parameters [5].
Linearity
The linearity was studied in the concentration range of 5– 50 µg/mL at 211 nm and 204 nm.
Specificity and selectivity
The spectra obtained from tablet solutions were identical with that obtained from standard solution containing an equivalent concentration of SXG. This showed that there was no any interference from excipients. Therefore, it could be said that developed method is highly selective.
Recovery studies
To ensure accuracy of the method, recovery studies were performed by standard addition method at 80%, 100%, and 120% level to preanalyzed samples and subsequent solutions were reanalyzed. At each level, three determina-tions were performed.
Precision
The precision of an analytical procedure expresses the closeness of agreement (degree of scatter) between a se-ries of measurements obtained from multiple sampling of the same homogeneous sample under the prescribed con-ditions. Precision of the method was determined in terms of repeatability and intraday and interday precisions.
Repeatability
Repeatability of the method was determined by analyzing six samples of same concentrations of drug. Graphs were recorded, and the area of each graph was measured.
Intraday and interday precision
Intraday precision was determined by analyzing the drugs at three different concentrations and each concen-tration for three times, on the same day. Interday preci-sion was determined similarly, but the analysis being car-ried out daily, for three consecutive days.
Robustness
tripli-Sanjeev V
cate.
Solution stability
The stability of the standard solution was tested at inte vals of 1, 6, 12 and 24 h. The stability of solutions was d termined by comparing absorbance of SXG.
RESULTS AND DISCUSSION:
All methods A, and B for the estimation of Saxa (SXG) in tablet dosage form were found to be simple, a curate, specific and reproducible. Beer-Lambert’s law was obeyed in the concentration range of 5-50 µg/ml in all the methods. The values of standard deviation were satisfa tory low and the recovery studies were close to 100%. Saxagliptin showed a broad spectrum the derivative spe troscopy method applied has the advantage that it locate the hidden peaks in the normal spectrum when the spe trum is not sharp and it also eliminates the interference caused by the excipients present in the formulation. Hence these methods can be useful in the ro
of Saxagliptin in bulk drug and formulations.
Fig. 2: Zero order spectrum of Saxagliptin
Table I: Standard calibration table for saxa Order Derivative Spectrum
Sr.No. Conc. (µµµµg/ml) Absorbance
1 5
2 10
3 15
4 20
5 25
6 30
7 35
8 40
9 50
VD et al, Int J. Pharm. Drug. Anal, Vol: 4, Issue: 1, 2016; 30-34
Available online at http://ijpda.com
The stability of the standard solution was tested at inter-vals of 1, 6, 12 and 24 h. The stability of solutions was
de-nd B for the estimation of Saxagliptin (SXG) in tablet dosage form were found to be simple,
ac-Lambert’s law was 50 µg/ml in all the methods. The values of standard deviation were satisfac-tory low and the recovery studies were close to 100%. Saxagliptin showed a broad spectrum the derivative spec-troscopy method applied has the advantage that it locates the hidden peaks in the normal spectrum when the spec-trum is not sharp and it also eliminates the interference caused by the excipients present in the formulation. Hence these methods can be useful in the routine analysis
formulations.
Fig. 2: Zero order spectrum of Saxagliptin
Table I: Standard calibration table for saxagliptin Zero
Absorbance 0.125 0.248 0.375 0.512 0.623 0.746 0.858 0.972 1.247
Fig 3: Calibration curve of Saxagliptin in zero order d rivative spectrum
Fig. 4: first order derivative spectrum of Saxagli
Table II: Standard calibration table for Saxagli order derivative sp
Sr.No. Conc (µµµµg/ml)
1 05
2 10
3 15
4 20
5 25
6 30
7 35
8 40
9 45
10 50
Fig. 5: Calibration curve of Saxagliptin in first order d rivative spectrum.
32
Fig 3: Calibration curve of Saxagliptin in zero order de-rivative spectrum
Fig. 4: first order derivative spectrum of Saxagliptin
Table II: Standard calibration table for Saxagliptin First order derivative spectrum
Absorbance 0.003 0.006 0.009 0.012 0.015 0.018 0.021 0.024 0.026 0.029
VOL.4 ISSUE 1, 2016; 30 – 34 ; http://ijpda.com; ISSN: 2348-8948
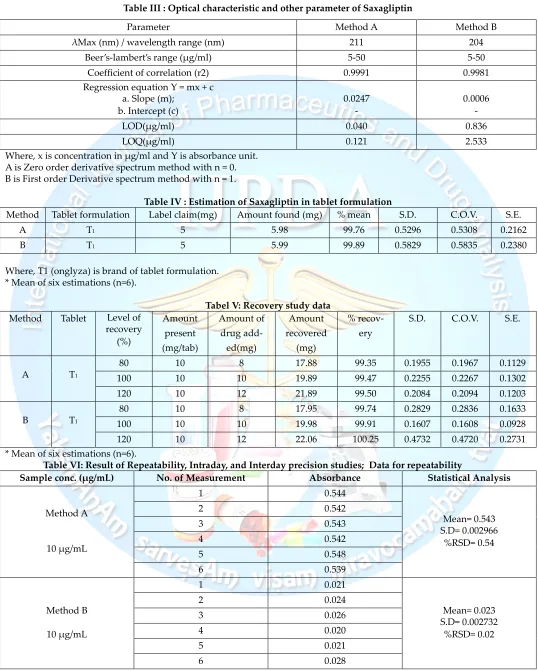
Table III : Optical characteristic and other parameter of Saxagliptin
Where, x is concentration in µg/ml and Y is absorbance unit. A is Zero order derivative spectrum method with n = 0. B is First order Derivative spectrum method with n = 1.
Table IV : Estimation of Saxagliptin in tablet formulation
Method Tablet formulation Label claim(mg) Amount found (mg) % mean S.D. C.O.V. S.E.
A T1 5 5.98 99.76 0.5296 0.5308 0.2162
B T1 5 5.99 99.89 0.5829 0.5835 0.2380
Where, T1 (onglyza) is brand of tablet formulation. * Mean of six estimations (n=6).
Tabel V: Recovery study data
Method Tablet Level of
recovery (%)
Amount present (mg/tab)
Amount of drug
add-ed(mg)
Amount recovered
(mg)
% recov-ery
S.D. C.O.V. S.E.
A T1
80 10 8 17.88 99.35 0.1955 0.1967 0.1129
100 10 10 19.89 99.47 0.2255 0.2267 0.1302
120 10 12 21.89 99.50 0.2084 0.2094 0.1203
B T1
80 10 8 17.95 99.74 0.2829 0.2836 0.1633
100 10 10 19.98 99.91 0.1607 0.1608 0.0928
120 10 12 22.06 100.25 0.4732 0.4720 0.2731
* Mean of six estimations (n=6).
Table VI: Result of Repeatability, Intraday, and Interday precision studies; Data for repeatability
Sample conc. (μg/mL) No. of Measurement Absorbance Statistical Analysis
Method A
10 µg/mL
1 0.544
Mean= 0.543 S.D= 0.002966
%RSD= 0.54
2 0.542
3 0.543
4 0.542
5 0.548
6 0.539
Method B
10 µg/mL
1 0.021
Mean= 0.023 S.D= 0.002732
%RSD= 0.02
2 0.024
3 0.026
4 0.020
5 0.021
6 0.028
Parameter Method A Method B
λMax (nm) / wavelength range (nm) 211 204
Beer’s-lambert’s range (µg/ml) 5-50 5-50
Coefficient of correlation (r2) 0.9991 0.9981
Regression equation Y = mx + c a. Slope (m);
b. Intercept (c)
0.0247 -
0.0006 -
LOD(µg/ml) 0.040 0.836
Sanjeev VD et al, Int J. Pharm. Drug. Anal, Vol: 4, Issue: 1, 2016; 30-34
Available online at http://ijpda.com
34
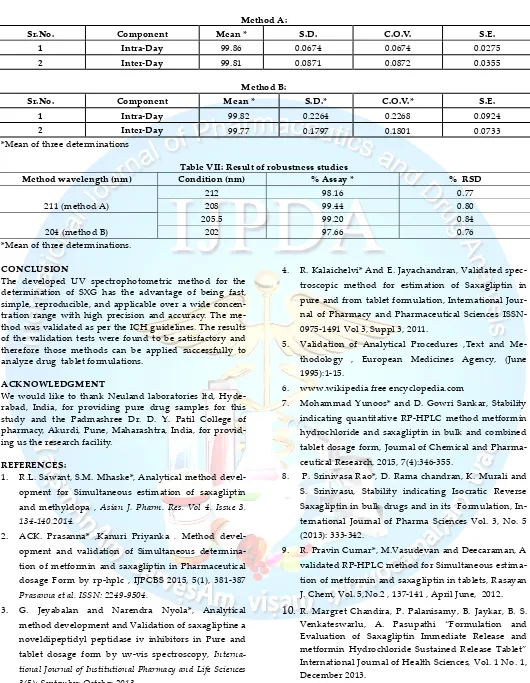
Method A:
Sr.No. Component Mean * S.D. C.O.V. S.E.
1 Intra-Day 99.86 0.0674 0.0674 0.0275
2 Inter-Day 99.81 0.0871 0.0872 0.0355
Method B:
Sr.No. Component Mean * S.D.* C.O.V.* S.E.
1 Intra-Day 99.82 0.2264 0.2268 0.0924
2 Inter-Day 99.77 0.1797 0.1801 0.0733
*Mean of three determinations
Table VII: Result of robustness studies
Method wavelength (nm) Condition (nm) % Assay * % RSD
211 (method A)
212 98.16 0.77
208 99.44 0.80
205.5 99.20 0.84
204 (method B) 202 97.66 0.76
*Mean of three determinations.
CONCLUSION
The developed UV spectrophotometric method for the determination of SXG has the advantage of being fast, simple, reproducible, and applicable over a wide concen-tration range with high precision and accuracy. The me-thod was validated as per the ICH guidelines. The results of the validation tests were found to be satisfactory and therefore those methods can be applied successfully to analyze drug tablet formulations.
ACKNOWLEDGMENT
We would like to thank Neuland laboratories ltd, Hyde-rabad, India, for providing pure drug samples for this study and the Padmashree Dr. D. Y. Patil College of pharmacy, Akurdi, Pune, Maharashtra, India, for provid-ing us the research facility.
REFERENCES:
1. R.L. Sawant, S.M. Mhaske*, Analytical method devel-opment for Simultaneous estimation of saxagliptin and methyldopa , Asian J. Pharm. Res. Vol 4, Issue 3, 134-140,2014.
2. ACK. Prasanna* ,Kanuri Priyanka , Method devel-opment and validation of Simultaneous determina-tion of metformin and saxagliptin in Pharmaceutical dosage Form by rp-hplc , IJPCBS 2015, 5(1), 381-387
Prasanna et al. ISSN: 2249-9504.
3. G. Jeyabalan and Narendra Nyola*, Analytical method development and Validation of saxagliptine a noveldipeptidyl peptidase iv inhibitors in Pure and tablet dosage form by uv-vis spectroscopy, Interna-tional Journal of InstituInterna-tional Pharmacy and Life Sciences 3(5): September-October 2013.
4. R. Kalaichelvi* And E. Jayachandran, Validated spec-troscopic method for estimation of Saxagliptin in pure and from tablet formulation, International Jour-nal of Pharmacy and Pharmaceutical Sciences ISSN-0975-1491 Vol 3, Suppl 3, 2011.
5. Validation of Analytical Procedures ,Text and Me-thodology , European Medicines Agency, (June 1995):1-15.
6. www.wikipedia free encyclopedia.com
7. Mohammad Yunoos* and D. Gowri Sankar, Stability indicating quantitative RP-HPLC method metformin hydrochloride and saxagliptin in bulk and combined tablet dosage form, Journal of Chemical and Pharma-ceutical Research, 2015, 7(4):346-355.
8. P. Srinivasa Rao*, D. Rama chandran, K. Murali and S. Srinivasu, Stability indicating Isocratic Reverse Saxagliptin in bulk drugs and in its Formulation, In-ternational Journal of Pharma Sciences Vol. 3, No. 5 (2013): 333-342.
9. R. Pravin Cumar*, M.Vasudevan and Deecaraman, A validated RP-HPLC method for Simultaneous estima-tion of metformin and saxagliptin in tablets, Rasayan J. Chem, Vol. 5,No.2 , 137-141 , April June, 2012.