M E T H O D O L O G Y
Open Access
Modern applications for a total sulfur reduction
distillation method - what
’
s old is new again
Gail L Arnold
1,2,3*, Benjamin Brunner
1,2,3, Inigo A Müller
1and Hans Røy
2Abstract
Background:The use of a boiling mixture of hydriodic acid, hypophosphorous acid, and hydrochloric acid to reduce any variety of sulfur compounds has been in use in various applications since the first appearance of this method in the literature in the 1920’s. In the realm of sulfur geochemistry, this method remains a useful, but under-utilized technique. Presented here is a detailed description of the distillation set-up and procedure, as well as an overview of potential applications of this method for marine sulfur biogeochemistry/isotope studies. The presented applications include the sulfur isotope analysis of extremely low amounts of sulfate from saline water, the conversion of radiolabeled sulfate into sulfide, the extraction of refractory sulfur from marine sediments, and the use of this method to assess sulfur cycling in Aarhus Bay sediments.
Results:The STrongly Reducing hydrIodic/hypoPhosphorous/hydrochloric acid (STRIP) reagent is capable of rapidly reducing a wide range of sulfur compounds, including the most oxidized form, sulfate, to hydrogen
sulfide. Conversion of as little as approximately 5 micromole sulfate is possible, with a sulfur isotope composition reproducibility of 0.3 permil.
Conclusions:Although developed many decades ago, this distillation method remains relevant for many modern applications. The STRIP distillation quickly and quantitatively converts sulfur compounds to hydrogen sulfide which can be readily collected in a silver nitrate trap for further use. An application of this method to a study of sulfur cycling in Aarhus Bay demonstrates that we account for all of the sulfur compounds in pore-water, effectively closing the mass balance of sulfur cycling.
Background
In recent years, it has become evident that the biogeochem-istry of sulfur is far more complex than previously thought. There are ample discoveries of so far unrecognized sulfur transformations, such as i) sulfate generation in methanic sediments well below the main sulfate zone, the so-called
“cryptic sulfur cycle”[1], ii) potential reduction of sulfate to zero-valent sulfur by methanotrophic archaea that utilize biochemical pathways different from classical bacterial dissimilatory sulfate reduction [2] and iii) the oxidation of reduced sulfur by cable forming bacteria [3], or iv) sulfur cycling in the oceanic crust [4]. These findings highlight three needs: First, the highly sensitive tracing of sulfur transformations with the help of radioactive 35S-labeled
compounds is more essential than ever; second, progress in our understanding of sulfur cycling without closed sulfur and sulfur isotope mass balances can hardly be achieved because potentially pivotal sulfur pools and fluxes escape our detection, and third, the sulfur isotope composition of sulfur compounds at very low concentra-tions must become accessible to allow for meaningful interpretations of so far hidden sulfur transformations. With the STrongly Reducing hydrIodic - hypoP hosphor-ous–hydrochloric acid (STRIP) method (presented here, modified from [5-8]), these needs can be covered to a sub-stantial degree. In the following, it will be demonstrated how the sulfur isotope composition of sulfate at extremely low concentration from highly saline environments can be determined by conventional gas-source isotope ratio mass spectrometry with the help of the STRIP method; it will be shown how the STRIP method can be used for the
production of 35S-labeled sulfide from the commonly
commercially available 35S-sulfate tracer; and examples * Correspondence:[email protected]
1Max Planck Institute for Marine Microbiology, 28359 Bremen, Germany
2
Center for Geomicrobiology, Department of Bioscience, Aarhus University, 8000 Aarhus, Denmark
Full list of author information is available at the end of the article
will be given on how this method can be used to obtain closed sulfur isotope mass balances, as well as for the assessment of undetected sulfur pools.
The use of hydriodic acid (HI) to reduce sulfur com-pounds can be found in the literature as far back the 1920’s [9] continuing to more recent applications, e.g. Shan and Chen [10]. However, HI alone will not liberate all sulfur species, leaving pyrite and organically-bound sulfur behind [10,11]. The combination of HI with
hy-pophosphorous acid (H3PO2) and hydrochloric acid
(HCl) to convert sulfur species including sulfate to H2S for analysis was first introduced by Luke [5] who used this method to determine the sulfur content of rubber. Many subsequent variations in the following decades adjusted both the initial concentrations and relative proportions of reagents to find an optimal combination that would yield good results while mini-mizing the amount of the relatively expensive HI used (Table 1; [5,11]).
In the realm of sulfur isotope geochemistry, the most commonly referenced work using this method is from Thode et al. [7] who used the STRIP distillation to con-vert barium sulfate (BaSO4) to silver sulfide (Ag2S) for subsequent isotopic analysis. Simultaneously a method that is similar in its applications but employs a mixture of stannous chloride with phosphoric acid (the Kiba reagent) was developed [12] and subsequently refined [13]. The later advent of the direct conversion of BaSO4 to SO2for sulfur isotope analysis removed the necessity to covert the BaSO4to Ag2S for most applications [14]. Besides its application in the conversion of sulfur bearing samples to Ag2S for subsequent fluorination techniques for multiple sulfur isotope analysis (e.g. [15]) the STRIP method has fallen into dis-use. There is a suite of reasons why this should not be the case, examples of which will be presented in this study. The aim of this contribution is not a comprehensive test of the STRIP method as recent pub-lications have been with regards to the chromium (Cr)-distillation [16,17] but means to bring this highly useful technique with a complete method description back into
view in light of its many potential applications in the realm of sulfur isotope biogeochemistry.
Methods
Preparation of the reducing reagent
Preparations of and distillations using the STRIP reagent should be done in a well-ventilated hood. The reducing reagent recipe here follows that of Thode et al. [7]. Note that the concentration reported for hydriodic acid has varied through the years, as well as the chemical formula for hypophosphorous acid reported in the literature (Table 1). With regard to the concentration of hydro-chloric acid used in the preparation of the reagent, existing literature only specifies “concentrated” (Table 1; [5-8,15]). The purpose of the hydrochloric acid has been suggested to increase acidity and volume, such that less hydriodic acid is required [11]. In the course of this study, 32%, 36% or 37% hydrochloric acid has been used at one time or another and no difference in the performance of the reagent has been observed.
The reagent should be prepared under a stream of ni-trogen (N2) or other inert gas to avoid oxidation with O2. The reagent preparation will generate a lot of acid fumes, thus the flask top must be firmly set and clamped in place (or it will pop up during the boiling and spit hot acid around) and a water trap, ideally a gas wash bottle, should be connected to the outlet of the flask (Figure 1). In a 1000 ml round bottom flask, 200 ml HI (57%), 100 ml H3PO2 (50%), and 330 ml HCl (concentrated) are com-bined, and a small spoonful of boiling stones is added to the flask. The boiling stones should be silicon carbide [5,18] or some other suitably dense material. PTFE boiling chips are unsuitable as they will float on top of the acid mixture. The flask is placed on a heating mantle, the gas lines assembled, and the N2gas set to as gentle a stream as possible. The mixture is brought to a vigorous boil and boiled for 60 minutes to remove any sulfur contamination present in the reagents. The mixture should be allowed to cool under the N2 stream. Once the mixture is cool, it
Table 1 Commonly referenced literature for STRIP reagent in sulfur geochemistry and reagent details
Luke, 1943 Pepkowitz & Shirley 1951
Thode et al. 1961
Forrest & Newman 1977
Johnston et al. 2007
Arnold et al. This study
Hydriodic acid 160 ml 100 ml 500 ml 500 ml 125 ml 200 ml
s.g. = 1.7 47% s.g. = 1.7 48% n.o.s. s.g. =1.7, 57%
45 ml 40 ml 245 ml 245 ml 61 ml 100 ml
Hypophosphorous acid n.o.s. H3PO2 H3PO2 H3PO3* H2PO4* H3PO2
50% 30% 50% 50% n.o.s. 50%
Hydrochloric acid 160 ml 160 ml 816 ml 816 ml 205 ml 330 ml
n.o.s. conc conc conc n.o.s. 36%
should be stored in a brown glass bottle to avoid photo-oxidation of HI [5].
As the STRIP reagent may oxidize over time, note the date of the preparation on the bottle and use the reagent within 6 months of its preparation. Smaller batches can be made. Due to the vigorous nature of the boiling, reagent batches should not exceed a total volume of 630 ml per 1000 ml flask.
Preparation of test samples
All samples, solid or aqueous, processed during the development of this method started from the same commercially available sodium sulfate (Na2SO4, Sigma-Aldrich Lot #S23924-206). A sulfate control solution (~25 mM) was made by dissolving a known amount of Na2SO4in ultraclean water. Method development samples are numbered sequentially and labeled either with a “C” (for control) or“S”(for standard) prefix. The C series were run solely for method development. The S series were run as internal standards during the Aarhus Bay study.
Distillation apparatus
Samples are distilled in a 100 ml round bottom, 3-neck flask, connected to a condensing reflux column with recirculating chilled (4°C) water (Figure 2). The outlet of the condensing column is followed by a water trap, which is then followed by the trapping solution. It is ad-vised to keep the amount of tubing between individual glass parts as minimal as possible to limit exposure of tubing to the reagent fumes. First applications of the STRIP distillation were the reduction of sulfur in rubber samples [5], so this mixture may be detrimental to any tubing it comes in contact with. Silicon tubing, which in this study was originally used to connect the outlet of the 1000 ml flask to the gas wash bottle during the
preparation of the reagent, was rapidly degraded after a few uses. Viton® tubing was used for the connections in the distillation apparatus and has shown the most durability.
Distillation method
This reagent will reduce all sulfur species (sulfate, sulfide, elemental S, polysulfides, all sulfur intermediate species, and any other sulfur compounds present) of a sample to H2S gas. To begin sample preparation, a sam-ple (aqueous or solid) is transferred into the distillation flask and dried. Aqueous samples that contain sulfide should be fixed with zinc acetate (ZnAc) prior to the drying procedure to avoid degassing of sulfide and/or oxidation of sulfide. The use of ZnAc as the precipita-tion agent instead of zinc chloride has the advantage that the protons liberated from bisulfide and hydrogen sulfide can form a relatively weak acid (acetic acid) which degasses upon drying. If only chloride is present, the drying procedure could result in a more acidic sam-ple (hydrochloric acid), which–unlike acetic acid–has the potential to liberate sulfide from zinc sulfide. Larger volume aqueous samples or wet sediments can be dried overnight in a 70°C oven. Smaller volume aqueous sam-ples may be dried in the distillation flask with gentle heating from the hot plate. The sample must be dried completely such that no water remains. Any water from the sample will condense in the column and drip back into the reagent where it immediately vaporizes due to flash boiling. This and the subsequent rapid condensa-tion of water vapor in the cooling column creates large
and dangerous pressure “bumps” and back fluxing of
vapors and trap fluids. After drying of the samples, a few boiling stones (see section on preparation of STRIP reagent) are added to the sample flask and the distillation
apparatus is assembled, cooling water and N2 gas flow started. Because the acid mixture is brought rapidly to a boil, it is important to make sure that the cooling water has reached a stable temperature prior to heating the sample. Approximately 20 to 30 ml of STRIP reagent are added to the sample via an inlet port on one side of the distillation flask (Figure 2). The reagent-sample mixture is then brought to a boil as swiftly as possible. Distillation at low temperatures will result in lower yields [5]. Once the sample-reagent mixture is boiling any sulfur present is reduced to H2S. The evolved H2S and acid fumes are
transported by the N2gas stream first into the water trap which serves as a trap for acid fumes and subsequently into a 10 ml 1 M AgNO3trap where the H2S is trapped and converted to Ag2S. Despite the presence of a water trap, a certain amount of acid fumes (likely HI) will make it to the silver nitrate (AgNO3) trap, increasing the appar-ent Ag2S yield. The excess precipitate is grey/black in color and is not dissolved with NH4OH suggesting that the excess is not AgCl, but may be something else, for instance AgI or a phosphorus compound. Samples are distilled for 1 hour, after which the hot plate is turned off and the N2 flow in maintained for another hour to 1) allow the very hot boiling acid to cool sufficiently to handle safely and 2) to ensure that all H2S in the system has been carried to the final trap. Once cool, the AgNO3 trap is removed and the Ag2S is separated and thoroughly washed with ultra-clean water and dried. We recommend turning off the N2 flow only after the traps have been removed from the distillation assembly. This ensures that there is no back-aspiration of fluids resulting in loss of sample.
Quantification of distilled sulfur and isotope analysis
The STRIP distillation samples always have greater apparent Ag2S yields than is predicted from the amount of sulfur distilled. For the determination of the sulfur isotope compositions of pure substances, i.e., Na2SO4, BaSO4, or Ag2S standards, 0.2–0.4 mg are weighed into tin capsules. Approximately 0.5 mg of vanadium pent-oxide (V2O5) is added to both standards and samples. Greater amounts are weighed in for the STRIP distil-lation samples. First, the weight of the entire ‘Ag2S’ precipitate is recorded and then an appropriate aliquot of sample is weighed into the tin capsule. For example, with samples of known sulfur content such as pore-waters where the sulfate and sulfide concentrations have been determined prior to the preparation of the isotope analysis samples, if the predicted mass of Ag2S is 1.0 mg but 3.0 mg of precipitate are recovered, we then know that the Ag2S in the sample is diluted by a factor of 3, thus 3 times more sample needs to be weighed in (0.9 mg instead of 0.3 mg). This technique has its limitations as the amount of sample that can fit in a tin cup is limited. Up to 2.0 mg of precipitate has been run as a single sample with no detectable ill-effects such as poor combustion, double peaks or extended peak tail-ing durtail-ing isotopic analysis. For samples where the sulfur content is not known at the time of isotopic analysis, a second single-step Cr-distillation can be used to purify the STRIP method precipitate [17,19], yielding only Ag2S, which can then be weighed in as appropriate. The samples and standards were combusted with an elemental analyzer (EURO EA Elemental Analyzer, set to 1060°C) to produce SO2. A helium stream carried the evolved SO2through a
Figure 2Distillation apparatus.Connections are either ground glass surface or connected with short segments of Viton® tubing. First trap = 45 ml water. Second trap = 10 ml AgNO3. Fluid levels
GC column and Finnigan Conflo III into a Finnigan Delta V stable isotope ratio mass spectrometer (IRMS). The sulfur isotope measurements were calibrated with refer-ence materials NBS 127 (δ34S = +20.3‰) and IAEA-SO-6 (δ34S =−34.1‰). The standard error (1σ) for replicate measurements of a laboratory standard was less than 0.2‰. Quantification of sulfur content is obtained by comparing the integrated peaks areas (in V∙s, detected and quantified by IRMS software) samples against the peak areas produced from known amounts of standards, followed by the calculation of the total amount of distilled sulfur from the comparison of the weight of the com-busted sample to the total weight of the precipitate.
Results and discussion Choice of trapping solution
The most recent studies using the STRIP distillation method describe the conversion of BaSO4to Ag2S as a
process where ZnAc is used in place of AgNO3 as the
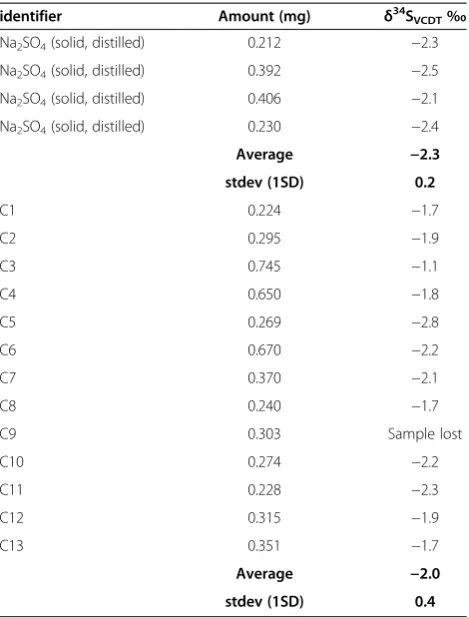
sulfide trap. In a subsequent separate step, the produced ZnS is then converted to Ag2S which can be used for sulfur isotope analysis via fluorination [15,20,21]. The utilization of ZnAc as the initial trapping solution is problematic as the acid fumes from the distillation that are not condensed in the cooling column rapidly acidify all subsequent solutions in the distillation including the final trap. If the ZnAc trap is exposed to acidification, then any ZnS that had been precipitated will be re-dissolved and sulfur lost as H2S. The use of ZnAc as the trapping solution was initially tested as part of the development of this study, but sulfur isotope compos-ition results were offset from the known composcompos-ition and the reproducibility was less than desirable (Table 2). For these reason we moved to the use of AgNO3as the trap-ping solution.
Reproducibility of the STRIP distillation method using a AgNO3trap
Poor reproducibility was observed when the AgNO3trap volume was changed from 10 to 5 ml. Stoichiometry is not the only consideration when designing the trap volume and concentration. The length and speed at which the H2S travels with the carrier gas N2through the trap needs be taken into consideration as well. Excessive carrier gas flow or too short a path will result in poorer data reproducibility (Table 3).
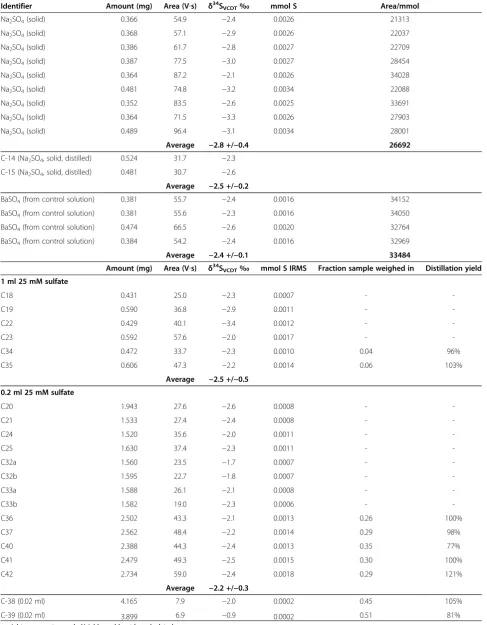
In order to test the yield and reproducibility of the STRIP distillation method with the appropriate 10 AgNO3trap, sulfate in varying quantities and form was distilled. Results for the reproducibility and integrity of the STRIP distillation method are summarized in Table 4. Repeated distillations of 1 ml and 0.2 ml of the control solution, 25 and 5 μmole of sulfate-sulfur, respectively, yielded results ofδ34SVCDT= -2.5 ± 0.5‰and−2.2 ± 0.3‰
(Table 4), respectively and -2.3 ± 0.3‰collectively. Barium sulfate was directly precipitated from the control solution and directly analyzed, yielding δ34SVCDT= -2.4 ± 0.1‰. The solid sodium sulfate was also analyzed directly, yield-ing a δ34SVCDT= -2.9 ± 0.4‰. Peak areas for the Na2SO4 solid were 23% smaller than the average for either Ag2S or BaSO4 standards, indicating poor combustion in the re-actor, likely contributing to the shifted sulfur isotope com-position of the Na2SO4relative to the BaSO4precipitated from the solution and the Ag2S produced from the distil-lation of the control solution (Table 4). Regardless of the complications associated with the isotope analysis of solid Na2SO4, there is no observed offset between the results obtained with the BaSO4 precipitation method and the STRIP distillation.
In summary, the use of AgNO3 as the trapping
solu-tion alleviated all problems associated with sample loss and lack of reproducibility. Although AgNO3as a trap-ping agent does have the drawback of excess precipitate forming in the trap, the excess mass has not proved at all detrimental to further isotopic analyses and if neces-sary can be removed by a second distillation using the Cr-distillation [17,19] method.
Table 2 Results of STRIP distillation with 10 ml 5% ZnAc trap
identifier Amount (mg) δ34S
VCDT‰
Na2SO4(solid, distilled) 0.212 −2.3
Na2SO4(solid, distilled) 0.392 −2.5
Na2SO4(solid, distilled) 0.406 −2.1
Na2SO4(solid, distilled) 0.230 −2.4
Average −2.3
stdev (1SD) 0.2
C1 0.224 −1.7
C2 0.295 −1.9
C3 0.745 −1.1
C4 0.650 −1.8
C5 0.269 −2.8
C6 0.670 −2.2
C7 0.370 −2.1
C8 0.240 −1.7
C9 0.303 Sample lost
C10 0.274 −2.2
C11 0.228 −2.3
C12 0.315 −1.9
C13 0.351 −1.7
Average −2.0
stdev (1SD) 0.4
Caveats of the method
If nitrate is present, the H2S may be oxidized to elemen-tal sulfur in the condensing column [6]. Care should also be taken with samples high in organic matter content as the presence of organic matter makes the distillation reaction more exergonic and earlier applications of this method contained steps to remove organic compounds prior to the addition of the STRIP reagent [5,6,11]. It re-mains unclear whether the initial oxidation of refractory organic compounds prior to the treatment of the sample with the STRIP distillation in early studies was to improve the sulfur yield during distillation or to avoid potentially dangerous distillation conditions.
Examples for the application of the STRIP method
In the following, we present four different examples in which the STRIP method can be used, and highlight specific adjustments in the methodology that have to be made for obtaining an optimal outcome.
Preparation of low sulfate concentration pore-water samples for sulfur isotope analysis
At concentrations below ~0.5 mM sulfate, the traditional
method of precipitating BaSO4 from a sample of
sea-water, pore-sea-water, or marine or fresh-water type media by the addition of barium chloride (BaCl2) frequently fails. While the use of ion selective resin is useful to pre-concentrate sulfate in fresh-water samples [22-24], the resin based method remains unfavorable in marine and marine-type media due to the high and close affinity of the resin for chloride and sulfate. Recently, the use of
multiple collector – inductively coupled plasma mass
spectrometry (MC-ICPMS) has been developed for the analysis of extremely small quantities of sulfate [25,26]. Although sulfur isotope analysis by MC-ICPMS lowers the detection limit for sulfur isotope analysis by several orders of magnitude (down to ~5 nmol S), the sample preparation prior to the MC-ICPMS analysis still requires resin based chemistry and there are less than a handful of facilities that specialize in this instrumentation and meth-odology [25,27]. The STRIP reagent presented here offers a reliable, straightforward, affordable and widely accessible alternative, which can be even employed when the BaCl2 method or resin pre-concentration method is not useful. As the STRIP reduction-distillation method will reduce all sulfur present in the sample, if other sulfur species (e.g. sulfide) are present, care must be taken to separate the sulfur species prior to the beginning of the distillation. Sulfide that may be present in the sample can be separated from the sulfate through the addition of ZnAc. Directly after sample collection 0.2 ml of 20% ZnAc per 1.0 ml sample is added. Sulfide present in the sample will precipi-tate as solid zinc sulfide (ZnS). The ZnS and elemental sulfur is separated from the supernatant by vacuum filtra-tion (0.2μm). The supernatant, which at this point should contain mostly sulfate, but may also contain sulfur inter-mediates such as thiosulfate or sulfite, can then be distilled to Ag2S for further analysis using the STRIP distillation method. If the presence of significant quantities of thio-sulfate or sulfite is suspected, these compounds can be removed via acidification. Thiosulfate will disproportion-ate into sulfur dioxide and elemental sulfur and sulfite will
Table 3 Results from 5 vs 10 ml AgNO3trap
5 ml 0.1 M AgNO3 10 ml 0.1 M AgNO3
Identifier Amount (mg) Area (V∙s) δ34SVCDT‰ Identifier Amount (mg) Area (V∙s) δ 34
SVCDT‰
S5 0.385 17.5 -1.6 C20 1.943 27.6 -2.6
S6 0.399 17.3 -2.0 C21 1.533 27.4 -2.4
S7 0.350 7.1 -1.2 C24 1.520 35.6 -2.0
S8 0.383 14.0 -1.7 C25 1.630 37.4 -2.3
S9 0.476 20.6 -1.7 C32a 1.560 23.5 -1.7
S10 0.377 8.7 -0.5 C32b 1.595 22.7 -1.8
S11 0.353 6.3 -1.0 C33a 1.588 26.1 -2.1
S12 0.378 10.0 -0.8 C33b 1.582 19.0 -2.3
S13 0.423 12.4 -2.0 C36 2.502 43.3 -2.1
S14 0.451 17.1 -3.0 C37 2.562 48.4 -2.2
S15 0.944 27.5 -2.2 C40 2.388 44.3 -2.4
Average -1.6 C41 2.479 49.3 -2.5
stdev (1SD) 0.7 C42 2.734 59.0 -2.4
Average -2.2
stdev (1SD) 0.3
Table 4 Summary STRIP distillation results for Na2SO4
Identifier Amount (mg) Area (V∙s) δ34SVCDT‰ mmol S Area/mmol
Na2SO4(solid) 0.366 54.9 −2.4 0.0026 21313
Na2SO4(solid) 0.368 57.1 −2.9 0.0026 22037
Na2SO4(solid) 0.386 61.7 −2.8 0.0027 22709
Na2SO4(solid) 0.387 77.5 −3.0 0.0027 28454
Na2SO4(solid) 0.364 87.2 −2.1 0.0026 34028
Na2SO4(solid) 0.481 74.8 −3.2 0.0034 22088
Na2SO4(solid) 0.352 83.5 −2.6 0.0025 33691
Na2SO4(solid) 0.364 71.5 −3.3 0.0026 27903
Na2SO4(solid) 0.489 96.4 −3.1 0.0034 28001
Average −2.8 +/−0.4 26692
C-14 (Na2SO4, solid, distilled) 0.524 31.7 −2.3
C-15 (Na2SO4, solid, distilled) 0.481 30.7 −2.6
Average −2.5 +/−0.2
BaSO4(from control solution) 0.381 55.7 −2.4 0.0016 34152
BaSO4(from control solution) 0.381 55.6 −2.3 0.0016 34050
BaSO4(from control solution) 0.474 66.5 −2.6 0.0020 32764
BaSO4(from control solution) 0.384 54.2 −2.4 0.0016 32969
Average −2.4 +/−0.1 33484
Amount (mg) Area (V∙s) δ34SVCDT‰ mmol S IRMS Fraction sample weighed in Distillation yield 1 ml 25 mM sulfate
C18 0.431 25.0 −2.3 0.0007 -
-C19 0.590 36.8 −2.9 0.0011 -
-C22 0.429 40.1 −3.4 0.0012 -
-C23 0.592 57.6 −2.0 0.0017 -
-C34 0.472 33.7 −2.3 0.0010 0.04 96%
C35 0.606 47.3 −2.2 0.0014 0.06 103%
Average −2.5 +/−0.5 0.2 ml 25 mM sulfate
C20 1.943 27.6 −2.6 0.0008 -
-C21 1.533 27.4 −2.4 0.0008 -
-C24 1.520 35.6 −2.0 0.0011 -
-C25 1.630 37.4 −2.3 0.0011 -
-C32a 1.560 23.5 −1.7 0.0007 -
-C32b 1.595 22.7 −1.8 0.0007 -
-C33a 1.588 26.1 −2.1 0.0008 -
-C33b 1.582 19.0 −2.3 0.0006 -
-C36 2.502 43.3 −2.1 0.0013 0.26 100%
C37 2.562 48.4 −2.2 0.0014 0.29 98%
C40 2.388 44.3 −2.4 0.0013 0.35 77%
C41 2.479 49.3 −2.5 0.0015 0.30 100%
C42 2.734 59.0 −2.4 0.0018 0.29 121%
Average −2.2 +/−0.3
C-38 (0.02 ml) 4.165 7.9 −2.0 0.0002 0.45 105%
C-39 (0.02 ml) 3.899 6.9 −0.9 0.0002 0.51 81%
be converted to sulfur dioxide. The elemental sulfur can then be filtered out and the sulfur dioxide can be degassed from the sample.
Conversion of35S-sulfate to35S-sulfide tracer
Sulfide is a substrate for many oxidative S-cycling pro-cesses and an important reactant for the synthesis of other 35S-labeled compounds. The reductive distillation of35S-sulfate to35S-sulfide tracer is principally the same as for any other aqueous sulfur distillation, given proper safety measures required for the handling of radioactive materials are taken. An appropriate amount of35S-sulfate tracer is transferred to the distillation flask, gently dried and distilled. Because the sulfate concentration in the radio-tracer is so low, the STRIP distillation should be performed using a 10 ml or larger de-oxygenated AgNO3 sulfide trap to ensure that 100% of the converted tracer is trapped. The entire contents of the trap can then be dried into a new distillation flask for a subsequent Cr-distillation [17,19]. The adjustment here is that the trapping solution for the Cr-distillation should be changed, because is it preferable to obtain a dissolved 35
S sulfide tracer instead of a solid Ag235S product. Hence, sodium hydroxide (NaOH, also de-oxygenated) should be used as the trapping solution. There are two considerations to keep in mind when calculating the volume and strength of the NaOH solution to be used. First, and most straight forward, is the stoichiomet-ric balance needed to trap and convert the evolved H2S to Na2S in solution. Second, the volume of the trap must be optimized such that the desired activity per volume is achieved. An earlier study directly used 1 M NaOH as the trapping solution with a STRIP distillation method and reported satisfactory tracer recovery (~100%, [28]). Our attempts at replicating this yielded results in the 30 to 50% recovery range. As such, we suggest the use of AgNO3 as the STRIP distillation trap, followed by sub-sequent conversion to a dissolved tracer form using a Cr-distillation and appropriate trap.
Solid phase samples–sediment and rock
The analysis of the quantity and sulfur isotope com-position of acid-volatile sulfur and chromium-reducible sulfur (CRS) in sediments and rocks ([17] and references therein) is common to many sulfur geochemistry studies. The STRIP distillation can be used for the determination of the sulfur content and isotope composition of bulk sediment and rock samples, or can be used as a final step in a sequential extraction scheme, for example in series with a Cr-distillation step, to determine the refrac-tory/residual sulfur phases. For both rock and sediment, the sample should be well homogenized and ground to a fine powder. Sediment and rock samples high in carbonate
content should be de-carbonated prior to distillation. Wet sediment needs to be dried prior to distillation.
We applied the STRIP reagent to marine sediments in a sequential extraction. After thawing, the samples
(~5 g) were covered with 50–100 ml of 2 M sodium
chloride solution. Over at least 24 hours, the sediment was repeatedly brought in suspension by stirring. Subse-quently, the supernatant was decanted and the sample was washed with deionized water by three consecutive centrifugation-resuspension steps. The sodium chloride leaching step serves to remove sulfate that is not intim-ately associated with carbonate from the samples. Next, the carbonate in the sample was rapidly dissolved by the addition of hydrochloric acid (HCl, 10 M) to liberate carbonate associated sulfate (CAS). Addition of HCl was stopped when no further evolution of carbon dioxide (bubbles) was observed with additional acid treatment. The supernatant was immediately filtered, and a satu-rated BaCl2solution (~1.3 M BaCl2in 0.05 M HCl) was added to induce the precipitation of BaSO4. After min-imally 12 hours, the precipitated BaSO4 was recovered by centrifugation and decanting of the supernatant. The
BaSO4was washed with deionized water by three
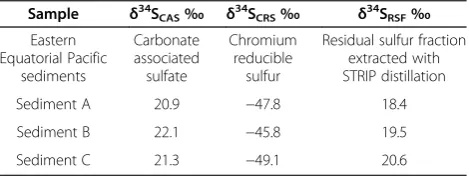
con-secutive centrifugation-resuspension steps. For a discus-sion of the caveats of the CAS extraction methods, see [29]. After the CAS extraction, the sample was thor-oughly washed and subsequently dried. Next a single-step Cr-reduction distillation was performed to obtain Cr-reducible sulfur [17,19]. Then the washing and drying step was repeated. Lastly, a STRIP distillation was applied to recover any residual sulfur fraction (RSF). The intri-guing outcome of this sequential extraction (Table 5) was that the sulfur isotope composition of CAS and RFS-sulfur (averageδ34S = +20.5‰) were almost identical and close to the composition of seawater sulfate, whereas CRS was strongly depleted in34S (averageδ34S =−47.6‰). We speculate that the residual sulfur pool, only accessible with the STRIP distillation, was marine barite. This would explain the similarity between the sulfur isotope com-position of CAS, RSF, and seawater sulfate. From the methodological viewpoint, this result shows that STRIP-sulfur accessed a different STRIP-sulfur pool than CRS, i.e. that no residual pyrite influenced the obtained results. Other
Table 5 Sequential distillation of unconsolidated marine sediment
Sample δ34S
CAS‰ δ34SCRS‰ δ34SRSF‰
Eastern Equatorial Pacific
sediments
Carbonate associated sulfate
Chromium reducible
sulfur
Residual sulfur fraction extracted with STRIP distillation
Sediment A 20.9 −47.8 18.4
Sediment B 22.1 −45.8 19.5
research groups add the STRIP reagent directly to the Cr-reagent after the Cr-distillation is complete and obtain satisfactory results with this technique [18]. At this point, it should be noted that the STRIP reagent will extract all remaining sulfur from a sample in a se-quential leaching procedure. Thus, if barite is one of the specifically targeted sulfur phases, a leaching step that is more selective would be indicated, for example the barite dissolution/re-precipitation technique using a chelating agent [30], which could then be followed by the final STRIP step.
Application to Aarhus Bay - a pilot study
Motivation: Exciting new hypotheses in sulfur biogeo-chemistry (e.g. [2]) highlight the fact that progress in our understanding of sulfur cycling without closed sulfur and sulfur isotope mass balances can hardly be achieved because pivotal sulfur pools and fluxes may have escaped detection when following standard analyses. Station M1 in Aarhus Bay is a popular sampling site with well char-acterized rates of both organoclastic sulfate reduction and sulfate reduction coupled to the anaerobic oxidation of methane. We chose this site to apply the STRIP distil-lation to pore-water samples and assess the sulfur mass balance of this system.
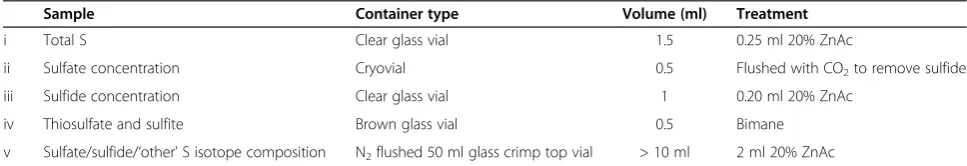
Sampling and analyses: An approximately 2 meter long gravity core was retrieved during a short sampling cruise in May 2011. The core was transported to labo-ratories at Aarhus University where pore-water was extracted on the same day. The gravity core was sub-sampled by cutting 20 cm whole-round sections, one end of the sub-section was capped and the other end was covered tightly with plastic wrap ensuring no air pockets between the plastic foil and sediment surface. Pore-water was extracted using Rhizon® pore-water samplers inserted through a small hole punctured in the plastic wrap (for description and supplier, see p 99–100 in [31]). Pore-water volumes extracted ranged from 10 ml from the deepest sample to ~50 ml in the shallowest samples. Once pore-water extraction was complete, the pore-water was split into sub-samples for i) total sulfur concentration and isotope composition, ii) sulfate concentration, iii) sulfide concentration, iv) thiosulfate concentrations and v) sulfate/sulfide/‘other’ S isotope composition (Table 6). Weights and volumes were noted at every step. Sulfate,
sulfide, and thiosulfate concentrations were analyzed by standard methods (ion chromatography [31], diamine/ spectrophotometric methods [32], and bimane/HPLC [33], respectively). Series v samples were treated sequen-tially to separate sulfide and sulfate from any remaining unidentified S-species in solution. First, ZnS was separated from the sample by vacuum filtration through a 0.2 μm filter. The ZnS was dried on the filter paper in a 50°C oven overnight, after which it was carefully removed from the filter and retained for S isotope analysis. With a modified vacuum filtration system, the filtrate was directly collected in clean 50 ml vials that were subsequently acidified with 0.1 ml ultraclean HCl, after which the sample was flushed with a 10:90 CO2:N2gas mixture for one hour to ensure that no sulfide remains in the sample. Next, a sub-sample was transferred to a centrifuge tube and a saturated solu-tion of BaCl2(~1.3 M BaCl2in 0.05 M HCl) was added to precipitate sulfate as BaSO4. The following day, the sam-ples were centrifuged and the supernatant was pipetted off into an open syringe and filtered through a 0.2μm syringe filter into a new centrifuge tube. The BaSO4precipitate was washed several times, dried overnight in a 50°C oven and retained for sulfate-S isotope analysis. Series i and the final filtrate of the series v samples were dried and distilled using the STRIP distillation with a 5 ml AgNO3trap.
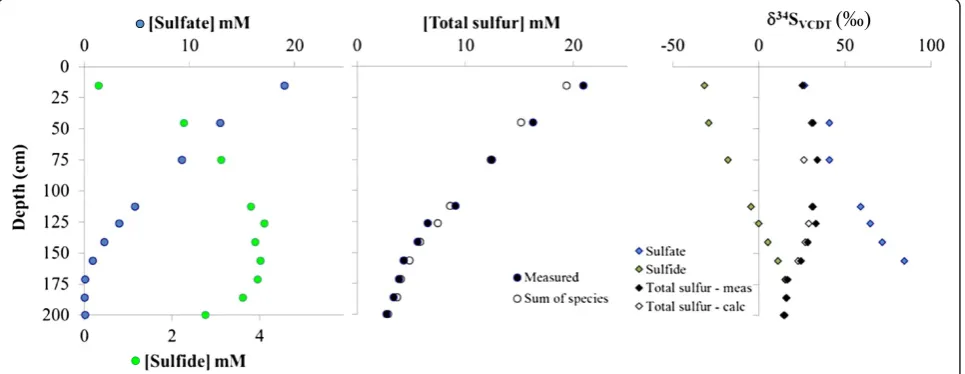
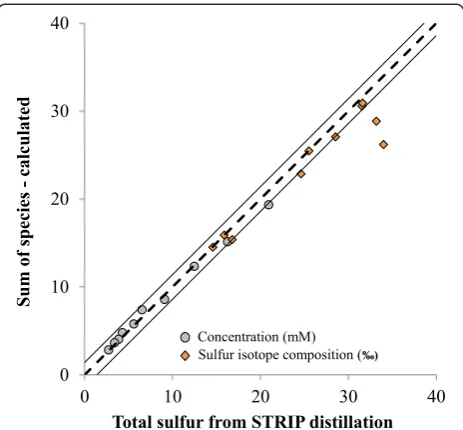
Sulfur isotope mass balance of pore-water at station M1 in the Aarhus Bay: Total sulfur concentrations, determined via the STRIP distillation method, decrease with increasing depth in the sediment. There is strong agreement between the total sulfur concentrations deter-mined from the STRIP distillation with the sum of the individually measured sulfur pools (sulfate + sulfide + thiosulfate) with less than 10% discrepancy between the two values throughout the profile (Table 7, Figure 3). The sulfur isotope composition of the ‘total sulfur’ (δ34STSmeas) samples also provide a good match with the total sulfur isotope composition calculated (δ34STScalc) from the sulfate and sulfide fractions (Figure 4). Two total sulfur sulfur-isotope composition data points are obvious outliers when comparingδ34STSmeasvs.δ34STScalc. The calculated total sulfur isotope composition of the sample from 75 cm shows the greatest deviation from the measured counterpart. This is likely the result of poor sample handling/labeling during the preparation of the sulfate-sulfur isotope sample. First, this sample has a
Table 6 Aarhus Bay sampling scheme
Sample Container type Volume (ml) Treatment
i Total S Clear glass vial 1.5 0.25 ml 20% ZnAc
ii Sulfate concentration Cryovial 0.5 Flushed with CO2to remove sulfide
iii Sulfide concentration Clear glass vial 1 0.20 ml 20% ZnAc
iv Thiosulfate and sulfite Brown glass vial 0.5 Bimane
nearly identical sulfate-sulfur composition as the sample from 45 cm (Figure 3). Second, because the volume and weight is recorded at every stage of sample preparation, we can gravimetrically back-calculate the pore-water
sulfate concentration for any BaSO4 sample that was
prepared. When this is done for the 75 cm sample a sulfate concentration of 14.4 mM is obtained, again nearly identical to that calculated for the 45 cm sample (14.5 mM calculated, 12.9 mM measured) and far re-moved from the measured sulfate concentration for the 75 cm sample ([SO4] = 9.2 mM, Table 7). Together, these observations strongly indicate that sulfate-sulfur isotope sample at 75 cm is corrupted, which comprises the δ34
STScalcvalue and so we neglect this sample from further consideration.
Looking at the remaining data, we are still left to con-sider an outlier at 126 cm and the general observation that although the rest of the data fall within two stand-ard deviations of the expected 1:1 trend (Figure 4), half
of the data lie at the very edge of the error margin. At first glance, this deviation might give the impression that an unidentified sulfur pool exists that contributes to the shift in δ34S. However, if we consider the total sulfur concentrations for these samples it becomes evident that the concentrations of the total sulfur samples are smaller than the sum of the sulfur species, the opposite of what one should observe if a ‘missing’ sulfur pool existed in this depth range (Table 8, Figure 3). In addition, there is the observation that the sulfur isotope compositions of total sulfur are heavier (Table 8; Figure 4) than the value of the sum of all species. With the caveat that we cannot predict the isotope fractionation processes for biochem-ical reactions between unknown sulfur pools and yet-undeciphered sulfur disproportionation pathways, we propose that typically, one would expect that sulfate is the isotopically heaviest pool, and that any other missing sulfur intermediates would likely have lighter values, resembling more the isotope composition of sulfide. In
Table 7 Summary of results from the Aarhus Bay pore-water study
Sample ID Depth (cm) Total sulfur (mM) Sulfate (mM) Sulfide (mM) Thiosulfate (mM) δ34STSmeas‰ δ 34
SSO4‰ δ 34
SHS-‰
1 15.0 20.9 19.0 0.3 0.011 25.5 26.5 −31.6
2 45.0 16.2 12.9 2.3 0.000 31.5 41.0 −29.1
3 75.0 12.5 9.2 3.1 0.011 34.0 41.1 −17.8
4 112.3 9.1 4.8 3.8 0.016 31.6 59.2 −4.6
5 126.0 6.5 3.3 4.1 0.008 33.2 64.7 0.1
6 141.0 5.6 1.9 3.9 0.014 28.5 71.8 5.4
7 156.0 4.3 0.8 4.0 0.012 24.6 84.7 11.2
8 171.0 3.8 0.08 4.0 0.011 16.8 - 15.7
9 185.8 3.4 0.02 3.6 0.018 15.9 - 16.1
10 199.5 2.7 0.07 2.8 0.023 14.6 - 15.0
-Samples below 150 cm did not produce enough BaSO4for sulfur isotope analysis.
such a case the δ34STSmeas should be lighter than the δ34
STScalc, again the opposite of what is observed. The use of a smaller (5 ml) AgNO3trap in the STRIP distillation (Table 3), as was used in the Aarhus Bay study, tends to yield heavierδ34STSmeas, and is likely the cause for the offset in the data. In addition, although each of the samples in question was distilled on a separate day, three were distilled on the same hot plate (on different days), suggesting that the poor data quality might also be due to a lower distillation temperature or loss of H2S from the assembly. This finding highlights the importance of good temperature control for the distillation assemblies and for the use of a larger, at least 10 ml, AgNO3trap.
The STRIP distillation of the final filtrate of the series v samples did not yield any sulfur, which in combination with the good match between the total sulfur and sum of all species profiles demonstrates that there is no major
“missing sulfur pool” in the pore-water constituents at station M1 in the Aarhus Bay.
Summary and conclusions
The STRIP distillation method remains a highly useful technique, with many applications. Although there are other options, like MC-ICPMS, for the sulfur isotope analysis of complex matrix samples of very low sulfur content, the STRIP distillation method provides a straightforward, easily accessible technique. In addition, the use of this method to convert 35S-sulfate tracer to 35
S-sulfide tracer has immediate application in the eluci-dation of newly hypothesized and yet to be discovered sulfur intermediate pathways in microbial sulfur cycling. The potential exists to produce isotopically labeled elem-ental sulfur, as H2S is known to oxidize to elemental sulfur in the condensing column in the presence of nitrate [6], either by using the generated radiolabeled H2S or by using a modification of the STRIP distillation method to produce directly elemental sulfur. Stable iso-tope enriched elemental sulfur (34S-elemental S) is com-mercially available, but there is no such supply available for 35S-elemental sulfur. The STRIP distillation is also a powerful tool when applied towards total sulfur or in sequential combination with other extraction techniques where it can be used to complete the sulfur mass balance of a sample or system. Over the decades, many adjust-ments and variations of this method have been employed and the future utility of the STRIP distillation method, especially in the field of sulfur (isotope) biogeochemistry remains strong and promising.
Competing interests
The authors declare that they have no competing interests.
Authors’contributions
GLA carried out most experiments and drafted the manuscript with input from all authors. GLA and BB designed the experiments and interpreted the results. IAM measured the sulfur intermediate species and assisted with Aarhus Bay study sample collection. HR managed the logistics for the Aarhus Bay study, assisted Aarhus Bay study sample collection and contributed the major sulfur species concentration measurements. All authors read and approved the final manuscript.
Acknowledgements
We thank J. Pedersen, K. Bomholt-Henriksen, K. K. Imhoff, and T. Max for analytical work and technical support. We especially thank Captian T. Vang and the RV Tyra of Aarhus University for outstanding support for the Aarhus Bay sampling. GLA especially thanks B. B. Jørgensen and T. Ferdelman for their support to re-develop and publish this updated method in the scope of sulfur isotope biogeochemical applications. This work was supported by Max Planck Society (GLA, BB, and IAM), the Deutsche Forschungsgemeinschaft (through the MARUM Center for Marine Environmental Sciences, IAM), the European Research Council under the European Union’s Seventh Framework Programme (FP7/2007-1013)/
Table 8 Measured vs. calculated sulfur pools for the Aarhus Bay pore-water study
Sample ID
Depth (cm)
Total sulfur (mM)
Sum of species (mM) δ
34 STSmeas
‰ δ
34 STScalc
‰
1 15.0 20.9 19.3 25.5 25.5
2 45.0 16.2 15.1 31.5 30.6
3 75.0 12.5 12.4 34.0 26.2
4 112.3 9.1 8.6 31.6 30.9
5 126.0 6.5 7.4 33.2 28.9
6 141.0 5.6 5.8 28.5 27.1
7 156.0 4.3 4.8 24.6 22.9
8 171.0 3.8 4.0 16.8 15.4
9 185.8 3.4 3.6 15.9 15.9
10 199.5 2.7 2.8 14.6 14.5
ERC grant agreement no. 294200 (GLA) and co-funded by the Danish National Research Foundation (BB, HR).
Author details
1Max Planck Institute for Marine Microbiology, 28359 Bremen, Germany.
2
Center for Geomicrobiology, Department of Bioscience, Aarhus University, 8000 Aarhus, Denmark.3Department of Geological Sciences, University of Texas at El Paso, El Paso, TX, USA.
Received: 30 September 2013 Accepted: 10 April 2014 Published: 22 April 2014
References
1. Holmkvist L, Ferdelman TG, Jørgensen BB:A cryptic sulfur cycle driven by iron in the methane zone of marine sediment (Aarhus Bay, Denmark).
Geochim Cosmochim Acta2011,75:3581–3599.
2. Milucka J, Ferdelman TG, Polerecky L, Franzke D, Wegener G, Schmid M, Lieberwirth I, Wagner M, Widdel F, Kuypers MMM:Zero-valent sulphur is a key intermediate in marine methane oxidation.Nature2012,491:541–546. 3. Pfeffer C, Larsen S, Song J, Dong M, Besenbacher F, Meyer RL,
Kjeldsen KU, Schreiber L, Gorby YA, El-Naggar MY, Leung KM, Schramm A, Risgaard-Petersen N, Nielsen LP:Filamentous bacteria transport electrons over centimetre distances.Nature2012,491:218–221.
4. Lever MA, Rouxel O, Alt JC, Shimizu N, Ono S, Coggon RM, Shanks WC, Lapham L, Elvert M, Prieto-Mollar X, Hinrichs K-U, Inagaki F, Teske A:
Evidence for microbial carbon and sulfur cycling in deeply buried ridge flank basalt.Science2013,339:1305–1308.
5. Luke CL:Determination of total sulfur in rubber.Ind Eng Chem1943,
15:602–604.
6. Pepkowitz L, Shirley E:Microdetection of sulfur.Anal Chem1951,23:1709–1710. 7. Thode H, Monster J, Dunford H:Sulphur isotope geochemistry.
Geochim Cosmochim Acta1961,25:159–174.
8. Forrest J, Newman L:Silver-110 microgram sulfate analysis for the short time resolution of ambient levels of sulfur aerosol.Anal Chem1977,
49:1579–1584.
9. St Lorant I:A new colorimetric microchemical method for determination of sulfur in sulfides, sulfates, etc.Z Physiol Chem1929,185:245–266. 10. Shan X, Chen B:Determination of carbon-bonded sulfur in soils by
hydriodic acid reduction and hydrogen peroxide oxidation.Fresenius J Anal Chem1995,351:762–767.
11. Norwitz G:Spectrophotometric determination of sulfate in propellants and nitrocellulose.Philadelphia, PA: Frankford Arsenal; 1970.
12. Kiba T, Tagaki T, Yoshimura Y, Kisha I:Tin (II)-strong phosphoric acid. A new reagent for the determination of sulfate by reduction to hydrogen sulfide.Bull Chem Soc Jpn1955,28:641–644.
13. Ueda A, Sakai H:Simultaneous determinations of the concentration and isotope ratio of sulfate- and sulfide-sulfur and carbonate carbon in geological samples.Geochem J1983,17:185–196.
14. Coleman ML, Moore MP:Direct reduction of sulfates to sulfur dioxide for isotopic analysis.Anal Chem1978,50:1594–1595.
15. Johnston DT, Farquhar J, Canfield DE:Sulfur isotope insights into microbial sulfate reduction: when microbes meet models.
Geochim Cosmochim Acta2007,71:3929–3947.
16. Kallmeyer J, Ferdelman TG, Weber A, Fossing H, Jørgensen BB:Evaluation of a cold chromium distillation procedure for recovering very small amounts of radiolabeled sulfide related to sulfate reduction measurements.Limnol Oceanogr Methods2004,2:171–180.
17. Gröger J, Franke J, Hamer K, Schulz HD:Quantitative recovery of elemental sulfur and improved selectivity in a chromium‐reducible sulfur distillation.Geostand Geoanalytical Res2010,33:17–27.
18. Alford SE, Alt JC, Shanks WC III:Sulfur geochemistry and microbial sulfate reduction during low-temperature alteration of uplifted lower oceanic crust: insights from ODP Hole 735B.Chem Geol2011,
286:185–195.
19. Fossing H, Jørgensen BB:Measurement of bacterial sulfate reduction in sediments: evaluation of a single-step chromium reduction method.
Biogeochemistry1989,8:205–222.
20. Zerkle AL, Kamyshny A Jr, Kump LR, Farquhar J, Oduro H, Arthur MA:
Sulfur cycling in a stratified euxinic lake with moderately high sulfate: constraints from quadruple S isotopes.Geochim Cosmochim Acta2010,
74:4953–4970.
21. Sim MS, Bosak T, Ono S:Large sulfur isotope fractionation does not require disproportionation.Science2011,333:74–77.
22. Révész K, Coplen TB:Determination of theδ(34S/32S) of low-concentration sulfate in water: RSIL lab code 1949.InBook 10 Methods Rest Stable Isot Lab.; 2007.
23. Turchyn AV, Tipper ET, Galy A, Lo J-K, Bickle MJ:Isotope evidence for secondary sulfide precipitation along the Marsyandi River, Nepal, Himalayas.Earth Planet Sci Lett2013,374:36–46.
24. Kang P-G, Mayer B, Mitchell MJ:Comparison of sample preparation methods for stable isotope analysis of dissolved sulphate in forested watersheds.Isotopes Environ Health Stud2012,
48:410–420.
25. Paris G, Sessions AL, Subhas AV, Adkins JF:MC-ICP-MS measurement of
δ34S andΔ33S in small amounts of dissolved sulfate.Chem Geol2013,
345:50–61.
26. Lin A-J, Yang T, Jiang S-Y:A rapid and high-precision method for sulfur isotopeδ34S determination with a multiple-collector inductively coupled plasma mass spectrometer: matrix effect correction and applications for water samples without chemical purification.Rapid Commun Mass Spectrom2014,28:750–756.
27. Craddock PR, Rouxel OJ, Ball LA, Bach W:Sulfur isotope measurement of sulfate and sulfide by high-resolution MC-ICP-MS.Chem Geol2008,
253:102–113.
28. Cífka J:The reduction of S35-labelled sulphates.Int J Appl Radiat Isot1963,
14:174–176.
29. Wotte T, Shields-Zhou GA, Strauss H:Carbonate-associated sulfate: experimental comparisons of common extraction methods and recommendations toward a standard analytical protocol.Chem Geol 2012,326–327:132–144.
30. Bao HM:Purifying barite for oxygen isotope measurement by dissolution and reprecipitation in a chelating solution.Anal Chem2006,78:304–309. 31. Schulz HD, Zabel M:Marine Geochemistry.Berlin Heilelberg: Springer-Verlag;
2006.
32. Cline J:Spectrophotometric determination of hydrogen sulfide in natural waters.Limnol Oceanogr1969,14:454–458.
33. Zopfi J, Ferdelman TG, Fossing H:Distribution and fate of sulfur intermediates—sulfite, tetrathionate, thiosulfate, and elemental sulfur—in marine sediments.Geol Soc Am Spec Pap2004,379:97–116.
doi:10.1186/1467-4866-15-4
Cite this article as:Arnoldet al.:Modern applications for a total sulfur reduction distillation method - what’s old is new again.Geochemical Transactions201415:4.
Submit your next manuscript to BioMed Central and take full advantage of:
• Convenient online submission
• Thorough peer review
• No space constraints or color figure charges
• Immediate publication on acceptance
• Inclusion in PubMed, CAS, Scopus and Google Scholar
• Research which is freely available for redistribution