DESIGN AND SIMULATION OF
VERTICAL HANDOVER ALGORITHM
FOR VEHICULAR COMMUNICATION
Sourav Dhar, Amitava Ray, Rabindranath Bera
Sikkim Manipal Institute of Technology, Majitar, Sikkim, INDIA- 737136 Email: [email protected]
Abstract:
The primary objective in this work is to design and simulate a novel handover algorithm in heterogeneous radio network for intelligent transportation system (ITS). Analytic hierarchy process (AHP) is used to solve decision problem in multiple constraint environment. The user preferences are taken into consideration in this algorithm. A case study is illustrated to demonstrate the effectiveness of this model. Several network contexts like received signal strength (RSS), initial delay for connection establishment, network traffic load and bandwidth offered, service context like usage cost, user contexts like type of application and terminal context like speed of the vehicle are considered as different attributes of this algorithm. RSS is considered as the triggering factor, i.e, a network will be considered as an alternative only if its RSS is above threshold. The proposed method decides the priority of radio access network that is most suitable for user’s application at a particular vehicular speed in the constraint resource environment. Sensitivity analysis is done to justify the design of the algorithm. This algorithm is specific to vehicular communication system and hence variation in network selection with vehicle speed is presented. The results show that the presented model not only realistically optimizes the best available network on the move but also avoids unnecessary handovers. Simulation work has been carried out in the MATLAB environment.
Key Words: Intelligent Transportation System (ITS), Analytic Hierarchy Process (AHP), Dedicated Short Range Communication (DSRC), Software Defined Radio (SDR), Sensitivity Analysis.
1. Introduction
Intelligent Transportation System (ITS) converges remote sensing and communication technologies to improve safety and to make the journey enjoyable. This is now part of the national strategy, for improving the security, safety, efficiency and comfort, of every nation [1].
Association for Intelligent Transport Systems (AITS), INDIA and Intelligent Transport Systems Center of Excellence (India) are involved to promote the concept of road safety in India.The government of INDIA has shown their interest to take up research, policy recommendations, programs and projects on ITS with AITS.AITS India is an umbrella organization which represents a broad spectrum of members including industry, government, consumer organizations and academia in fostering the development and deployment of ITS in India. Such systems often include components used in electronic commerce, and related applications. AITS India also has strong links internationally with similar organizations including ITS America, ITS Australia and ITS Asia-Pacific.
ITS applications can be broadly classified in two categories: safety applications and non safety application. Adaptive cruise control (ACC), Driver assistance systems (DAS) and Collision avoidance and warning systems (CAWAS) are some examples of safety application. On the other hand, internet access from car, vehicle to vehicle (V2V) and vehicle to infrastructure (V2I) communication [2, 3], satellite television from car, radio taxi, and automatic toll collection are categorized as non-safety applications.
Intelligent Transportation System (ITS) needs an “always best connected (ABC)” communication to ensure vehicular safety. Intelligent Transportation System (ITS) is an application of 4G which is characterized by heterogeneous radio access networks. The heterogeneous co-existence of access technologies with largely different characteristics creates a decision problem for determining best available network at a point of time.
network at “best” time among available networks based on dynamic factors such as “Received signal strength (RSS)” of network and “velocity” of mobile station simultaneously with static factors like usage expenses, link capacity and power consumptions is presented in [7]. Importance of mobile station velocity and movement pattern is considered in [8]. Competitive and cooperative relationships among the major ITS communication technologies, WiMax, WLAN and UMTS, are considered in [9]. An analytic hierarchy process (AHP) based network selection algorithm for UMTS and WLAN is presented in [ 3,10]. Along with WCDMA and WLAN, DVB-H which supports both data and broadcast services correspondingly, is explained in [11]. In [12], the vertical handover decision problem is formulated as a Constrained Markov Decision Process (CMDP). A two step, i.e., a pre-handoff decision algorithm followed by a handoff decision algorithm is presented in [13]. An AHP based comparison of different vertical handoff algorithms is presented in [14]. An AHP based multi-criteria decision making (MCDM) tool is designed for vertical handover among WLAN, UMTS and GPRS and is presented in [15]. Measurements of application perceived throughput in DAB, GPRS, UMTS and WLAN is done for automatic network selection in [16]. A 3-step network selection strategy for new cell arrival in a road condition is shown in [17]. AHP and grey relational analysis (GRA) based network selection mechanism for UMTS and WLAN is presented in [18] for next generation networks. A framework for both horizontal and vertical handover in wireless network based on mobile IPv6 has been proposed in [19]. Handoff triggering and network selection algorithm in CDMA-WLAN integrated networks is proposed and QoS performance against velocity of mobile terminal is discussed in [20]. A load balancing vertical handover algorithm, which will maximize the collective battery lifetime of Mobile Nodes, is proposed in [21].
After a thorough review of the literature, we conclude with the following criticisms:
1) The traditional vertical handover algorithms consider constraint resources, but it does not provide the optimal solution for ABC communication for ITS in the context of multiple constraints.
2) The mathematical formulation of vertical handover is rigorous and need longer execution time.
3) Selection of best network against vehicular speed variations is not shown in the “traditional vertical handover models” except in [3].
4) Sensitivity analysis, in the field of vertical handover, was not done in any of these research papers except [39]. The novelty of our study is to address the challenge of vertical handover in road transportation where vehicle speed is the major influencing factor. For an appropriate vertical handover the decision makers must define the decision hierarchy, define criteria weights, and evaluate radio access technologies against the criteria. Once the priorities for each network alternatives have been determined, they are incorporated in the network optimization process of the methodology where they represent a network priority. The ability to conduct sensitivity analysis is designed into the methodology, providing the decision maker with additional insight regarding the robustness of a model.
In the present work, we propose a model that analyzes the case in which a vehicle is kept at different positions of a highway, and the network ranking optimizes the “best” network in multiple constraint environments. This evaluation technique requires knowledge of vehicular speed, received signal strength (RSS), type of application (bandwidth requirements), network traffic load, usage cost of service and initial delay for connection establishment.
The rest of this paper is organized as follows: problem definition is given in section 2, proposed solution to this problem is presented in section 3, analytic hierarchy process is explained in section 4, algorithm design is presented in section 5, simulation is discussed in section 6, result analysis is done in section 7, and sensitivity analysis is done in section 8. Finally conclusions are drawn in section 9.
2. Problem Definition
Unlike horizontal handoff, Vertical handoff does not only take place in cell edges. There are many other factors that should be considered for a proper vertical handoff.
Triggering factor Received Signal Strength (RSS) (Availability of the network) Critical factor Terminal Mobility (Speed of the vehicle)
Influencing factors Bandwidth (depends on Application type), Initial Delay, Network Traffic Load, Usage cost
Suppose the user is moving from a cell to another as shown in Figure 1. In typical highway traffic, we have considered five different situations. At position A, the vehicle has passed the toll plaza and is about to enter in a city. Thus all three radio networks are available here. Point B is almost similar to point A; here the vehicle is in a sub-urban area. Point-C is far from city and only UMTS network is available here.
Point-D is near to toll plaza, and UMTS along with dedicated short range communication (DSRC) network is available here. Currently, the IEEE standard proposed for DSRC, known as 802.11p, is based upon the IEEE 802.11a standard [37]. The physical Layer of the 802.11p standard is the same as the physical Layer of the 802.11a standard, except for the used sample rate. The main application of 802.11p is vehicle-to-vehicle (V2V) communication. V2V is also a synonym for dedicated short range communication (DSRC) [36]. DSRC is already in use in USA, Europe and Japan for electronic toll collection [23]. Point- E indicates the suburban area where WLAN network is not available and the vehicle is in the edge of the WiMAX coverage area. Handover needs to take place when either RSS is critical or QoS is poor for current radio access network
The applications taken into consideration are Conversational, video streaming and normal file transfer (data streaming) [14]. Each of these applications requires a different bandwidth. All the three technologies do not support these applications with equal QoS. Each wireless technology has a limit on the maximum amount of mobility it can support. As we are considering a transportation system, speed of the vehicle (mobility) is an important factor that is to be taken into consideration. WiMAX supports the highest mobility among the three and WLAN has the lowest support for mobility and the least coverage area [23].
Another parameter taken into consideration is the Initial delay, which is the setup time for a connection. Initial delay is more in some systems compared to others. According to Fiedler et al. [35], delay could be up to seven seconds for UMTS. WLAN connectivity, on the other hand, is perceived as responding instantaneously. WiMAX response could be faster than UMTS but slower than WLAN.
3. Assumptions and Proposed Solution
The following assumptions are made for solving the problem defined in section 2.
i) Situations of point “A” and point “B” of figure 1, where all the three networks are available, are considered for simulation. At point “C” only UMTS is available. At point “D” UMTS and WLAN are available and at
point “E” WiMAX and UMTS are available networks. However, this handover scheme will be valid for any point on the highway.
ii) All the radio access networks will be equally loaded at a given instant. Random network traffic load distribution will be considered in future works.
iii) Two types of applications are considered, viz., conversational/ voice communication and streaming applications (audio, video streaming, internet access, data transfer etc.).
iv) Speed of the vehicle is an objective factor (which can be compared on the basis of measured value) and other influencing factors are subjective factors.
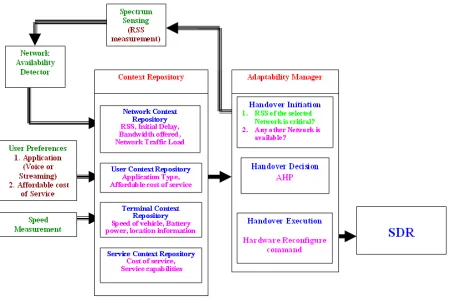
Figure 2: Functional Architecture for Vertical handover
Figure 2 gives our proposed vertical handover functional architecture containing the following given modules. The context repository module basically a database which collects all the contextual information, through monitoring and measurements, required to identify the need for handover and to apply handover decision. These data are monitored periodically and updated accordingly. All these data are supplied to the adaptability manager.
Network context repository: This holds all the network related contexts. Static parameters like offered bandwidth, initial delay for connection establishment and dynamic data like network availability (RSS (Received Signal Strength) and current network traffic load.
Terminal context repository: This holds the up to date speed of the vehicle, battery power, location information, etc.
User context repository: This accepts the inputs from the user. User preferences are basically the type of application (data rate/ bandwidth required) and affordable cost for the service.
Service context repository: This stores mainly the static information like monetary cost of service, service capabilities etc.
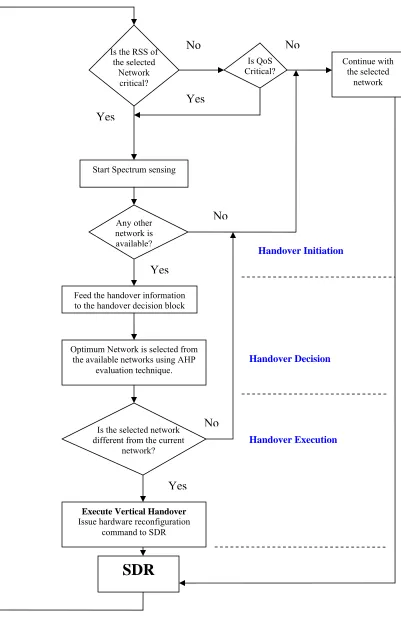
The Adaptability manager module is responsible for providing transparent switching between networks. So, it encloses the main phases of a handover process: handover initiation, Handover decision (i.e., network selection) and Handover execution. Working of the adaptability manager is explained in the flowchart (figure 3).
responsible for this work.) then handover process will be initiated else the wireless device will continue the communication through the current radio access network.
Once the handover process is initiated, the gathered context information in context repository will be supplied to the adaptability manager. The optimum network will be selected based on the AHP evaluation technique.
In handover execution phase, the adaptability manager will first check whether the selected network is different from the current network. If so, then it will issue a vertical handover command and will direct the control unit of SDR to reconfigure the hardware according to the selected network.
4. Analytic Hierarchy Process
The Analytic Hierarchy Process (AHP) is a technique used for dealing with problems which involve the consideration of multiple criteria simultaneously. It is unique in its ability to deal with intangible attributes and to monitor the consistency with which a decision maker makes his decisions
AHP, developed by Saaty [27-32], addresses how to determine the relative importance of a set of activities in a multi-criteria decision problem. The process makes it possible to incorporate judgments on intangible qualitative criteria alongside tangible quantitative criteria. The AHP method is based on three principles:
i) Structure of the model;
ii) Comparative judgment of the alternatives and the criteria; iii) Synthesis of the priorities.
In the literature, AHP has been widely used in solving many complicated decision-making problems [24-34, 38]. The steps of AHP are as follows:
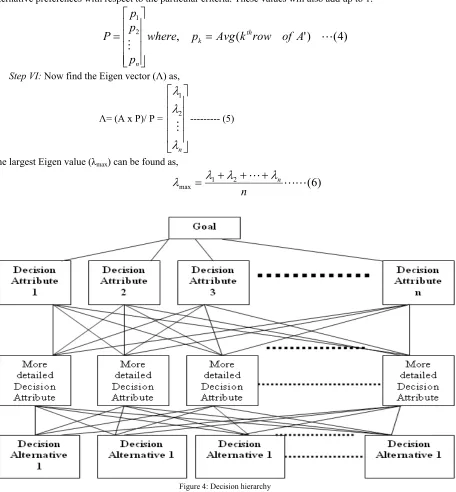
Step-I: A complex decision problem is structured as a hierarchy (Figure 4). AHP initially breaks down a complex multi-criteria decision-making problem into a hierarchy of interrelated decision criteria, decision alternatives. With the AHP, the objectives, criteria and alternatives are arranged in a hierarchical structure similar to a family tree. A hierarchy has at least three levels: overall goal of the problem at the top, multiple criteria that define alternatives in the middle, and decision alternatives at the bottom.
Step-II: The comparison of the alternatives and the criteria. Once the problem has been decomposed and the hierarchy is constructed, prioritization procedure starts in order to determine the relative importance of the criteria within each level. The pairwise judgment starts from the second level and finishes in the lowest level, alternatives. In each level, the criteria are compared pairwise according to their levels of influence and based on the specified criteria in the higher level. In AHP, multiple pairwise comparisons are based on a standardized comparison scale of nine levels (Table 1).
Let C = {Cj |j = 1, 2,...., n} be the set of criteria. The result of the pairwise comparison on ‘n’ criteria can be summarized in an (n x n) evaluation matrix ‘A’ in which every element ‘aij’ (i,j = 1,2,..., n) is the quotient of weights of the criteria, as shown:
Figure 3: Working of the adaptability manager Is the RSS of
the selected Network
critical?
Is QoS
Critical? Continue with the selected network
No
No
Yes
Yes
Start Spectrum sensing
Any other network is available?
No
Yes
Feed the handover information to the handover decision block
Optimum Network is selected from the available networks using AHP
evaluation technique.
Execute Vertical Handover
Issue hardware reconfiguration command to SDR
Handover Initiation
Handover Decision
Handover Execution
Is the selected network different from the current
network?
No
SDR
Step III: Objective factors and the subjective factors are to be identified. Objective factors are those which could be measured directly. Thus pair wise comparison can be achieved directly taking the ratio of ith factor measured value (scaled between 1 to 9) to jth factor measured value (scaled between 1 to 9). Thus equation (1) could be re-written for objective factors as follows:
)
2
(
/
/
/
/
/
/
/
/
/
/
/
2 1 3 3 2 3 2 2 2 1 2 1 2 1 1 1
n n n n n nm
m
m
m
m
m
m
m
m
m
m
m
m
m
m
m
m
m
m
m
m
m
A
Where mk= Measured value (scaled between 1 to 9) of the objective factor for kthalternative. It is observed that for the matrix given above the following relation holds [50]:
Aw = nw
Where, w is the priority vector and n is the number of elements being compared. This is the case for a perfectly consistent comparison matrix whose elements satisfy
aij= aikaij for all ( i , j ,k)
Subjective factors are those which can be quantified from human knowledge. Since the comparisons are made subjectively based on human knowledge, the consistency of judgment needs to be verified through evaluating the consistency ratio (CR).
Table 1: The Nine -Point Scale Of Pair-Wise Comparison [27]
Weights Verbal Scale Explanation
1 Equal Importance of both elements. Two elements contribute equally. 3 Moderate importance of one element over
another.
Experience and judgment favor one element over another. 5 Strong importance of one element over another. An element is strongly favored. 7 Very strong importance of one element over
another. An element is strongly dominant. 9 Extreme importance of one element over
another. An element is favored by at least an order of magnitude.
2,4,6,8 Intermediate values Used to compromise between two
judgments. Reciprocals Reflecting dominance of second alternative compared with the first.
Step-IV: Develop a normalized matrix (A’) by dividing each element in a column of the pair-wise comparison matrix A by its column sum. The sum of every column of a correctly normalized matrix will always be 1.
Step-V: Average each row of the normalized matrix. These row averages form the priority vector (P) of alternative preferences with respect to the particular criteria. These values will also add up to 1.
)
4
(
)
'
(
,
2 1
where
p
Avg
k
row
of
A
p
p
p
P
thk
n
Step VI: Now find the Eigen vector (Λ) as,
Λ= (A x P)/ P =
n
2 1
--- (5)
The largest Eigen value (λmax) can be found as,
)
6
(
21
max
n
n
Figure 4: Decision hierarchy
Step-VII: To determine whether or not a level of consistency is reasonable, we need to develop a quantifiable value for the comparison matrix. If w is the column vector of the relative weight wi(i = 1, 2, 3 . . .n), comparison matrix A is consistent if Aw = nw.
Step-VIII: Using AHP, compute the consistency ratio as
CR = CI/RI
where
CI =consistency index of comparison matrix = (λmax− n)/ (n − 1) and
Table 2: Random inconsistency for different set of alternatives Number of
alternatives (n)
Random inconsistency
(RI)
3 0.58 4 0.90 5 1.12 6 1.24 7 1.32 8 1.41
Step-IX: AHP does tolerate some inconsistency and according to Saaty [26-31], if the consistency ratio is
<10%, then the level of inconsistency is acceptable. Otherwise, the inconsistency of “A” is high, and the elements of the decision matrix must be revised.
Step-X: The final ranking of the alternatives are determined by multiplying the priority vector of the criteria (found from first level AHP matrix) by the priorities (found from each second level AHP matrix) for each decision alternative for each objective.
5. Design
Figure 5: Hierarchy of criteria for “best network” selection.
Figure 5 presents a hierarchy of criteria with the goal of “best network” selection for seamless vehicular communication. To be able to reach this goal four criteria have been defined: usage cost, speed of the vehicle (mobility), type of application (bandwidth), network traffic load and initial delay to setup the communication link. Received signal strength (RSS) will act as a triggering factor, i.e., a network will be considered as an alternative if and only if the RSS of network is above threshold at that instant.
As mentioned in section 3, we have considered two main categories of communication traffic, i.e., conversational and streaming (data and video).
with vehicular communication hence initial delay for connection establishment is expected to be less. If QoS is equivalent for two networks then user will always opt for a network which offers low cost of service. Thus usage cost is another influencing factor for vertical handover. The priority vector gives a quantitative representation of relative importance of these influencing factors.
Table 3: First level AHP Matrix for deciding relative priority of influencing factors Mobility
(Speed)
Bandwidth Network Traffic
Load
Initial Delay
Usage Cost
Priority Vector
Mobility (speed)
1 3 5 3 7 0.4529
CI=
0.0777467 CR=CI/RI = 0.0694
Bandwidth 1/3 1 5 3 5 0.2765
Network Traffic
Load
1/5 1/5 1 1/3 3 0.0742
Initial Delay
1/3 1/3 3 1 5 0.1553 RI= 1.12
for n =5 Usage
Cost
1/7 1/5 1/3 1/5 1 0.0407
The second level AHP matrix for deciding priority of each network based on the subjective factors, i.e., bandwidth, network traffic load, delay and usage cost are shown in table 4, table 5, table 6 and in table 7 respectively. The priority vector, consistency index (CI) and consistency ratio (CR) are obtained by following the steps described in section 4.
Table 4: Second level AHP Matrix for deciding relative priority of networks for bandwidth only
Bandwidth WiMAX UMTS WLAN Priority
Vector CI= 2.22 x 10⁻¹⁶ CR=CI/RI = 3.82x 10⁻¹⁶
WiMAX 1 7 1 0.4666
UMTS 1/7 1 1/7 0.0666 RI = 0.58
For n = 3
WLAN 1 1 1 0.4666
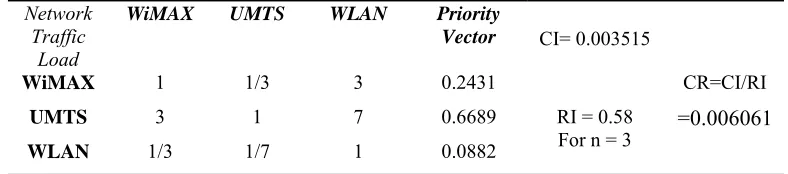
Table 5: Second level AHP Matrix for deciding relative priority of networks for traffic load only
Network Traffic
Load
WiMAX UMTS WLAN Priority
Vector CI= 0.003515
CR=CI/RI =0.006061
WiMAX 1 1/3 3 0.2431
UMTS 3 1 7 0.6689 RI = 0.58
For n = 3
WLAN 1/3 1/7 1 0.0882
Table 6: Second level AHP Matrix for deciding relative priority of networks for delay only
Initial
Delay WiMAX UMTS WLAN Priority Vector CI = 0.003515 CR=CI/RI
= 0.006061
WiMAX 1 3 1/3 0.2431
UMTS 1/3 1 1/7 0.0882 RI = 0.58
For n = 3
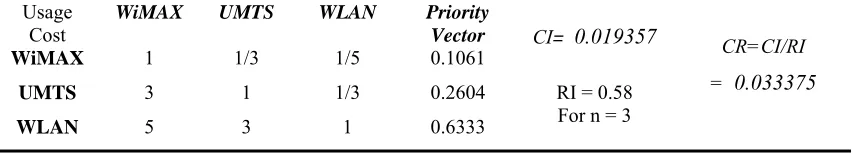
Table 7: Second level AHP Matrix for deciding relative priority of networks for usage cost only Usage
Cost WiMAX UMTS WLAN Priority Vector CI= 0.019357 CR=CI/RI
= 0.033375
WiMAX 1 1/3 1/5 0.1061
UMTS 3 1 1/3 0.2604 RI = 0.58
For n = 3
WLAN 5 3 1 0.6333
Speed is considered as the objective factor. Thus for AHP matrix formation it is necessary to convert the speed of the vehicle to a 9-point scale. As we know WLAN can support mobility up to 30-35kmph, UMTS can support mobility up to 90-100 kmph and WiMAX supports mobility up to 150 kmph [23], thus the 9-point conversion of speed for each network can be done as shown in equation (7).
130
/
)
8
(
9
)
7
(
90
/
)
8
(
9
30
/
)
8
(
9
speed
m
speed
m
speed
m
WiMAX UMTS WLAN
Hence we can now form the second level AHP matrix for deciding priority of each network on the basis of the objective factor speed as shown bellow:
)
8
(
1
1
1
UMTS WLAN WiMAX WLAN WLAN UMTS WiMAX UMTS WLAN WiMAX UMTS WiMAXm
m
m
m
m
m
m
m
m
m
m
m
A
This is a perfectly consistent AHP matrix with CI=0 as discussed in section 4. It is evident from equation (7) that if speed is more than 30kmph then WLAN will be considered as not available and if vehicle speed is more than 90kmph then both WLAN and UMTS will be considered as not available. Thus network priority will depend only on the subjective factors.
6. Simulation
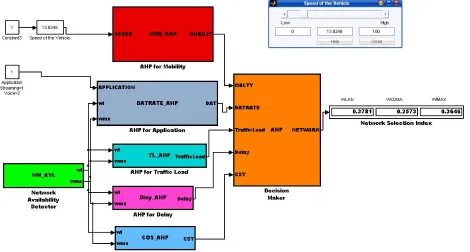
Figure 6 shows the SIMULINK model developed for network selection in vehicular communication Here AHP for individual criteria are calculated and given as input to the decision maker block. Network availability detector block senses the spectrum and decides how many networks are available. As per the problem definition (section 2) it is considered that UMTS is always available. Thus the network availability detector decides whether WLAN and WiMAX are available or not based on the received signal strength (RSS). Result of this block triggers the other blocks. If a network is not available then it will not be considered as an alternative.
Table 8: Network availability at different positions of highway Available= 1, Not-available =0
Vehicle Position WLAN UMTS WiMAX
A 1 1 1
B 1 1 1
C 0 1 0
D 1 1 0
Speed of the vehicle can be altered using a slider and the final ranking will be displayed on the display unit. As mentioned earlier that here two types of applications are considered, viz., conversational and streaming. For conversational application, data rate/ bandwidth does not have much importance but for streaming applications data rate plays a key role. Other AHP matrices are calculated as per the design of section 5. Finally the decision maker takes a decision following the steps of section 4. . A display shows the final ranking of the networks. Network with highest ranking is the selected network. Availability of radio access networks at different positions of figure 1 are listed in table 8.
Figure 6: SIMULINK model for AHP based vertical handoff simulation.
7. Results and Analysis
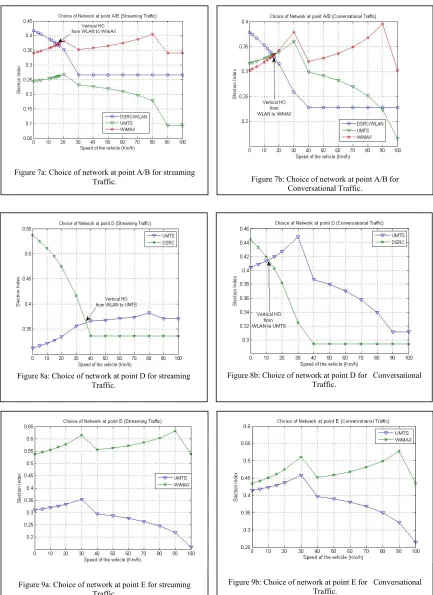
As mentioned in section 3, the real time communication applications can be broadly classified in two categories, i.e., conversational traffic and streaming traffic. The streaming traffic includes data, web browsing, video and audio streaming applications. The simulation results shown here are analyzed for both categories of traffic. The selection of the radio network differs depending on applications. In our design we have considered the availability of the network depends on the received signal strength. If RSS is below the threshold, the network is unavailable (table 8).
Figure 7a and 7b shows the network selection at point-A/B of Figure 1 for streaming and conversational traffic respectively. The network with highest selection index is the selected network. The selection index is found from the simulation according to the AHP design technique. We observe that there is a competition among all three networks till 30kmph vehicular speed. Beyond 30kmph WLAN (or DSRC) can not support the mobility hence it is out of competition even if RSS is above threshold at these positions. Further we also observe that for both the traffic categories WLAN is the chosen radio access network at lower vehicular speed (up to 15kmph apx.). Higher data rate support is required for streaming traffic and we can see that the data rate drastically drops with vehicular speed for WLAN. UMTS is in the competition for voice communication but due to its limited data rate/ bandwidth it is out of competition for streaming traffic.
Figure 9a: Choice of network at point E for streaming Traffic.
Figure 9b: Choice of network at point E for Conversational Traffic.
Figure 8a: Choice of network at point D for streaming Traffic.
Figure 8b: Choice of network at point D for Conversational Traffic.
Figure 7a: Choice of network at point A/B for streaming
8. Sensitivity Analysis
A mathematical model is presented to justify the results of section 7. This model combines contribution margin components with the importance weightings found from the simulation at different speeds.
SI
k=
α
×
SFW
k+ (1
−
α
)
×
OFW
j---
(9) [25]
where,
1
1
]
)
1
(
[
nj j
j j
OFS
OFS
OFW
---(10) [25]
OFS is the objective factor speed. OFW is the objective factor weight.
SFW is the subjective factor weight for different radio access networks. SI is the sensitivity index.
α is the objective factor decision weight, 0≤ α ≤ 1.
n is the number of objective factor considered. k= WLAN, UMTS or WiMAX
Delay, usage cost, network traffic load and bandwidth are considered as subjective factor whereas speed of the vehicle is considered as objective factor. The SFW values, i.e., the global priorities for each network, are found by multiplying each of the decision matrix weights by each of the weight values of the candidate network for each factor. The network is then summed for each alternative. The SFW values are the ordinal measures found using AHP. OFS are designed in such a fashion, as shown in (10), as to obtain a non-dimensional quantity of contribution margin of each network. This has helped to combine contribution components, i.e., cardinal measures, with the SFW values, i.e., ordinal measures, in (9). The SFW values used in (9) are the overall scores found from simulation at different position of the road at different speed. The units of OFS are in kmph, whereas the OFW values are non-dimensional. The choice of α is an important issue. The value of α depends on the decision-maker’s preference regarding the importance of objective and subjective factor measures. Thus, a sensitivity plot to analyze the effect of
α in the network selection problem is strongly recommended. Using equation (9) and (10) the network selection problem is analyzed for both conversational and streaming traffic classes at different speed. Since all the three networks are available at ‘point-A’ and at ‘point-B’, hence these two positions are considered for sensitivity analysis.
Figure 10a: Sensitivity analysis at Point-A/B Speed= 18kmph,
Traffic class= Conversational
Figure 10b: Sensitivity analysis at Point-A/B Speed= 16.3kmph,
Sensitivity index of different networks are found for two different speeds at point-A/B both for conversational and streaming traffic classes. Thus, OFS1= 16.3kmph (streaming) and OFS1= 18kmph (conversational), OFS2= 25kmph, OFS3= 30kmph, OFS4= 60kmph. OFS1 is chosen as 16.3kmph because at that speed there is a vertical hand over from WLAN to WiMAX for streaming traffic class. Similarly for conversational traffic there is a hand over at 18kmph. All the three networks are competing with each other for conversational traffic but finally WiMAX wins the race. Variations in sensitivity index with ‘α’ are shown in figure 10 and figure 11. Break-even point is defined as that value of α after which there is only one choice of network exists. Break-even point at α=0 signifies that there is a clear winner, i.e., a network is already selected. From figure 10a and figure 10b it is found that the break-even point is at α=0.3 and α=0.4 respectively. This represents a vertical handover situation. Thus at point A/B, for streaming traffic class a vertical handover takes place from WLAN to WiMAX at 16.3kmph vehicular speed and for conversational traffic class a vertical handover takes place at 18kmph vehicular speed. This justifies the results shown in figure 7.
9. Discussion and Conclusions
Many vertical handover algorithms are proposed in literature. An efficient assessment system is essential for appropriate network selection. The QoS based algorithm had shortcomings in handling multiple constraint resources as it is mainly based on the perceptions of the designer. It could not reach an optimum solution in all cases. Due to the inefficiency of the QoS based algorithm, a revised algorithm based on AHP was developed. The network selection with variation in speed is not shown in any of the literature. Further the sensitivity analysis for these algorithms is not done before. It is evident from the break-even analysis (section 8) that at break-even points, sensitivity index of two networks becomes identical. At that juncture, we can select either of the networks, and our proposition is “present network will be selected”.
The proposed methodology described here has been analyzed, and it indicates several advantages: 1) It is well suited for network selection in intelligent transportation systems (ITS).
2) It eliminates rigorous mathematical expressions. 3) It is simple and straightforward.
4) It generates the optimum solution in all the cases.
5) It minimizes the time for calculation and hence the processing time. 6) Application specific nature of the algorithm ensures the QoS.
7) This avoids unnecessary handovers and hence encounters “ping-pong effect”.
We have considered these radio access networks (WLAN, UMTS, WiMAX) as the CALM (continuous air interface for long and medium range), which is the international standard (ISO 21217) for ITS, supports all of them. Analytic Hierarchy Process (AHP) is used to find out the priority of the criteria and the consistency of the decision is checked using the Consistency Ratio (CR). By using embedded MATLAB we program a method by which the device selects an optimum network resulting in vertical handoff based on multiple criteria. Since we are only simulating the program, we have taken the values of the above parameters from the user and the calculations are done accordingly. We have taken a sleep time of 20 seconds before again repeating the program in case the vehicle
Figure 11a: Sensitivity analysis at Point-A/B Speed= 60kmph,
Traffic class= Conversational
Figure 11b: Sensitivity analysis at Point-A/B Speed= 60kmph,
moves from one cell to another in that time. This program is to be ported in SDR to develop a reconfigurable hardware in future and hence SIMULINK is chosen as the platform for development.
References
[1] Huang, X; (2006): ”Smart Antennas for Intelligent Transportation Systems”, 6th International Conference on ITS Telecommunications Proceedings, 2006.
[2] Gozalvez, J.; Sepulcre, M, (2007): “Opportunistic-Driven Adaptive Radio Resource Management Technique for Efficient Wireless Vehicular Communications ”, Vehicular Technology Conference, 2007. VTC-2007 Fall. 2007 IEEE 66th Volume , Issue , Sept. 30 2007-Oct. 3 2007
Page(s):2116 – 2120
[3] Dhar, Sourav; Ray, A; Bera, R; Sur, S.N; Ghosh, D; (2010): “A Complete Simulation Of Intra Vehicle Link Through Best PossibleWireless Network”, International Journal of Computer and Electrical Engineering, Vol. 2, No. 4, August, 2010, pages (673-681)
[4] Sun,J; (2007): “ A review of Vertical Handoff Algorithms for Cross Domain Mobility”, International Conference on Wireless Communications, Networking and Mobile Computing, 21-25Sept.2007, Shanghai.
[5] Feng, Z; Le, V; Zhang, P; (2008): “ A Seamless Vertical Handover Scheme for End-to-End Reconfigurability Systems”, IEEE Vehicular Technology Conference, 11-14 May, 2008, Singapore.
[6] Dongyeon, L; Han, Y; Hwang, J; (2006): “ QoS Based Vertical Handoff Decision Algorithm in Heterogeneous Systems”, IEEE 17th International Symposium on Personal, Indoor and Mobile Radio Communications,11-14Sept.2006,page:1-5, Helsinki.
[7] Goyal, P; Saxena, S.K; (2009): “ A Dynamic Decision Model for Vertical Handoff across Heterogeneous Wireless Networks”, International Journal of Computer Systems Science and Engineering, 5:3 2009.
[8] Lee, W; Kim, E; Kim, J; Lee, I; Lee, C; (2007): “ Movement Aware Vertical Handoff of WLAN and Mobile WiMax for seamless Ubiquitous Access”, IEEE Transactions on Consumer Electronics, Vol. 53, no. 4, November 2007.
[9] Ma, L; Jia, D; (2005): “ The Competition and Cooperation of WiMax, WLAN and 3G”, 2nd International Conference on Mobile Technology, Applications and Systems, 15-17Nov.2005,page:1-5, Guangzhou.
[10] Song, Q; Jamilipour, A; (2005): “ Network Selection in an Integrated Wireless LAN and UMTS Environment Using Mathematical Modeling and Computing Techniques ”, IEEE Wireless Communications, June 2005.
[11] Hoon Seo, S; Lee, S.C; Song, J. S; (2007): “Policy Based Intelligent Vertical Handover Algorithmin Heterogeneous Wireless Networks”, International Conference on Convergence Information Technology, 2007, IEEE Computer Society Washington, DC, USA
[12] Sun, C; Navaro, E.S; Wong, V.W.S; (2008): “ A Constrained MDP Based Vertical Handoff Decision Algorithm for 4G Wireless Networks”, IEEE International Conference on Communications, 19-23 May 2008, page: 2169-2174, Beijing.
[13] Hwang, J. Y; Oh, J; Han, Y; (2007): “ A Two Step Vertical Handoff Algorithm in Heterogeneous Traffic and Systems ” IEEE 66th Vehicular Technology Conference,2007. Publication Date: Sept. 30 -Oct. 3 2007, page: 1543-1547.
[14] Navarro,E.S; Wong, V.W.S; (2006): “ Comparison between vertical handoff decision algorithms for heterogeneous wireless networks”, IEEE 63rd Vehicular Technology Conference , Melbourne, 2006.
[15] Isakson; Lennart; Fiedler; Markus; (2007): “ Seamless connectivity in WLAN and cellular networks with multi-criteria decision making ”, IEEE 3rd Euro-NGI conference on next generation internet networks (NGI 2007), Trondheim, Norway, 21-23 May 2007.
[16] Chevul, S; Karlssonz,J; Isakssony, L; Fiedlery,M; Lindbergz, P; Strand´en,L; (2005): “Measurments of Application-Perceived Throughput in DAB, GPRS, UMTS and WLAN environments”, Radio Vetenskap och Kommunikation (RVV- 05), Linkoping, 2005.
[17] Nitiwong, K; Komolkiti,P; Aswakul, C; (2009): “ Performance Evaluation Model of Heterogeneous Wireless Network Selection Strategy with Macroscopic User Mobility Model”, NTC International Conference, Bangkok, 5-6 May, 2009.
[18] Song, Q; Jamalipour, A; (2005) “ A Network Selection Mechanism for Next Generation Networks ”, IEEE International Conference on Communication, Sydney 2005.
[19] Wei Lee, C; Chen, L.M; Chen, M.C; Sun,Y.S; (2005): “A Framework of Handoffs in Wireless Overlay Networks Based on Mobile IPv6”, IEEE Journal on Selected Areas in Communications, vol. 23, no. 11, November 2005.
[22] ARSLAN, H; (2007): “Cognitive radio, software defined radio and adaptive wireless systems”, Springer 2007.
[23]Bera, R; Dhar, Sourav; Kandar,, D; Sinha,N.B; Mitra.,M; (2008): " Modeling and Implementation Of Wireless Embedded System For Intelligent Transport System Application ", accepted in 2008 IEEE Region 10 Colloquium and the Third International Conference on Industrial and Information Systems, Kharagpur, INDIA December 8 -10, 2008.
[24] Ray,A; Sarkar, B; Sanyal,S; (2008): “Outsourcing decision under utopian environment,” J. Appl. Accounting Res., vol. 9, no. 3, pp. 181– 191, 2008.
[25] Ray, A.; Sarkar, B.; Sanyal, S., (2009): “The TOC-Based Algorithm for Solving Multiple Constraint Resources”, IEEE Transactions on
Engineering Management, Volume PP, Issue 99, 0 Page(s):1 – 9, 2009 [26] Taha,H.A; (2006): Operation Research, 7th ed. New Delhi: PHI, 2006.
[27] Saaty, T.L; (1980): “The Analytical Hierarchy Process”. New York: McGraw-Hill, 1980.
[28] Saaty, T.L; (1986): “Exploring optimization through hierarchies and ratio scales,” Socio-Econ. Planning Sci., vol. 20, no. 6, pp. 355–360, 1986.
[29] Saaty, T.L; (1987): “The analytical hierarchy process—what it is and how it is used,” Math. Modeling, vol. 9, pp. 161–176, 1987.
[30] Saaty, T.L; (1988): “The Analytic Hierarchy Process: Planning, Priority Setting, Resource Allocation”. Pittsburgh, PA: RWS Publications, 1988.
[31] Saaty, T.L; (1990): “How to make a decision: The analytic hierarchy process,” Eur. J. Oper. Res., vol. 48, pp. 9–26, 1990. [32] Saaty, T.L; (1994): “How to make a decision: The analytic hierarchy process,” Interfaces, vol. 24, no. 6, pp. 19–43, 1994.
[33] Vasant,P; Natarajan,R; Yacoob,S; (2005): “Fuzzy linear programming with vague objective coefficients in an uncertain environment,” J. Oper. Res. Soc., vol. 56, no. 5, pp. 597–603, 2005.
[34] Patrovi, F.Y; (1994): “Determining what to benchmark: An analytic hierarchy process approach,” Int. J. Oper. Project Manag., vol. 14, no. 6, pp. 25–39,1994.
[35] Fiedler et al. (2005): “ Measurements and analysis of application-perceived throughput via mobile links ”, 3rd Performance Modeling and
Evaluation of Heterogeneous Networks, page T06, IIkley, West Yorkshire, U.K., 2005
[36] “WLAN 802.11p Measurements for Vehicle to Vehicle (V2V) DSRC , Application Note, 2010”, http://www2.rohde-schwarz.com/file_12631/1MA152_2e.pdf
[37] Tan, I.; Wanbin Tang; Laberteaux, K.; Bahai, A (2008): “Measurement and Analysis of Wireless Channel Impairments in DSRC Vehicular Communications”, Communications, 2008. ICC apos;08. IEEE International Conference on Volume , Issue , 19-23 May 2008 Page(s):4882 – 4888
[38] Douligeris, C; Pereira, I; (1992): “AN ANALYTICAL HIERARCHY PROCESS APPROACH TO THE ANALYSIS OF QUALITY IN TELECOMMUNICATION SYSTEMS”, IEEE Global Telecommunications Conference, 1992. Conference Record., GLOBECOM '92. Communication for Global Users., Orlando, FL , USA
![Figure 1: A Typical Radio Network Availability Scenario for ITS [39]](https://thumb-us.123doks.com/thumbv2/123dok_us/9616813.1489898/3.612.90.488.186.406/figure-typical-radio-network-availability-scenario.webp)
![Table 1: The Nine -Point Scale Of Pair-Wise Comparison [27]](https://thumb-us.123doks.com/thumbv2/123dok_us/9616813.1489898/7.612.177.438.554.703/table-point-scale-pair-wise-comparison.webp)