Open Access
Research article
Comparison of air displacement plethysmography to hydrostatic
weighing for estimating total body density in children
Geo Claros
1, Holly R Hull
1and David A Fields*
2,3Address: 1Department of Health and Exercise Science, University of Oklahoma, Norman, OK, USA, 2Department of Pediatrics, University of Oklahoma Health Science Center, Oklahoma City, OK, USA and 3Children's Medical Research Institute's Metabolic Research Center, University of Oklahoma Health Science Center, OUCP Diabetes and Endocrinology, Oklahoma City, OK, USA
Email: Geo Claros - [email protected]; Holly R Hull - [email protected]; David A Fields* - [email protected] * Corresponding author
Background: The purpose of this study was to examine the accuracy of total body density and percent body fat (% fat) using air displacement plethysmography (ADP) and hydrostatic weighing (HW) in children.
Methods: Sixty-six male and female subjects (40 males: 12.4 ± 1.3 yrs, 47.4 ± 14.8 kg, 155.4 ± 11.9 cm, 19.3 ± 4.1 kg/m2; 26 females: 12.0 ± 1.9 yrs, 41.4 ± 7.7 kg, 152.1 ± 8.9 cm, 17.7 ± 1.7 kg/m2) were tested
using ADP and HW with ADP always preceding HW. Accuracy, precision, and bias were examined in ADP with HW serving as the criterion method. Lohman's equations that are child specific for age and gender were used to convert body density to % fat. Regression analysis determined the accuracy of ADP and potential bias between ADP and HW using Bland-Altman analysis.
Results: For the entire group (Y = 0.835x + 0.171, R2 = 0.84, SEE = 0.007 g/cm3) and for the males (Y =
0.837x + 0.174, R2 = 0.90, SEE = 0.006 g/cm3) the regression between total body density by HW and by
ADP significantly deviated from the line of identity. However in females, the regression between total body density by HW and ADP did not significantly deviate from the line of identity (Y = 0.750x + 0.258, R2 =
0.55, SEE = 0.008 g/cm3). The regression between % fat by HW and ADP for the group (Y = 0.84x + 3.81,
R2 = 0.83, SEE = 3.35 % fat) and for the males (Y = 0.84x + 3.25, R2 = 0.90, SEE = 3.00 % fat) significantly
deviated from the line of identity. However, in females the regression between % fat by HW and ADP did not significantly deviate from the line of identity (Y = 0.81x + 5.17, R2 = 0.56, SEE = 3.80 % fat).
Bland-Altman analysis revealed no bias between HW total body density and ADP total body density for the entire group (R = 0.-22; P = 0.08) or for females (R = 0.02; P = 0.92), however bias existed in males (R = -0.37;
P ≤ 0.05). Bland-Altman analysis revealed no bias between HW and ADP % fat for the entire group (R = 0.21; P = 0.10) or in females (R = 0.10; P = 0.57), however bias was indicated for males by a significant correlation (R = 0.36; P ≤ 0.05), with ADP underestimating % fat at lower fat values and overestimating at the higher % fat values.
Conclusion: A significant difference in total body density and % fat was observed between ADP and HW in children 10–15 years old with a potential gender difference being detected. Upon further investigation it was revealed that the study was inadequately powered, thus we recommend that larger studies that are appropriately powered be conducted to better understand this potential gender difference.
Published: 09 September 2005
BMC Pediatrics 2005, 5:37 doi:10.1186/1471-2431-5-37
Received: 18 April 2005 Accepted: 09 September 2005
This article is available from: http://www.biomedcentral.com/1471-2431/5/37
© 2005 Claros et al; licensee BioMed Central Ltd.
Background
Recent results obtained from the National Health and Nutrition Examination Survey (NHANES) found increases in overweight and obesity not only in adults but also in children [1]. An alarming 31% of children aged 6 to 19 years old were found to be at risk for overweight while 16% were classified as overweight. At this time, there is no indication of this trend abating but in fact only growing worse. These facts stress the importance of accu-rate methods to determine body composition in a pediat-ric population to identify children at risk of becoming obese or those who are already obese.
Several methods can be used to determine body composi-tion in a pediatric populacomposi-tion, however these techniques can be costly, time consuming and difficult to administer in a pediatric population. Hydrostatic weighing (HW) has commonly been used in adults, though the administra-tion in certain populaadministra-tions such as the elderly, ill, chil-dren, and certain ethnic groups has proven challenging. For successful completion of HW, multiple trials of com-plete head submersion followed by a maximal exhalation to record underwater weight is the likely culprit for this difficulty. In our study alone 9 children were unable to achieve the requirements necessary to complete a HW test.
Air displacement plethysmography (ADP) is a method that offers promise to alleviate problems associated with HW and is widely used to assess body composition of adults in many different settings. An ADP test involves the child sitting inside of the testing chamber while wearing a swimsuit, swim cap and nose clips for assessment of body volume with each body volume measurement lasting only 50 seconds [2]. After two successful body volume meas-urements, thoracic lung volume is measured using a tube placed inside of the testing chamber and using the gentle puffing maneuver. Total time to assess body composition
by ADP in children is approximately 8–10 minutes com-pared to upwards of 30 minutes or more for HW.
Several studies have investigated the validity and feasibil-ity of ADP in an adult population and found ADP to be valid and reliable [3-9], while others have not found agreement [10]. Although numerous studies have been completed in an adult population, a limited number of studies exist in evaluating ADP in a pediatric population [6,9,11-15] with two studies measuring the residual lung volume simultaneously [13,14].
Therefore, the purpose of this study was to evaluate body density obtained by ADP to body density obtained by HW in children and adolescents and to examine if gender dif-ferences exist between ADP and HW estimates in body density and % fat.
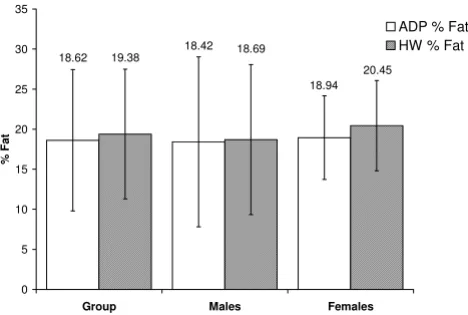
The bars represent % fat measurements by ADP and HW for the entire group and for males and females
Figure 1
The bars represent % fat measurements by ADP and HW for the entire group and for males and females.
18.94 18.42
18.62
20.45 18.69
19.38
0 5 10 15 20 25 30 35
Group Males Females
%F
at
ADP % Fat HW % Fat
Table 1: Physical Characteristics of subjects
Group (N = 66) Males (N = 40) Females (N = 26)
Age, (yr) 12.2 ± 1.6 12.4 ± 1.3 12.0 ± 1.9
Body weight, (kg) 45.0 ± 12.8 47.4 ± 14.8 41.4 ± 7.7 Height, (in) 60.7 ± 4.3 61.2 ± 4.7 59.9 ± 3.5 BMI (kg/m2) 18.7 ± 3.4 19.3 ± 4.1 17.7 ± 1.7
ADP body density (g/cm3) 1.048 ± 0.019 1.050 ± 0.023 1.045 ± 0.011
HW body density (g/cm3) 1.046 ± 0.017 1.049 ± 0.020 1.042 ± 0.011
ADP % fat 18.6 ± 8.8 18.4 ± 10.6 18.9 ± 5.2
Methods
Subjects
A total of 77 subjects were recruited through the Norman Youth Soccer Association. Norman, Oklahoma. Two sub-jects' data were invalid due to instrument malfunction while an additional 9 subjects were unable to perform the HW procedures. Therefore, data from only 66 subjects were used in the analysis, of which 40 were males and 26 females between the ages of 10 – 15 years old. Subjects were excluded from participation in the study if they were claustrophobic or had any known lung disease or disor-der, including asthma.
Protocol
Subjects were required to visit the Human Body Compo-sition Laboratory at the University of Oklahoma Norman Campus for one visit with the visit lasting approximately 1 1/2 hours. ADP always preceded HW, this was done to ameliorate any residual effect that heat and moisture may have on ADP measurements [16]. Written informed con-sent and ascon-sent were obtained from all subjects and their parents. This research study was approved by the Univer-sity of Oklahoma Institutional Review Board.
BOD POD instrumentation
The BOD POD® Body Composition System (Life
Measure-ment InstruMeasure-ments, Concord, CA) was used to assess body volume and total body density with the operating proce-dures previously described elsewhere [2]. Total body den-sity was converted to percent fat using the Lohman age specific equations [17]. Subjects were instructed not to eat, drink or exercise 6 hours prior to testing. All subjects wore a Speedo swimsuit (provided by the laboratory), swim cap, nose clips, and removed all jewelry prior to test-ing. The traditional and well established pulmonary plethysmographic measurement (used inbasic pulmonary function testing) of thoracic gas volume (TGV) is adopted by the BOD POD and incorporated into the testingfor TGV measurement and has been shown to be valid [2,18]. The only difference is that the traditional pulmonary plethysmography determines TGV at the end-tidal exhala-tion; however, the BOD PDO measures TGV at mid-tidal exhalation. This is done because it is necessary to correct raw body volume for the average amount of airin thelungs during normal tidal breathing, which is reflected by taking the measurement at mid-tidal exhalation. The testing pro-cedure involved the following steps. First, the BOD POD was calibrated by computing the ratio of the pressure amplitudes (reference chamber and testing chamber) for the empty testing chamber, which is ~ 450L, and the test-ing chamber with our calibration cylinder (49.556-L). Fol-lowing the calibration and after the TGV procedure was explained and all pertinent subject data entered into the computer software, the subject entered the testing cham-ber to have there raw body volume measured. After body
volume was measured, the TGV was measured. The TGV was measured by having the subject sit quietly in the BOD POD while breathing through a disposable tube and filter connected to the reference chamber in the rear of the BOD POD. After four or five normal breaths and at the point of mid-exhalation the airway was occluded and the subject was instructed to make two quick and light puffs. All TGV measurements were measured and not estimated.
Hydrostatic weighing
Each child's total body density was measured by underwa-ter weighing, with a simultaneous measurement of resid-ual lung volume by using the closed-circuit oxygen dilution technique measurement system (EXERTECH, Dresbach, MN). The simultaneous residual lung volume measurement system included a calibrated piston pump which was used to dispense a measured volume of oxygen into a rubber bag and a fast responding electronic nitro-gen gas analyzer. This continuously sampled the inhaled and exhaled gas at the subject's mouth in order to follow the nitrogen fraction of the respiratory air as it mixed with the pre-measured oxygen bag volume during re-breathing (i.e. when the subjects emerged from being submerged under the water). The nitrogen gas fraction of the mixture was continuously recorded during the re-breathing proce-dure and reached a relative equilibrium, usually within 5 or 6 breaths. Residual volume was calculated from the ini-tial oxygen volume in the bag and the change in nitrogen fraction by dilution. The underwater weight was measured to the nearest 1/100th of a gram in an enclosed tile tank in
which the subject, while wearing a one-piece swimsuit, sat in a carriage wrack suspended from four LCL 10 load cells integrated with a summing box and digital display cali-brated from 0 to 18,000 g (Omega, Stanford, CT). After two practice trials, underwater weight and the residual lung volume were measured simultaneously 5 times. The average of multiple trial densities within 1/1000th g/cm3
were used for the underwater weight. Percent fat mass was
calculated from whole body density (g/cm3) using
Lohman age specific equations [17].
Data analysis
Accuracy, precision, and bias were examined in ADP with HW serving as the criterion method. Statistical signifi-cance was set at (P ≤ 0.05).
The amount of shared variance between ADP and HW was
assessed by R2. Potential bias between ADP and HW were
examined using Bland-Altman analysis [19]. This particu-lar test examined the difference in body density and per-cent fat between ADP and HW as a function of the average body density and percent fat by ADP and HW. A non-sig-nificant correlation indicated no bias was seen in the tech-nique (i.e. ADP) across the range of fatness.
Results
The purpose of this study was to compare ADP with HW in male and female children and adolescents between the ages of 10–15 years old. Results for this study will be pre-sented in the following order; body density findings
fol-lowed by % fat findings. The physical characteristics of the subjects are presented in Table 1 and a summary of % fat means for the total group and for each gender are found in Figure 1.
Total body density
Accuracy and the amount of shared variance between the techniques of body density was examined by regression of HW body density versus body density by ADP for the total group and for each gender. The regressions between the two methods are shown in the top panel of Figures 2, 3, and 4 for the group, males, and females respectively, while a summary of these regressions are presented in Table 2. The group (Y = 0.835x + 0.171, R2 = 0.84, SEE = 0.007 g/ Top: regression of body density (g/cm3) by ADP against body
density by HW for the total group
Figure 2
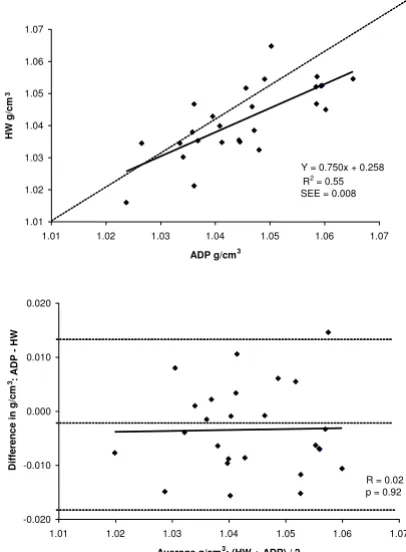
Top: regression of body density (g/cm3) by ADP against body
density by HW for the total group. Bottom: Bland-Altman analysis for the group where the middle dashed line repre-sents the mean difference between body density by ADP – body density by HW. The upper and lower dashed lines rep-resents ± 2 SD from the mean. No bias between the tech-niques was observed as indicated by a nonsignificant P value.
0.98 1.00 1.02 1.04 1.06 1.08 1.10
0.98 1.00 1.02 1.04 1.06 1.08 1.10
ADP g/cm3
HW
g/c
m
3
Y = 0.835x + 0.171 R2= 0.84
SEE = 0.007
-0.020 -0.010 0.000 0.010 0.020
0.98 1.00 1.02 1.04 1.06 1.08 1.10
Average g/cm3: (HW + ADP) / 2
Di
ffe
re
nc
e
in
g
/c
m
3
R = -0.22 p = 0.08
:
ADP
-H
W
Top: regression of body density (g/cm3) by ADP against body
density by HW for males
Figure 3
Top: regression of body density (g/cm3) by ADP against body
density by HW for males. Bottom: Bland-Altman analysis for the group where the middle dashed line represents the mean difference between body density by ADP – body density by HW. The upper and lower dashed lines represents ± 2 SD from the mean. Bias between the techniques was observed as indicated by a significant P value.
Y = 0.837x + 0.174 R2= 0.90
SEE = 0.006 0.98
1.00 1.02 1.04 1.06 1.08 1.10
0.98 1.00 1.02 1.04 1.06 1.08 1.10
ADP g/cm3
HW
g/c
m
3
R = -0.37
P< 0.05 -0.020
-0.010 0.000 0.010 0.020
0.98 1.00 1.02 1.04 1.06 1.08 1.10
Average g/cm3: (HW + ADP) / 2
Di
ffe
re
nc
e
in
g
/c
m
3:ADP
cm3) and male regressions (Y = 0.837x + 0.174, R2 = 0.90,
SEE = 0.006 g/cm3) of ADP total body density compared
to HW total body density significantly deviated from the line of identity. However, for the females the regression between ADP total body density and HW total body density did not significantly deviate from the line of iden-tity (Y = 0750x + 0.258, R2 = 0.55, SEE = 0.008 g/cm3).
A Bland-Altman analysis was performed to determine whether bias existed between ADP and HW total body density across the range of fatness for the entire group and for each gender. These analyses are presented in bottom panel of Figures 2, 3, and 4 for the entire group, males, and females respectively. For the group (R = -0.22; P = 0.08) and for females (R = 0.02; P = 0.92), no bias was observed as indicated by a non significant correlation. However, in males bias existed across the range of fatness (R = -0.37; P ≤ 0.05), with ADP overestimating total body density at lower densities and underestimating total body density at higher densities.
% Fat
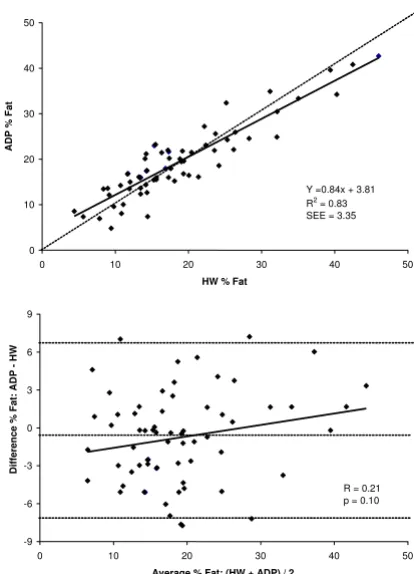
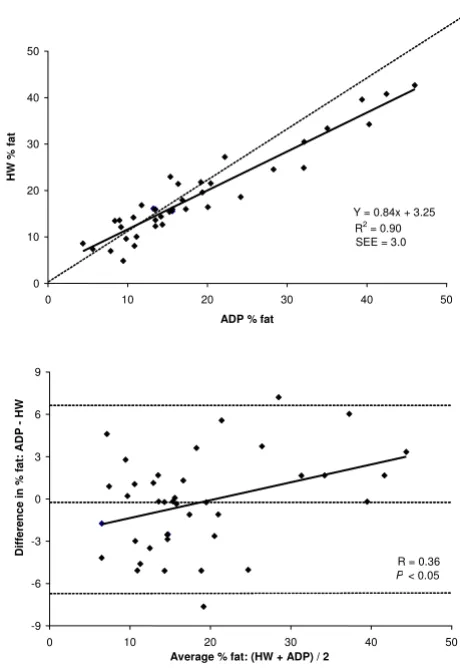
A summary of % fat estimates for the entire group and for each gender for both HW and ADP are shown in Figure 1 and the summary of the regressions for % fat for the group and both genders are shown in Table 3. Accuracy of % fat was examined by the regression of HW % fat against ADP % fat for the total group and for each gender. These regres-sions are shown in the top panel Figures 5, 6, and 7 for the group, males, and females respectively. The regression between % fat by HW and % fat by ADP significantly devi-ated from the line of identity for the entire group (Y = 0.84x + 3.81, R2 = 0.83, SEE = 3.35 % fat) and in the males
(Y = 0.84x + 3.25, R2 = 0.90, SEE = 3.00 % fat). However,
in females the regression did not significantly deviated from the line of identity (Y = 0.81x + 5.17, R2 = 0.56, SEE
= 3.80 % fat).
A Bland-Altman analysis was performed to determine whether bias existed between ADP and HW across the range of body fatness for the group and for each gender. These analyses are shown in bottom panel of Figures 5, 6,
and 7 for the group, males, and females respectively. ADP for the group (R = 0.21; P = 0.10) and for females (R = 0.10; P = 0.57) did not show a significant bias across the
Top: regression of body density (g/cm3) by ADP against body
density by HW for females
Figure 4
Top: regression of body density (g/cm3) by ADP against body
density by HW for females. Bottom: Bland-Altman analysis for the group where the middle dashed line represents the mean difference between body density by ADP – body density by HW. The upper and lower dashed lines represents ± 2 SD from the mean. No bias between the techniques was observed as indicated by a nonsignificant P value.
Y = 0.750x + 0.258 R2= 0.55
SEE = 0.008
1.01 1.02 1.03 1.04 1.05 1.06 1.07
1.01 1.02 1.03 1.04 1.05 1.06 1.07
ADP g/cm3
HW
g/c
m
3
R = 0.02 p = 0.92
-0.020 -0.010 0.000 0.010 0.020
1.01 1.02 1.03 1.04 1.05 1.06 1.07
Average g/cm3: (HW + ADP) / 2
Di
ffe
re
nc
e
in
g
/c
m
3:ADP
-HW
Table 2: Summary of regression for density
R2 Intercept, (g/cm3) Slope SEE (g/cm3)
ADP group 0.84 0.171 ± 0.049* 0.835 ± 0.046** 0.007 ADP males 0.90 0.171 ± 0.048* 0.837 ± 0.045** 0.007 ADP females 0.55 0.258 ± 0.146 0.750 ± 0.140 0.008
range of body fatness. ADP for males showed a significant bias across the range of body fatness (R = 0.36; P ≤ 0.05), with ADP underestimating body fat at lower fat values and overestimating at the higher fat values.
Lung volumes
A paired t – test was conducted to determine if the meas-ured lung volume (e.g. residual lung volume in hydro-static weighing and the thoracic gas volume in ADP) significantly deviated from its respective estimated lung volumes. A summary of the lung volumes are presented in Table 4. A significant over-estimation in the residual lung volume was observed between the measured and pre-dicted residual lung volume for the group (1.27 ± 0.44 vs. 0.84 ± 0.12) and for both males (1.36 ± 0.48 vs. 0.86 ± 0.14) and females (1.12 ± 0.33 vs. 0.82 ± 0.10), as indi-cated by a P ≤ 0.05. A significant under-estimation in the thoracic gas volume was also observed between the meas-ured and predicted thoracic gas volume, volume for the group (2.45 ± 0.68 vs. 2.71 ± 0.51) for the males, (2.53 ± 0.72 vs. 2.74 ± 0.58) and for the females (2.33 ± 0.62 vs. 2.66 ± 0.36) indicated by P ≤ 0.05.
Discussion
The purpose of this study was to validate ADP with HW in a group of children of varying degrees of fatness. This study is significant because the ability to accurately meas-ure body composition in children is challenging and dif-ficult. With the sudden increase in the incidence of pediatric obesity, the ability to accurately determine body composition is paramount in the treatment of this escalat-ing problem. ADP has shown to be a valid tool in an adult population [3-9,20] however, few studies have compared ADP and HW in children [6,11-15]. Thus, the purpose of this study was to compare total body density and % fat measurements obtained by ADP against those obtained by HW in male and female children between the ages of 10–15 years old.
Prior studies validating ADP and HW in children have produced varying results. Lockner et al. studied 54 chil-dren and found agreement between the two techniques by regression analysis [11]. Although regression indicated
agreement between techniques, a significant group mean difference was found (P<0.0005). Dewit et al. also found no difference between total body density by HW and total Table 3: Summary of regression for % fat
R2 Intercept, (kg) Slope SEE (% fat)
ADP group 0.83 3.81 ± 0.97* 0.84 ± 0.05** 3.4 ADP males 0.90 3.25 ± 0.96* 0.84 ± 0.05** 3.0 ADP females 0.56 5.17 ± 2.88 0.81 ± 0.15 3.8
*Significantly different from 0 (P < 0.05) **Significantly different from 1 (P < 0.05)
Top: regression of % fat by ADP against % fat by HW for the total group
Figure 5
Top: regression of % fat by ADP against % fat by HW for the total group. Bottom: Bland-Altman analysis for the group where the middle dashed line represents the mean difference between % fat by ADP – % fat by HW. The upper and lower dashed lines represents ± 2 SD from the mean. No bias between the techniques was observed as indicated by a non-significant P value.
0 10 20 30 40 50
0 10 20 30 40 50
HW % Fat
ADP
%
F
at
Y =0.84x + 3.81 R2= 0.83
SEE = 3.35
-9 -6 -3 0 3 6 9
0 10 20 30 40 50
Average % Fat: (HW + ADP) / 2
Di
ffe
re
nc
e
%
Fa
t:
AD
P
-HW
body density by ADP in children ranging in age from 8– 12 years old [14]. Further research comparing in children has found differences between ADP and HW. Nunez et al. studied a large sample of children consisting of 54 males and 66 females [6]. Regression analysis revealed poor agreement between total body density by HW and total body density by ADP for the entire group of children. Fur-ther analysis by Nunez et al. separated % fat findings by gender and found a significant gender difference. Percent fat measured by ADP was significantly greater than % fat measured by HW in both females and males by 1.7% and 0.5%, respectively (P < 0.0001).
Possible reasons for disagreement in the literature found between ADP and HW in children are numerous. When
assessing body composition by ADP some studies pre-dicted TGV instead of actually measuring TGV [6,11]. Research has shown using the prediction equations originally developed for adults in children will overesti-mate TGV resulting in inaccurate % fat measures [21]. Tra-ditionally, measuring TGV has proven challenging in a pediatric population with 35% of pediatric centers unable to measure the TGV. It should be noted, all of the TGV measurements in this study were measured, and none were predicted. Some studies did not follow strict proto-col and allowed subjects to use clothing other than a tight fitting swimsuit such as spandex bicycle shorts [6,11,22]. When a strict clothing protocol is not followed, it has been shown that % fat can be underestimated upwards of 6% [23,24]. When converting body density to % fat, the Top: regression of % fat by ADP against % fat by HW for
males
Figure 6
Top: regression of % fat by ADP against % fat by HW for males. Bottom: Bland-Altman analysis for the group where the middle dashed line represents the mean difference between % fat by ADP – % fat by HW. The upper and lower dashed lines represents ± 2 SD from the mean. Bias between the techniques was observed as indicated by a significant P value.
Y = 0.84x + 3.25 R2= 0.90
SEE = 3.0
0 10 20 30 40 50
0 10 20 30 40 50
ADP % fat
HW
%
fat
R = 0.36
P< 0.05
-9 -6 -3 0 3 6 9
0 10 20 30 40 50
Average % fat: (HW + ADP) / 2
Di
ffe
re
nc
e
in
%
fa
t:
AD
P
-HW
Top: regression of % fat by ADP against % fat by HW for females
Figure 7
Top: regression of % fat by ADP against % fat by HW for females. Bottom: Bland-Altman analysis for the group where the middle dashed line represents the mean difference between % fat by ADP – % fat by HW. The upper and lower dashed lines represents ± 2 SD from the mean. No bias between the techniques was observed as indicated by a non-significant P value.
Y = 0.81x + 5.17 R2= 0.56 SEE = 3.8
0 5 10 15 20 25 30 35
0 5 10 15 20 25 30 35
ADP % fat
HW
%
fat
R = 0.10 p = 0.57
-10 -7 -4 -1 2 5 8
0 5 10 15 20 25 30 35
Average % fat: (HW + ADP) / 2
Di
ffe
re
nc
e
%
fa
t:
AD
P
correct child specific equation must be used. Both Demer-ath et al. and Lockner et al. used the Siri equation to con-vert body density to % fat instead of the child gender specific Lohman equations [11,12]. And lastly, in a study by Lockner et al. the testing order was randomized, thus some of the children performed an ADP after performing a HW [11]. It has been shown by Fields et al., that HW prior to ADP resulted in an underestimation of % fat by approximately 3% [16].
One of the purposes of this study was to examine poten-tial gender differences between ADP and HW. The results from this study did show significant gender difference between techniques, with males significantly deviating from the line of identity. However, this was not found in females for either total density or % fat. Nonetheless, this gender difference reported in this study should be viewed with caution because a power analysis revealed that 40 subjects per gender (Group N = 80) were needed for 80% power (alpha = 0.05) for a main effect of 1.5% fat. In this study only 26 females were used in the data analysis, though 37 were brought in for testing. This was due to the fact that 9 of the female subjects were unable to perform the HW procedures and two were lost when equipment malfunctioned. A power analysis for this data set was per-formed and it was found after factoring in those dropped from the study, there remained only a power of 0.429. Therefore, we did not have enough power to detect the potential difference between the methods in females.
Research has shown for ADP that prediction equations developed in adults provide invalid lung volume predic-tions in children. The adult prediction equapredic-tions used to predict TGV were developed using a healthy adult popula-tion [25]. Fields et al. measured TGV in 113 boys and 111 girls and found prediction equations significantly overes-timated TGV in both genders (P < 0.001) [21]. In the cur-rent study, residual lung volume was measured simultaneously in water and TGV was measured during testing. This is significant because only two other studies
have been able to simultaneously measured residual lung volume while underwater weighing in children [13,14].
Interestingly, the coefficient of variance (CV) for repeated measures over two days in a subset of the children in this study for ADP and HW was 3.1% and 7.1% respectively. This is quite high considering the CV for ADP and HW in our laboratory for adults are 1% and 1.5% respectively, though Nunez et al. reported an ADP CV of 8.5% in a pediatric population [6]. Consequently, the high CV may be playing a role in the true relationship between ADP and HW.
Conclusion
Due to the ease in the testing procedure and high subject compliance for all ages, ADP has quickly begun to emerge as a popular body composition method to use in children and adults. In the current study, we found an overall poor agreement between ADP and HW with the study inade-quately powered to make any definitive statements con-cerning potential gender differences between the techniques. In conclusion, we recommend more studies validating ADP and HW in children be performed utiliz-ing a larger sample size.
Competing interests
David A. Fields has received funding from Life ment Incorporated for past studies (though Life Measure-ment Incorporated did not fund this study). None of the authors have non-financial competing interests or own stock or are applying for patents that may represent a con-flict of interest.
Authors' contributions
GC carried out the hydrostatic weighing and ADP studies, participated in the design of the study, coordinated the study, and helped draft the manuscript. HH provided crit-ical evaluation on ADP testing and participated in writing of the manuscript. DF conceived the study, performed the statistical analysis, and drafted the manuscript. All authors read and approved the final manuscript.
Table 4: Summary of residual volume and thoracic gas volumes for the total group and for both genders
Residual Volume (predicted1)
Residual Volume (measured)
TGV (predicted2) TGV (measured)
Group 0.84 ± 0.12 1.27 ± 0.44** 2.71 ± 0.51 2.45 ± 0.68** Males 0.86 ± 0.14 1.36 ± 0.48* 2.74 ± 0.58 2.53 ± 0.72* Females 0.82 ± 0.10 1.12 ± 0.33* 2.66 ± 0.36 2.33 ± 0.62*
* Statistically significant from predicted (P < 0.05) ** Statistically significant from predicted (P < 0.01)
Publish with BioMed Central and every scientist can read your work free of charge
"BioMed Central will be the most significant development for disseminating the results of biomedical researc h in our lifetime."
Sir Paul Nurse, Cancer Research UK
Your research papers will be:
available free of charge to the entire biomedical community
peer reviewed and published immediately upon acceptance
cited in PubMed and archived on PubMed Central
yours — you keep the copyright
Submit your manuscript here:
http://www.biomedcentral.com/info/publishing_adv.asp
BioMedcentral
Acknowledgements
We would like to acknowledge Drs. Mike Bemben and Andrew Gardner for their involvement in the project.
References
1. Hedley AA, Ogden CL, Johnson CL, Carroll MD, Curtin LR, Flegal KM: Prevalence of overweight and obesity among US chil-dren, adolescents, and adults, 1999-2002. Jama 2004, 291:2847-2850.
2. Dempster P, Aitkens S: A new air displacement method for the determination of human body composition. Med Sci Sports Exerc 1995, 27:1692-1697.
3. Biaggi RR, Vollman MW, Nies MA, Brener CE, Flakoll PJ, Levenhagen DK, Sun M, Karabulut Z, Chen KY: Comparison of air-displace-ment plethysmography with hydrostatic weighing and bioe-lectrical impedance analysis for the assessment of body composition in healthy adults. Am J Clin Nutr 1999, 69:898-903. 4. Fields DA, Wilson GD, Gladden LB, Hunter GR, Pascoe DD, Goran
MI: Comparison of the BOD POD with the
four-compart-ment model in adult females. Med Sci Sports Exerc 2001, 33:1605-1610.
5. Levenhagen DK, Borel MJ, Welch DC, Piasecki JH, Piasecki DP, Chen KY, Flakoll PJ: A comparison of air displacement plethysmog-raphy with three other techniques to determine body fat in healthy adults. J Parenteral Enteral Nutr 1999, 23:293-299. 6. Nunez C, Kovera AJ, Pietrobelli A, Heshka S, Horlick M, Kehayias JJ,
Wang Z, Heymsfield SB: Body composition in children and adults by air displacement plethysmography. Eur J Clin Nutr
1999, 53:382-387.
7. Vescovi JD, Hildebrandt L, Miller W, Hammer R, Spiller A: Evalua-tion of the BOD POD for estimating percent fat in female college athletes. J Strength Cond Res 2002, 16:599-605.
8. Vescovi JD, Zimmerman SL, Miller WC, Hildebrandt L, Hammer RL, Fernhall B: Evaluation of the BOD POD for estimating per-centage body fat in a heterogeneous group of adult humans.
Eur J Appl Physiol 2001, 85:326-332.
9. McCrory MA, Gomez TD, Bernauer EM, Mole PA: Evaluation of a new air displacement plethysmography for measuring human body composition. Med Sci Sports Exerc 1995, 27:1686-1691.
10. Collins MA, Millard-Stafford ML, Sparling PB, Snow TK, Rosskopf LB, Webb SA, Omer J: Evaluation of the BOD POD for assessing body fat in collegiate football players. Med Sci Sports Exerc 1999, 31:1350-1356.
11. Lockner DW, Heyward VH, Baumgartner RN, Jenkins KA: Compar-ison of air-displacement plethysmography, hydrodensitome-try, and dual X-ray absorptiometry for assessing body composition of children 10 to 18 years of age. Ann N Y Acad Sci
2000, 904:72-78.
12. Demerath EW, Guo SS, Chumlea WC, Towne B, Roche AF, Siervogel RM: Comparison of percent body fat estimates using air dis-placement plethysmography and hydrodensitometry in adults and children. Int J Obes Relat Metab Disord 2002, 26:389-397.
13. Fields DA, Goran MI: Body composition techniques and the four-compartment model in children. J Appl Physiol 2000, 89:613-620.
14. Dewit O, Fuller NJ, Fewtrell MS, Elia M, Wells JC: Whole body air displacement plethysmography compared with hydrodensit-ometry for body composition analysis. Arch Dis Child 2000, 82:159-164.
15. Wells JC, Douros I, Fuller NJ, Elia M, Dekker L: Assessment of body volume using three-dimensional photonic scanning.
Ann N Y Acad Sci 2000, 904:247-254.
16. Fields DA, Hunter GR, Higgins PB: Assessment of body composi-tion by air displacement plethysmography: Influence of body temperature and moisture. Dynamic Medicine 2004, 3:. 17. Lohman TG: Assessment of body composition in children.
Pedi-atr Exerc Sci 1989, 1:19-30.
18. Ruppell G: Manual of pulmonary function testing. St. Louis, Mosby; 1994:11-14.
19. Bland JM, Altman DG: Statistical methods for assessing agree-ment between two methods of clinical measureagree-ment. Lancet
1986, 1:908-909.
20. Fields DA, Goran MI, McCrory MA: Body-composition assess-ment via air-displaceassess-ment plethysmography in adults and children: a review. Am J Clin Nutr 2002, 75:453-467.
21. Fields DA, Hull HR, Cheline AJ, Yao M, Higgins PB: Child-specific thoracic gas volume prediction equations for air-displace-ment plethysmography. Obes Res 2004, 12:1797-1804. 22. Hull HR, Fields DA: Effect of Short Schemes on Body
Compo-sition Measurements using Air-Displacement Plethysmography. Dyn Med 2005, 4:8.
23. Vescovi JD, Zimmerman SL, Miller WC, Fernhall B: Effects of cloth-ing on accuracy and reliability of air displacement plethysmography. Med Sci Sports Exerc 2002, 34:282-285. 24. Fields DA, Hunter GR, Goran MI: Validation of the BOD POD
with hydrostatic weighing: influence of body clothing. Int J Obes Relat Metab Disord 2000, 24:200-205.
25. Crapo RO, Morris AH, Clayton PD, Nixon CR: Lung volumes in healthy nonsmoking adults. Int Europ Physiopath Resp 1982, 18:419-425.
Pre-publication history
The pre-publication history for this paper can be accessed here: