https://dx.doi.org/10.24001/ijaems.3.9.2 ISSN: 2454-1311
Image Segmentation of Cows using Thresholding
and K-Means Method
Rosida Vivin Nahari
1, Achmad Jauhari
2, Rachmad Hidayat
3, Riza Alfita
41Department of Engineering, Trunojoyo University, Indonesia
Email: [email protected]
2 Department of Engineering, Trunojoyo University, Indonesia
Email: [email protected]
3 Department of Engineering, Trunojoyo University, Indonesia
Email: [email protected]
4 Department of Engineering, Trunojoyo University, Indonesia
Email : [email protected]
Abstract— Cow’s weight parameter depends on the
characteristics and size of the cow’s body. This system
aims to segment body parts of cows using thresholding and K-Means method to produce cow body extraction as an early stage in the process of estimating cow’s weight. The thresholding method begins by inputting a digital image then performing a sharpened grayscale process with edge detection and dilation processes. As a comparison, segmentation with K-Means method would segment the image into two (2) clusters. The results
showed better segmentation of cow’s body with local
thresholding method than the other two methods.
Keywords— Image Segmentation, cows, Thresholding, K-Means.
I. INTRODUCTION
Cattle breeding in Indonesia are largely done using traditional patterns and a side business that cannot be separated from farming. The traditional weighing activity of cow is done by using tape measure because weighing instrument is expensive for local farmers. Only staff of the related agencies can perform the use of weighing tools; this makes general public find it difficult to directly know the weight of cows. Therefore, an application that can help in estimating the weight of cows by using digital image processing is necessary.
Estimation of cow’s weight is based on the image of the body length, height, chest circumference, and body width (Zein, 2016). With the existing imagery, segmentation process can be done to get the data on characteristic of cows to estimate the weight. Thresholding and K-Means is a method that can facilitate the segmentation of cattle to estimate cow’s weight.
The purpose of this study is to separate the object by using thresholding and K-means method. The method is expected to make it easier in the process of estimating cow’s weight by using images.
II. IMAGE SEGMENTATION
Image segmentation is the process of grouping neighboring pixels coherent of their properties (e.g. intensity values). The result area can be an object or part of an object, and a verifiable bias (or modification) follows the step of image analysis or pattern recognition. Computer vision applications always use image segmentation as the initial procedure. As the output of this step, each object in the image, as a collection of pixels, is separated from the entire image or background. The purpose of this step is to separate the object with its background without overlapping. Usually this segmentation process is done based on the gray-level histogram of the image. In this case, the goal is to determine the threshold value, which, if applied to the image, will occur pixel grouping according to the threshold value.
Thresholding Method
In image processing, threshold operation process or often-called thresholding is one of the most commonly used operations in analyzing an object image. Threshold is a way to reinforce the image by changing the image to black and white (its value is only to be between 0 and 1). Thresholding is used to adjust the amount of gray degree present in the image. This thresholding process is basically a process of altering quantization on the image. To get good segmentation results, some image-quality improvement operations are done first to sharpen the boundary between the object and the background. In this operation, the pixel value that qualifies the threshold is mapped to a desired value. In this case, the required threshold and value terms are tailored to the needs.
Stages of Thresholding
https://dx.doi.org/10.24001/ijaems.3.9.2 ISSN: 2454-1311
Global Thresholding
One example of global thresholding methods is the Otsu method. The Otsu method calculates the threshold value of T automatically based on the input image. The approach used by the Otsu method is to conduct a discriminant analysis i.e. determining a variable that can distinguish between two or more groups that arise naturally. Discriminant analysis maximizes the variables in order to separate objects against the background [5]. A graythresh count function is thresholding using the Otsu method (Otsu, 1979), where the threshold value to search from a gray level image is expressed by k. The value of k ranges from 1 to L, with a value of L equals to 255. The number of pixels at the gray level i is denoted by n1 and the number of pixels in the image by N is denoted by n1 + n2 + ... + nL [2]. Suppose that the threshold value to search is expressed by k. The k values range from 1 to L, with L equals to 255 [6].
The probability for pixel i is expressed by:
𝑃𝑖= 𝑛𝑖
𝑁 (1)
ni denotes the number of pixels with the gray level I and
N denotes the number of pixels in the image. The cumulative moment value to zero, the cumulative moment to one, and the consecutive average value can be expressed as follows:
𝑤(𝑘) = ∑𝑘𝑖=1𝑝𝑖 (2)
𝜇(𝑘) = ∑𝑘𝑖=1𝑖. 𝑝𝑖 (3)
𝜇𝑇= ∑𝑘𝑖=1𝑖. 𝑝𝑖 (4)
The threshold value k can be determined by maximizing the equation:
𝛿𝐵2(𝑘∗) = 𝑚𝑎𝑥1≤𝐿𝛿𝐵2(𝑘) (5)
in which:
𝛿𝐵2(𝑘) =
[𝜇𝑇 𝑤(𝑘)− 𝜇(𝑘)]2
𝑤(𝑘)[1−𝑤(𝑘)] (6)
in which
pi: pixel probability
ni: the number of pixels at gray level N: the number of pixels in an image k: the threshold value of an image w: cumulative moment
μ: average value μT: total average value δ: class variance
Local Thresholding
The global thresholding method may fail if the background contrast is uneven. Thresholding would be
said to be a local thresholding if the value of T (threshold value) depends on the gray level of f (x, y) and the local property value of image p (x, y). In local thresholding, the image will be divided into smaller sections and development process will be done locally. Local thresholding can be shown that this process is equivalent to thresholding f (x, y) with local functions varying T threshold (x, y)
𝑔(𝑥, 𝑦) = {0 𝑗𝑖𝑘𝑎 𝑓(𝑥, 𝑦) ≥ 𝑇
1 𝑗𝑖𝑘𝑎 𝑓(𝑥, 𝑦) < 𝑇 (7)
in which:
𝑇(𝑥, 𝑦) = 𝑓0(𝑥, 𝑦) + 𝑇0
𝑓0(x, y) is the morphological opening of f and 𝑇0 constant is the result of the graytresh function used in 𝐹0.
Local thresholding is very useful in overcoming the lost information resulting from the selection of an average threshold. In local thresholding, an image is divided into small blocks and then localized on each block with different T values [6].
Canny Method
The canny algorithm approach is performed by convolution of image functions with Gaussian operators and their derivatives. The Canny algorithm runs in five separate steps:
1. Smoothing : Blur the image to remove noise
2. Finding gradient : The edge should be marked on the image having a large gradient.
3. Non-maximum-suppression: Only local maxima should be marked as edge.
4. Double thresholding : The potential edge is determined by thresholding.
5. Edge Tracking : The final edge is determined by pressing all sides that are not connected to a very strong edge.
K-Means Method
One of the common clustering algorithms that group data according to similar characteristics or cluster characteristics is K-Means. The K-Means algorithm to group data into clusters is shown in figure 1.
Image Segmentation
Image segmentation is an image processing that aims to separate the region of an object with the background area so that the object can be easily analyzed in order to recognize one that involves a lot of visual perception.
Dilation
https://dx.doi.org/10.24001/ijaems.3.9.2 ISSN: 2454-1311
dilation between A and B is denoted by A⊕B. Mathematically, it can be written as follows:
𝐴⊕𝐵= 𝑧|𝐵𝑧∩𝐴 ≠ ∅ (8)
The above equation is based on reflection of B on its origin, and reflection shifts by z. Dilation of A and B are the set of all displacement of z, so the above equation can be rewritten equivalently as:
𝐴⊕𝐵= 𝑧|[𝐵𝑧∩𝐴]⊆𝐴 (9)
In which B set is strel, whereas A set (image object) is distilled..
Start
Number of Cluster K
Centroid
Distance objects to centroids (uclidean
distance)
Grouping based on minimum
distance
End No object move
group ?
n
y
Fig. 1: Chart of K-Means Algorithm
III. RESEARCH METHODOLOGY Data analysis
This study uses secondary data in the form of digital image of cows. The data processing technique uses grayscale image matrix of cows with 280 x 180 matrixes, data class unit 8 with 256 gray levels to calculate threshold value (T) with global thresholding and local thresholding method.
Research Analysis
This study follows the following flow diagram is shown in figure 2.
Start
End Otsu Method
Canny Method
K-means Method
Dilasi
Segmented Image RGB Image
Image Conversion
Adaptive local
Fig. 2: Research Flow
IV. RESULT AND IMPLEMENTATION
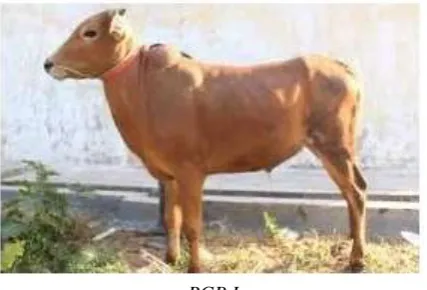
Image Input
The image uses as the input is a digital image of cow with RGB (Red, Green, Blue) color model. The digital image of the cow extends JPG (Joint Photographic Group). Furthermore, RGB image is converted into a grayscale image color model so it has only one grayscale value in each pixel.
https://dx.doi.org/10.24001/ijaems.3.9.2 ISSN: 2454-1311
b. Grayscale Image
Fig. 3: The figure of changes from RGB to Grayscale image
Image Segmentation Process
Before the image segmentation process, first threshold value (T) will be determined using global thresholding method (Otsu method) and adaptive local thresholding to grayscale image (Figure).
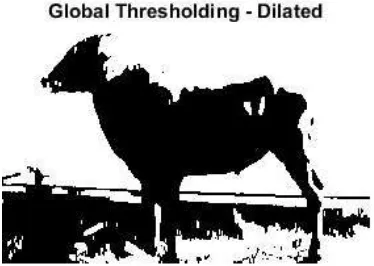
Global Thresholding
Analysis of grayscale image using Otsu method resulted in level = 0.639; the result of image segmentation by using global thresholding method is shown in Figure 4.
Fig. 4: Image Segmentation with Global Thresholding Method
Local Thresholding
With the local thresholding method, the local window size value is ws = 11 and mean value is = 0,03. The result of image segmentation using local thresholding method is shown in Figure 5.
Fig. 5: Image Segmentation with Local Thresholding Method
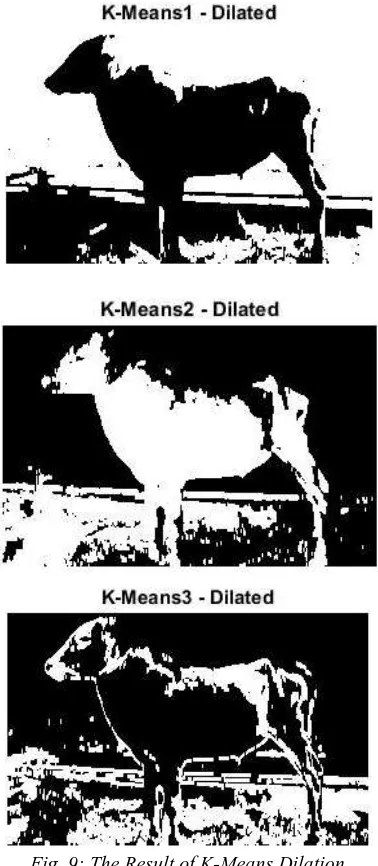
K-Means
K-Means in this study is a clustering-based segmentation method that classifies image pixels into 2 clusters or K = 2. The result of clustering based segmentation using K-Means method is shown in figure 6.
Fig. 6: Image Segmentation with K-Means Method
Dilation Process
The dilation process of the edge detection result aims to sharpen or reinforce the edge detection result with a 3 x 3-matrix element structure with the 3-matrix component of 1.
https://dx.doi.org/10.24001/ijaems.3.9.2 ISSN: 2454-1311
Fig. 8: The Result of Local Dilation
Fig. 9: The Result of K-Means Dilation
Edge Detection Process
The edge detection process aims to improve the appearance of the boundary line in the image. In this edge detection process, we use the canny operator.
Canny Operator
The result of dilation to edge detection image uses canny operator toward the global thresholding with thresholding level values of 0.639 (Figure 10a), to the local thresholding means value 0.03 (Figure 10b).
Fig. 10: Edge Detection of Global Thresholding
https://dx.doi.org/10.24001/ijaems.3.9.2 ISSN: 2454-1311
Fig. 12: Edge Detection Process Using Canny Operator
V. CONCLUSION
Based on the evaluation in making the processing system of digital image segmentation on the cow body, it can be concluded that the research has been in accordance with the objectives. Here are some conclusion points from this work:
1. The system has successfully handled image processing from image input process to normalization by using some equations.
2. The system has implemented cow segmentation with local and global thresholding method compared with K-means method.
3. The system has an advantage in processing the cow body points so it can be detected clearly.
REFERENCES
[1] Parker, J. R. (2010). Algorithms for image processing
and computer vision. John Wiley & Sons.
[2] Kapur, J. N., Sahoo, P. K., & Wong, A. K. (1985). A
new method for gray-level picture thresholding using the entropy of the histogram. Computer vision,
graphics, and image processing, 29(3), 273-285.
[3] Zhang, J., & Hu, J. (2008, December). Image
segmentation based on 2D Otsu method with histogram analysis. In Computer Science and Software Engineering, 2008 International Conference
on (Vol. 6, pp. 105-108). IEEE..
[4] Lee, S. U., Chung, S. Y., & Park, R. H. (1990). A comparative performance study of several global thresholding techniques for segmentation. Computer Vision, Graphics, and Image Processing, 52(2), 171-190.
[5] Glasbey, C. A. (1993). An analysis of
histogram-based thresholding algorithms. CVGIP: Graphical models and image processing, 55(6), 532-537.
[6] Gonzalez, R. C., & Woods, R. E. (2002). Processing
[7] Yan, F., Zhang, H., & Kube, C. R. (2005). A
multistage adaptive thresholding method. Pattern recognition letters, 26(8), 1183-1191.
[8] Ray, S., & Turi, R. H. (1999, December).
Determination of number of clusters in k-means
clustering and application in colour image
segmentation. In Proceedings of the 4th international conference on advances in pattern recognition and digital techniques (pp. 137-143).
[9] Küçükkülahli, E., Erdoğmuş, P., & Polat, K. (2016). Brain MRI Segmentation based on Different Clustering Algorithms. Brain, 155(3).
[10]Surlakar, P., Araujo, S., & Sundaram, K. M. (2016,
February). Comparative Analysis of Means and K-Nearest Neighbor Image Segmentation Techniques. In Advanced Computing (IACC), 2016 IEEE 6th International Conference on (pp. 96-100). IEEE.
[11]Jindal, G., & Cheema, S. S. (2016). Review Paper of
Segmentation of Natural Images using HSL Color Space Based on K-Mean Clustering.
[12]Marmanis, D., Schindler, K., Wegner, J. D., Galliani,
S., Datcu, M., & Stilla, U. (2016). Classification with an edge: improving semantic image segmentation
with boundary detection. arXiv preprint
arXiv:1612.01337.
[13]Wang, L., & Pan, C. (2014). Robust level set image