EPJ Web of Conferences 43, 01005 (2013) DOI: 10.1051/epjconf/20134301005 C
Owned by the authors, published by EDP Sciences, 2013
Rotation and stellar evolution
P. Eggenberger
aObservatoire de Genève, Université de Genève, 51 Ch. des Maillettes, 1290 Sauverny, Suisse
Abstract. The effects of rotation on the evolution and properties of low-mass stars are first discussed from the pre-main sequence to the red giant phase. We then briefly indicate how some observational constraints available for these stars can help us progress in our understanding of the dynamical processes at work in stellar interiors.
1. INTRODUCTION
Rotation is an important physical process that can have a significant impact on stellar evolution (see e.g. [1]). Rotational effects have generally been included in stellar evolution codes in the context of shellular rotation, which assumes that a strongly anisotropic turbulence leads to an essentially constant angular velocity on the isobars [2]. Here, we first illustrate the impact of rotation on the properties of low-mass stars at different evolutionary phases by presenting models computed with the Geneva stellar evolution code that includes a detailed treatment of shellular rotation [3]. We then compare these models to some observational constraints available for low-mass stars, which are particularly useful to constrain the modelling of the dynamical processes operating in stellar interiors.
2. EFFECTS OF ROTATION
2.1 Pre-main sequence
The effects of rotation during the pre-main sequence (PMS) evolution of solar-type stars are first briefly discussed (see [4] for a more detailed discussion). Figure 1 (left) illustrates the change in the HR diagram due to rotational effects during the PMS evolution of 1M models with a solar chemical composition and a solar-calibrated parameter for the mixing-length. One model is computed without rotation (continuous line) and one model includes a detailed treatment of shellular rotation (dashed line). The rotating model is computed with an initial angular velocity of 20. A disc lifetime of 6 Myr is used for this model, and we simply assume that the surface angular velocity of the star remains constant during the disc-locking phase.
As shown in Fig.1(left), the track corresponding to the model including rotational effects is shifted to slightly lower effective temperatures and luminosities. These changes in the evolutionary tracks observed in the HR diagram during the PMS evolution of rotating models of solar-type stars are due to the effects of the centrifugal force and not to a change in the global properties induced by rotational mixing.
ae-mail:[email protected]
Figure 1. Left: PMS evolutionary tracks in the HR diagram for 1M models with and without rotation. The continuous line corresponds to a non-rotating model, while the dashed line corresponds to a rotating model computed with a full treatment of shellular rotation. The tracks end when the ZAMS is reached. Right: Evolution of the surface lithium abundance during the PMS for the same models.
The evolution of the surface lithium abundance during the PMS is shown for the same models in Fig.1(right). We see that the rotating model exhibits a lower lithium surface abundance than the non-rotating model on the zero-age main Sequence (ZAMS). The inclusion of rotational effects is thus found to globally increase the lithium depletion during the PMS. However, we note that the lithium content during the beginning of the lithium depletion phase on the PMS is slightly higher for the rotating model compared to the non-rotating one. This is due to the centrifugal force, which decreases the effective gravity of the star and leads to a lower temperature at the base of the convective envelope during the beginning of the PMS evolution when the star is still fully convective. This results in a slightly lower lithium depletion rate for the rotating model than for the non-rotating one during the beginning of the PMS. After this initial phase, a radiative zone appears at the stellar centre. At this stage, rotational mixing begins to play the dominant role by transporting lithium to deeper and hotter regions where it is efficiently destroyed. As shown in Fig.1(right), this results in lower surface lithium abundances at the ZAMS for the rotating model compared to the non-rotating one. Note that this decrease in the surface lithium abundance by rotational mixing is directly related to the increase of differential rotation in the stellar interior during the PMS evolution. We thus see that the effects of rotation on the PMS tracks in the HR diagram are mainly due to the centrifugal force, but that rotational mixing plays the dominant role in the change of the lithium content observed for rotating models during the PMS.
Ageing Low Mass Stars: From Red Giants to White Dwarfs
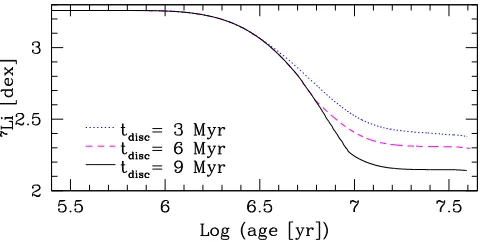
Figure 2. Surface lithium abundances during the PMS for rotating 1M models computed with the same initial angular velocity but different disc lifetimes. The dotted, dashed and continuous lines correspond to disc lifetimes of 3, 6 and 9 Myr, respectively.
is then more efficient in the interiors of models computed with longer disc lifetimes; this explains the differences in the lithium abundances shown in Fig.2.
The surface angular velocity remains constant during the disc-locking phase and increases as soon as the disc disappears due to stellar contraction. When the duration of the disc-locking phase increases, the star loses a larger amount of angular momentum and reaches the ZAMS with a lower surface rotational velocity. As we have just seen that models with longer disc lifetimes exhibit higher lithium depletion than models with shorter disc lifetimes, we then obtain an interesting link between the surface velocity and lithium abundance on the ZAMS: stars with lower rotation rates on the ZAMS are predicted to be more depleted in lithium than stars that are fast rotators on the ZAMS. This is in good agreement with observations of lithium abundances and surface rotation rates in the Pleiades (e.g. [5]). Recalling that longer disc lifetimes may favour the formation and migration of giant exoplanets, this is also in good agreement with the possible detection of differences in the lithium content of stars with and without exoplanets [6] (but see also [7] for a contrary view).
2.2 Main sequence
During the main sequence, rotational mixing begins to play a key role by changing the global stellar properties. This is illustrated in Fig.3(left) which shows the main-sequence evolution for two 1M models computed with and without shellular rotation. These models are computed with a solar chemical composition and a solar calibrated value for the mixing-length parameter. The rotating model has an initial velocity on the ZAMS of 50 km s−1. We see that rotation shifts the evolutionary track to the blue part of the HR diagram. The rotating model is then characterised by higher effective temperatures and slightly higher luminosities than the non-rotating one.
As shown in Fig.3(right), rotational mixing is found to counteract the effects of atomic diffusion in the external layers of the star. This results in larger surface abundances of helium for the rotating model compared to the non-rotating one. The opacity in the external layers of the rotating model then decreases and this explains the shift towards the blue part of the HR diagram observed for the rotating model in Fig.3(left). The changes in the helium content of the external layers for rotating and non-rotating stars become more and more important during the main sequence and this results in significant differences in the HR diagram.
Figure 3. Left: Evolution in the HR diagram during the main sequence for 1Mmodels with and without rotation. The continuous line corresponds to a non-rotating model, while the dashed line corresponds to a rotating model computed with an initial velocity on the ZAMS of 50 km s−1. Right: Evolution of the surface helium abundance during the main sequence for the same models.
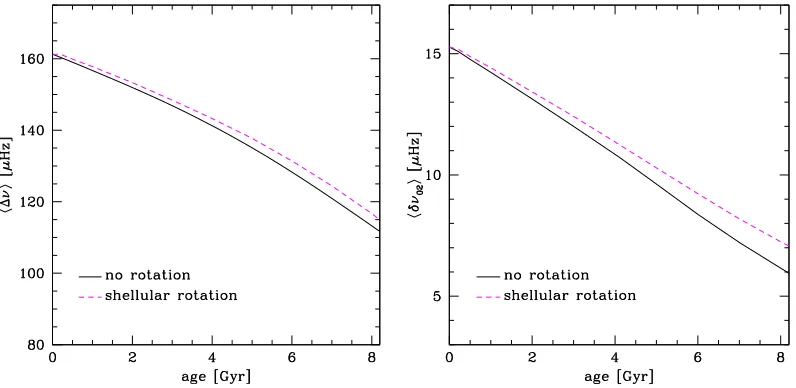
Figure 4. Left: Variation of the mean large frequency separation during the main sequence for 1M models. The continuous line corresponds to a non-rotating model, while the dashed line corresponds to a rotating model computed with an initial velocity on the ZAMS of 50 km s−1. Right: Variation of the mean small frequency separation between=2 and=0 modes during the main sequence for the same models.
Ageing Low Mass Stars: From Red Giants to White Dwarfs
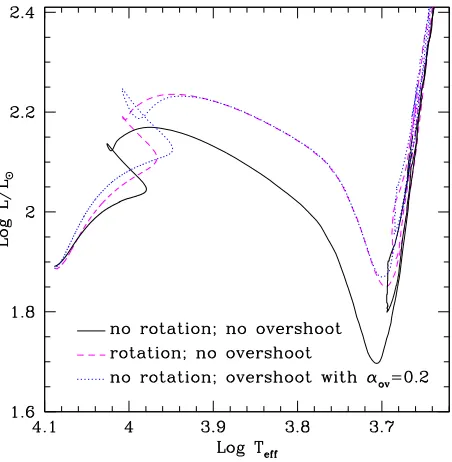
Figure 5. Evolution in the HR diagram for 3M models computed with and without rotation. The dotted and continuous lines correspond to non-rotating models computed with and without overshooting, respectively. The dashed line indicates a rotating model computed without overshooting and with an initial velocity on the ZAMS of 150 km s−1.
also shows that the rotating model exhibits higher values of the mean small separation at a given age than the non-rotating one. The small frequency separation is very sensitive to the structure of the core and is mainly proportional to the central hydrogen abundance. The increase of the small separation observed for rotating models is thus a direct consequence of the increase of the central hydrogen abundance by rotational mixing.
2.3 Post-main sequence
The effects of rotation on the properties of low-mass red giant stars are discussed in these proceedings by N. Lagarde (see also [9]). In this section, we briefly illustrate the impact of rotation on the properties of red giants which are massive enough to ignite He burning in non-degenerate conditions.
Figure5shows the evolution in the HR diagram of 3M models computed with a solar chemical composition and a solar-calibrated mixing-length parameter. The rotating model has an initial velocity on the ZAMS of 150 km s−1. By comparing models computed without overshooting from the convective core, we note that the inclusion of rotation results in a widening of the main sequence with a significant increase of the stellar luminosity for the rotating model compared to the non-rotating one. In particular, the core helium-burning phase is shifted to higher values of the luminosity when rotational effects are taken into account. These changes are due to rotational mixing, which brings fresh hydrogen fuel into the convective core and transports helium and other H-burning products in the radiative zone.
3. COMPARISON WITH OBSERVATIONAL CONSTRAINTS
In the preceding section, stellar models including a detailed description of the effects of rotation on the stellar structure and evolution have been presented. To progress in our understanding of these physical processes, one needs to confront rotating models to observations. In this section, we briefly describe some observational constraints that are particularly interesting in this context.
3.1 Surface rotation
Observations of the surface rotation of stars can bring valuable constraints to the modelling of angular momentum transport in stellar interiors. For young solar-type stars in open clusters, observations of rotational periods indicate that slow rotators develop a high degree of differential rotation between the radiative core and the convective envelope, while solid-body rotation is favoured for fast rotators [11–14]. While these observations can be reproduced by models including shellular rotation for slow rotating solar-type stars, the same models fail at correctly reproducing the observed surface rotation rates for fast rotators. This is due to the fact that meridional circulation and shear mixing alone do not couple the core and envelope, even in the presence of rapid rotation [15]. The comparison between observations of surface rotation rates for fast rotating young solar-type stars and models including rotational effects thus indicates that an additional mechanism for the transport of angular momentum is needed during the beginning of the main-sequence evolution of these stars.
3.2 The solar rotation profile
The observations of the solar five-minute oscillations have provided a wealth of information on the internal solar structure. In particular, helioseismic data have led to the determination of the internal rotation profile of the Sun [16–20]. This observational constrain is of course of prime importance to progress in the modelling of transport processes at work in stellar interiors.
As shown in Fig.6, solar models including only shellular rotation predict a rapidly rotating core, which is in contradiction with the near uniformity of the solar rotation profile as deduced from helioseismic data [21–24]. This shows that meridional circulation and shear turbulence produce an insufficient coupling to correctly reproduce the solar rotation profile and this suggests that another physical process is at work in the radiative interior. Figure 6shows the rotation profile obtained for a solar model including both shellular rotation and the effects of magnetic fields as modelled with the Tayler-Spruit dynamo [25]. We recall here that the presence of a dynamo operating in a radiative zone is still a matter of debate (e.g. [26]). It is however interesting to note that models including both the effects of shellular rotation and magnetic fields as prescribed by the Tayler-Spruit dynamo predict a solar rotation profile in good agreement with helioseismic measurements [23].
Ageing Low Mass Stars: From Red Giants to White Dwarfs
Figure 6. Rotation profiles for two solar models computed with rotation only (continuous line) and with both rotation and magnetic fields (dashed line). The initial velocity on the ZAMS is 50 km s−1.
asteroseismic campaigns have enabled the detection of like oscillations for a handful of solar-type stars (see e.g. [27]), as well as for a few red giants [28–31]. However, due to the limited duration of these ground-based campaigns, no clear determination of rotational splittings have been obtained for stars exhibiting solar-like oscillations, with only one tentative evidence reported forVirginis [32,33]. Thanks to space missions, the situation begins to change with interesting results now being obtained for red giant stars.
3.3 Asteroseismology of red giants
The CoRoT [34] and Kepler [35] spacecrafts have enabled the observation of solar-like oscillations for a large number of red giants. These observations have led to the determination of rotational frequency splittings of mixed modes in red giants [36]. We recall here that rotation lifts the degeneracy in the azimuthal order of non-radial modes, leading to (2+1) frequency peaks in the power spectrum for each mode. Rotational splittings are defined as the frequency separations between these peaks and are directly related to the angular velocity and the properties of the modes in their propagation regions inside the star. Mixed modes are sensitive to the properties of the stellar core, but they contain a different amount of pressure and gravity-mode influence. The mode at the centre of what is called a ‘dipole forest’ is dominated by its acoustic character and is more sensitive to the external layers, while adjacent modes in the ‘wings’ of the forest are more gravity-dominated and sensitive to the stellar core. Observing rotational splittings for such modes can thus bring us valuable information about the internal rotation profile of red giants.
Figure 7. Rotation profile in the central layers for a model of the red giant KIC 8366239 including shellular rotation only. The initial velocity on the ZAMS of this model is 50 km s−1.
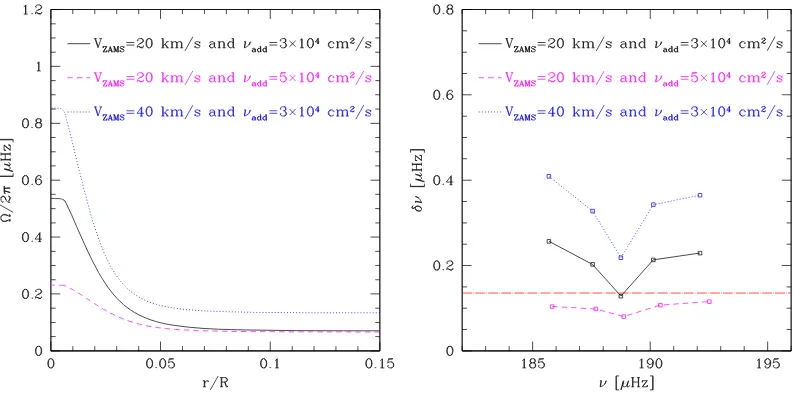
Figure 8. Left: Rotation profiles for models of the red giant KIC 8366239 computed with different values of the initial velocity on the ZAMS (VZAMS) and different values for the viscosity of an additional mechanism for the internal transport of angular momentum in radiative zones (νadd). Right: Rotational splittingsν for modes of a dipole forest corresponding to the same models of KIC 8366239. The horizontal dashed-dotted line indicates the mean value of the splittings for modes at the center of the dipole forests observed in KIC 8366239 [36].
The measurements of rotational splittings for mixed modes in red giants can strongly constrain the efficiency of this unknown additional physical process for the internal transport of angular momentum. This is illustrated in Fig.8, which shows the rotation profile and the corresponding rotational splittings for three models of the red giant KIC 8366239 computed with two values of the initial velocity on the ZAMS and of the viscosity associated to the additional process. This viscosity is simply assumed to be constant. To correctly reproduce the observed splittings, a viscosityνadd=3×104cm2s−1 is then
Ageing Low Mass Stars: From Red Giants to White Dwarfs
4. CONCLUSION
We have first briefly discussed some effects of rotation on the global properties and internal structure of low-mass stars from the pre-main sequence to the red-giant stage. By comparing models including shellular rotation to observations available for low-mass stars, we have seen that an unknown mechanism for the internal angular momentum transport seems to be missing during the main-sequence and post-main sequence evolution. This shows that we are still far from having a good understanding of the complex dynamical processes at work in stellar interiors. Asteroseismic measurements can bring us valuable observational constraints in this context and will help us progress in the modelling of these physical processes.
References
[1] Maeder, A. & Meynet, G. Reviews of Modern Physics 84, 25 (2012) [2] Zahn, J.-P. A&A 265, 115 (1992)
[3] Eggenberger, P., Meynet, G., Maeder, A., et al. Ap&SS 316, 43 (2008)
[4] Eggenberger, P., Haemmerlé, L., Meynet, G., & Maeder, A. A&A 539, A70 (2012) [5] Soderblom, D.R., Jones, B.F., Balachandran, S., et al. AJ 106, 1059 1993
[6] Israelian, G., Delgado Mena, E., Santos, N.C., et al. Nature 462, 189 (2009) [7] Baumann, P., Ramírez, I., Meléndez, J., Asplund, M. A&A 519, A87 (2010) [8] Eggenberger, P., Meynet, G., Maeder, A., et al. A&A 519, A116 (2010) [9] Lagarde, N., Decressin, T., Charbonnel, C., et al. A&A 543, A108 (2012) [10] Eggenberger, P., Miglio, A., Montalban, J., et al. A&A 509, A72 (2010) [11] Irwin, J., Hodgkin, S., Aigrain, S., et al. MNRAS 377, 741 (2007) [12] Bouvier, J. A&A 489, L53 (2008)
[13] Denissenkov, P.A., Pinsonneault, M., Terndrup, D.M., & Newsham, G. ApJ 716, 1269 (2010) [14] Denissenkov, P.A. ApJ 719, 28 (2010)
[15] Eggenberger, P., Maeder, A., & Meynet, G. A&A 519, L2 (2010)
[16] Brown, T.M., Christensen-Dalsgaard, J., Dziembowski, W.A., et al. ApJ 343, 526 (1989) [17] Elsworth, Y., Howe, R., Isaak, G.R., et al. Nature 376, 669 (1995)
[18] Kosovichev, A.G., Schou, J., Scherrer, P.H., et al. Sol. Phys. 170, 43 (1997) [19] Couvidat, S., García, R.A., Turck-Chièze, S., et al. ApJ 597, L77 (2003) [20] García, R.A., Turck-Chièze, S., Jiménez-Reyes, S.J. Science 316, 1591 (2007) [21] Pinsonneault, M.H., Kawaler, S.D., Sofia, S., & Demarque, P. ApJ 338, 424 (1989) [22] Chaboyer, B., Demarque, P., & Pinsonneault, M.H. ApJ 441, 865 (1995)
[23] Eggenberger, P., Maeder, A., & Meynet, G. A&A 440, L9 (2005)
[24] Turck-Chièze, S., Palacios, A., Marques, J.P., & Nghiem, P.A.P. ApJ 715, 1539 (2010) [25] Spruit, H.C. A&A 381, 923 (2002)
[26] Zahn, J.-P., Brun, A.S., & Mathis, S. A&A 474, 145 (2007)
[27] Bedding, T.R. & Kjeldsen, H. in Astronomical Society of the Pacific Conference Series, 14th Cambridge Workshop on Cool Stars, Stellar Systems, and the Sun, ed. G. van Belle 384, 21 (2008)
[28] Frandsen, S., Carrier, F., Aerts, C., et al. A&A 394, L5 (2002)
[29] Barban, C., de Ridder, J., Mazumdar, A., et al. in ESA Special Publication, SOHO 14 Helio- and Asteroseismology: Towards a Golden Future, ed. D. Danesy 559, 113 (2004)
[30] Barban, C., Matthews, J.M., de Ridder, J., et al. A&A 468, 1033 (2007) [31] De Ridder, J., Barban, C., Carrier, F., et al. A&A 448, 689 (2006)