Published online25 April 2002
Colour and luminance interactions in the visual
perception of motion
Alexandra Willis
1*and Stephen J. Anderson
21School of Psychology and Sociology, Napier University, Craighouse Road, Edinburgh EH10 5LG, UK
2Neurosciences Research Institute, School of Life and Health Sciences, Aston University, Birmingham B4 7ET, UK
We sought to determine the extent to which red–green, colour-opponent mechanisms in the human visual system play a role in the perception of drifting luminance-modulated targets. Contrast sensitivity for the directional discrimination of drifting luminance-modulated (yellow–black) test sinusoids was measured following adaptation to isoluminant red–green sinusoids drifting in either the same or opposite direction. When the test and adapt stimuli drifted in the same direction, large sensitivity losses were evident at all test temporal frequencies employed (1–16 Hz). The magnitude of the loss was independent of temporal frequency. When adapt and test stimuli drifted in opposing directions, large sensitivity losses were evident at lower temporal frequencies (1–4 Hz) and declined with increasing temporal frequency. Control studies showed that this temporal-frequency-dependent effect could not reflect the activity of achromatic units. Our results provide evidence that chromatic mechanisms contribute to the perception of luminance-modu-lated motion targets drifting at speeds of up to at least 32°s⫺1. We argue that such mechanisms most probably lie within a parvocellular-dominated cortical visual pathway, sensitive to both chromatic and luminance modulation, but only weakly selective for the direction of stimulus motion.
Keywords:vision; motion; colour; luminance; parvocellular; magnocellular
1. INTRODUCTION
A wealth of physiological and psychophysical evidence suggests that different aspects of a visual scene, such as colour, brightness and motion, are represented separately in the primate visual system (e.g. Thorellet al.1984; Liv-ingstone & Hubel 1988; Lee et al. 1989). However, the extent to which these features remain independent during the early stages of visual processing remains controversial. Nowhere, perhaps, is such controversy more evident than in the relationship between colour- (specifically, red– green) and luminance-sensitive mechanisms in the analy-sis of motion targets.
A number of studies (e.g. Cavanaghet al.1984; Cavanagh & Favreau 1985; Derrington & Badcock 1985; Mullen & Baker 1985; Cavanagh & Anstis 1991; Dobkins & Albright 1993) have shown that colour and luminance cues can interact in the analysis of moving patterns. Adaptation to a drifting, isoluminant, red–green grating, for example, often results in a motion after-effect on stationary luminance-modulated gratings, and the converse (Cavanagh & Favreau 1985; Derrington & Badcock 1985; Mullen & Baker 1985). Further, adding an isoluminant red–green grating to a high-contrast luminance grating reduces the perceived velocity of the luminance grating (Cavanaghet al.1984), even though the addition of the chromatic pat-tern does not alter the contrast of the luminance grating. Masking studies, however, have generally not lent sup-port to the view that colour and luminance signals interact in the perception of stimulus motion. Cropper & Derring-ton (1996), for example, reported that luminance-modu-lated mask gratings had little effect on the detection of short-duration chromatic motion targets and concluded
*Author for correspondence ([email protected]).
Proc. R. Soc. Lond.B (2002)269, 1011–1016 1011 2002 The Royal Society
that chromatic and luminance mechanisms did not inter-act at an early stage of motion processing. Yoshizawa et al.(2000) did report an effect of luminance masks on the perception of motion of Gabor kinematograms under cer-tain conditions; however, the authors attributed their fin-dings to the presence of dynamic luminance artefacts rather than the activity of a mechanism conveying both chromatic and luminance information.
We have previously argued that the perception of motion of red–green chromatic gratings is underpinned by colour-opponent visual channels exhibiting only weak sel-ectivity for direction of motion (Willis & Anderson 1998). Here, we explore the extent to which colour-sensitive channels contribute to the perception of visual targets cur-rently thought to be processed almost exclusively within motion-specialized visual mechanisms highly sensitive to luminance contrast: namely, of low spatial frequency and low contrast, luminance-modulated gratings drifting at mid to high velocities (Maunsell & Van Essen 1983; Merigan & Maunsell 1990).
2. GENERAL METHODS
The general method was to measure contrast sensitivity for the direction discrimination of drifting luminance-modulated gratings following adaptation to a red–green grating of similar spatial frequency and orientation, or a blank screen of the same mean hue (i.e. yellow) and luminance (see § 4). As a control, sensitivity was measured following adaptation to a low-contrast luminance-modulated grating (see § 5). Techniques used to establish the perceptual isoluminant point for each observer are described in § 3.
(a) Stimuli
Sinusoidal gratings were generated using a Cambridge Research Systems VSG2/2 waveform generator with 14-bit DACs, and displayed on a gamma-corrected Eizo Flexscan T560i 15 inch colour monitor. Stimuli were presented at an interleaved frame rate of 120 Hz using a standard raster tech-nique. The resolution of the display, which subtended 18.5° horizontally by 13.8°vertically at a viewing distance of 1 m, was 720 pixels by 534 lines. Stimuli were presented within a square patch of 4.9°height, the sharp edges of which were attenuated using a cosine ramp of 0.75° width, and the area around the stimulus patch was black.
Horizontal red and green luminance-modulated sinusoids were generated independently and added 180°out of phase to produce a red–green sinusoidal grating. Monochromatic (yellow–black) luminance gratings of the same mean hue and luminance as the chromatic grating were produced by adding the red and green sinusoidal gratings in spatial phase. The component gratings were described by
L(x,t)=Lmean⫹A×sin(2(fx⫹gt)), (2.1)
where x is space, t is time, Lmean is the mean luminance
(14 cd m⫺2), A is amplitude, f is the spatial frequency
(0.125–4.0 cycles deg⫺1) andgis the drift temporal frequency
(1–16 Hz). The stimuli were curtailed in time using a rectangular temporal envelope of 500 ms duration.
The blue gun was switched off for the duration of the experi-ments. Comite´ Internationale de l’E´ clairage (CIE) coordinates for the red (RX=0.594; RY=0.356) and green (GX=0.294; GY=0.573) guns were measured with a Bentham M300 EA
mono-chromator (1992). Calibration studies showed that the phosphor chromaticity for each gun remained stable for at least 2 h, beginning 10 min after switching the monitor on. Experi-mental measures for a given session were always completed within this 2 h time-window.
(i) Chromatic contrast
Chromatic contrast was defined as the Michelson contrast {(Lmax–Lmin)/(Lmax⫹Lmin)} of either the red–black or the
green–black component sinusoids, which were always equal (see Mullen 1985). The gamma-corrected display was linear to 95% contrast, a value which was not exceeded. The red–green ratio (r) of the compound grating could be altered by varying the mean luminances of the red–black and green–black sinusoids independently:
r=Ramp/(Ramp⫹Gamp), (2.2)
whereRampandGampare the amplitudes of the red and green
luminance-modulated sinusoids, respectively.
(b) Observers
Two experienced observers (A.W. and S.J.A.—the authors), took part. S.J.A. is mildly astigmatic with a corrected Snellen acuity of 6/5 and A.W. is emmetropic with an acuity of 6/5. Selected measures were repeated for one naive observer ( J.P.), an emmetrope with a visual acuity of 6/6. All had full visual fields, performed normally on the Farnsworth–Munsell 100-hue test (A.W. and S.J.A.) or Ishihara colour plates ( J.P.), and had no history of ocular disease.
(c) Procedures
Procedural details specific to each experiment are outlined in the relevant sections. For all experiments the display was viewed monocularly with the observer’s dominant eye, the other eye being occluded using a translucent patch. The observer’s head was stabilized using a chin and forehead rest at a viewing dis-tance of 1 m.
(i) Contrast sensitivity
Stimulus contrast was varied to threshold using a three-up, one-down staircase procedure, converging to a performance level of 79%. Prior to the staircase, contrast was adjusted from a supra-threshold value to near threshold using method of adjustment (MOA). This value was used as the initial contrast of the grating for the staircase procedure. Each stimulus trial was accompanied by an audible tone, and no feedback was given. The step size for the staircase was 1 decibel and six rever-sals were averaged to estimate contrast threshold. The mean of at least two staircase runs was calculated for each observer.
3. CONTROL EXPERIMENTS
The intrusion of luminance artefacts within chromatic gratings presents obvious problems for the effective iso-lation of a colour-opponent pathway. In this study, trans-verse and longitudinal chromatic aberrations were minimized using horizontal gratings of low spatial fre-quency and central fixation. The use of a prominent fix-ation target and short viewing distance (1 m) minimized luminance contrast intrusions generated by eye move-ments and changes in accommodation.
(a) Establishing perceptual isoluminance
The mean isoluminant point was established using the criterion of minimum perceptual flicker. The grating counterphased at 16 Hz and had a chromatic contrast of 90%. The value ofrwas 0.45 for A.W. and 0.49 for S.J.A., and did not vary significantly over the range 0.25–2 cycles deg⫺1. All the adaptation experiments were com-pleted using theservalues. We confirmed that these values did not differ significantly from those established by means of the minimum contrast sensitivity criterion (Mullen 1985), which demonstrated that the perceptual isolumin-ant point for drifting chromatic gratings is independent of drift temporal frequency for drift rates of 8 Hz and below.
(b) Temporal processing delays
et al.1995). For a fixed temporal delay, the magnitude of the perceived spatial phase offset will increase pro-portionally with increasing drift temporal frequency. Here, we assess this possibility.
(i) Methods
The stimulus was a high-contrast (90%), 1 cycle deg⫺1 red–green grating, either stationary or drifting upwards at 2, 4 or 8 Hz. The red–green luminance ratio (r) of the grating was set at the observer’s isoluminant point, determined using the technique of minimum flicker. Observers used MOA to alter the relative spatial phase of the red–black and green–black component sinusoids until the compound waveform appeared as an isoluminant red– green grating. As the discrimination of small phase differ-ences is notoriously difficult, the stimulus was displayed continuously and large (45°) abrupt changes in phase were used. To ensure that this measure was robust, the phase of each component was randomized at the start of each trial, and the mean phase offset was calculated from a large number (50) of trials.
(ii) Results
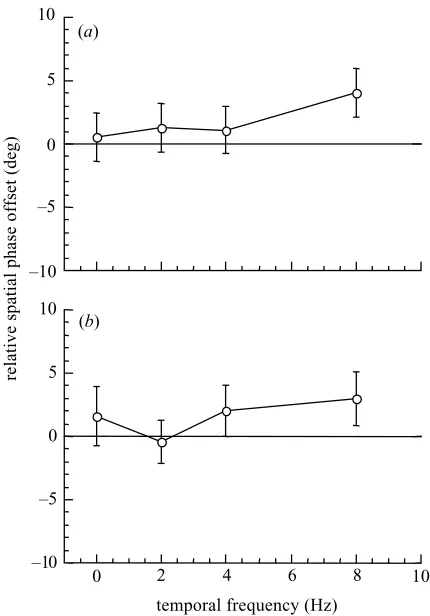
Figure 1 shows the mean spatial phase offset between the red–black and green–black component sinusoids required to perceive the stimulus as an isoluminant red– green sinusoid, plotted as a function of drift temporal fre-quency. A phase offset of zero indicates that the red–black and green–black components were in spatial antiphase. Positive values indicate that the red–black component was phase advanced relative to the green–black component in the direction of stimulus motion (upwards). Conversely, negative values indicate that the red–black component is phase delayed relative to the green–black component.
Note that for both observers, small (less than 5°) posi-tive phase offsets were required in order to perceive the compound waveform as a red–green grating. For stimulus temporal frequencies less than or equal to 4 Hz, the meas-ured spatial phase offsets were not significantly different from zero. However, a larger phase offset was evident for stimulus drift rates of 8 Hz, indicating that luminance contrast may appear in red–green gratings drifting at fre-quencies greater than 4 Hz. For this reason, the maximum drift temporal frequency used for chromatic stimuli in all subsequent experiments was 4 Hz.
4. ADAPTATION TO RED–GREEN GRATINGS
Next, we measured the effects of adaptation to isolum-inant, red–green gratings on subsequent contrast sensi-tivity for drifting, luminance-modulated gratings.
(a) Methods
The ‘adapt’ stimulus was a high-contrast (90%), hori-zontal, red–green grating of spatial frequency 0.25, 0.5, 1 or 2 cycles deg⫺1, drifting upwards with a temporal fre-quency of 1 or 4 Hz. The red–green luminance ratio (r) of the grating was set at the observer’s isoluminant point. The adapt stimulus for the control condition was a blank field of the same mean hue and luminance as the red– green grating. The ‘test’ stimulus was a yellow–black lum-inance-modulated grating matched in spatial frequency
–10 –5 0 5 10
–10 –5 0 5 10
relative spatial phase offset (deg)
temporal frequency (Hz)
0 2 4 6 8 10
(a)
(b)
Figure 1. Relative spatial phase offset between the red–black and green–black component sinusoids required for the percept of either a stationary or upwards-drifting red–green waveform, of 1 cycle deg⫺1. A phase offset of 0°indicates that the red–black and green–black components were in spatial antiphase. Positive values indicate that the red–black component is phase advanced relative to the green–black component; negative values indicate that the red–black component is phase delayed relative to the green–black component. Results are plotted as a function of drift temporal frequency of the test for observers (a) A.W. and (b) S.J.A. Each datum is the mean of 50 stimulus trials. The vertical error bars indicate±1 s.e.m.
and orientation to those of the adapt stimulus. The tem-poral frequency of the adapt stimulus was matched to that of the test stimulus for drift rates of 1 and 4 Hz, and fixed at 4 Hz for higher test temporal frequencies.
A steady state of adaptation was effected during an initial adaptation period of 60 s, and subsequently main-tained by alternating shorter presentations of the adapt stimulus (4 s) with presentations of the test stimulus (500 ms). Contrast sensitivity for the directional discrimi-nation of gratings drifting in the same direction as the adapt stimulus and in the opposite direction were calcu-lated independently using two interleaved staircases. Sen-sitivity for upwards- and downwards-drifting targets were averaged for the control condition, following adaptation to a blank yellow field.
(b) Results
10 100 1000
10 100 1000
0.1 1 10 0.1 1 10
(a) (b)
(c) (d)
spatial frequency (cycle deg–1)
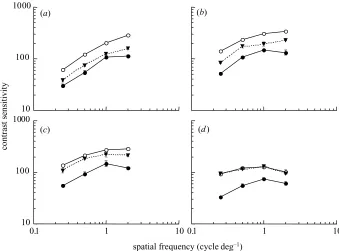
contrast sensitivity
Figure 2. Contrast sensitivity for the directional discrimination of luminance-modulated gratings following adaptation to a blank yellow field (open symbols) or isoluminant red–green gratings (filled symbols) for observer A.W. Sensitivity is shown for gratings drifting in the same direction as the adapt stimulus (circles) or in the opposite direction (triangles). Data are shown for test temporal frequencies of (a) 1 Hz, (b) 4 Hz, (c) 8 Hz and (d) 16 Hz. Vertical bars indicate±1 s.e.m.
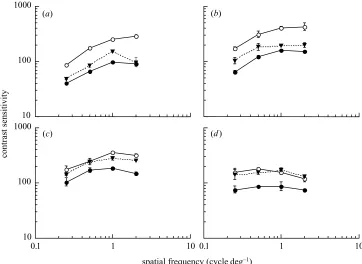
the same direction as the adapt stimulus (circles) or in the opposite direction (triangles) as a function of stimulus spatial frequency. Results for S.J.A. are shown in figure 3. Adaptation to red–green gratings was associated with marked reductions in contrast sensitivity for luminance test gratings drifting in the same direction as the adapt stimulus (compare open and filled circles in figures 2 and 3). The magnitude of the adaptation effect was largely independent of both the spatial and temporal frequency of the test, and was similar for both observers.
Chromatic pattern adaptation also resulted in decreased sensitivity for luminance-modulated stimuli drifting in the opposite direction. The adaptation effect was largely inde-pendent of stimulus spatial frequency. However, the ‘opposite direction’ adaptation effect decreased with increasing temporal frequency of the test, reducing to zero at 16 Hz (compare open circles with filled triangles in fig-ures 2 and 3).
5. ADAPTATION TO LOW-CONTRAST LUMINANCE GRATINGS
The aim of this experiment was to determine the extent to which the effects of adaptation to red–green gratings in the previous experiment, particularly great at drift rates of 1 and 4 Hz, could be explained by adaptation to any residual luminance contrast in the chromatic stimulus. At low spatial frequencies, the luminance contrast introduced into red–green gratings by chromatic aberrations typically falls below detection threshold (Flitcroft 1989; Dobkins & Albright 1994). This section reports the effects of adap-tation to luminance-modulated gratings, the contrast of which was at least three times above that needed for their detection, on contrast sensitivity for the directional dis-crimination of luminance-modulated targets.
(a) Methods
The methods were identical to those used in the pre-vious experiment except that both the adapt and test stim-uli were luminance-modulated (yellow–black) sinusoidal gratings. The temporal frequency of the test grating (1 or 4 Hz) was matched to that of the adapt stimulus. The luminance contrast of the adapt grating was 3%.
(b) Results
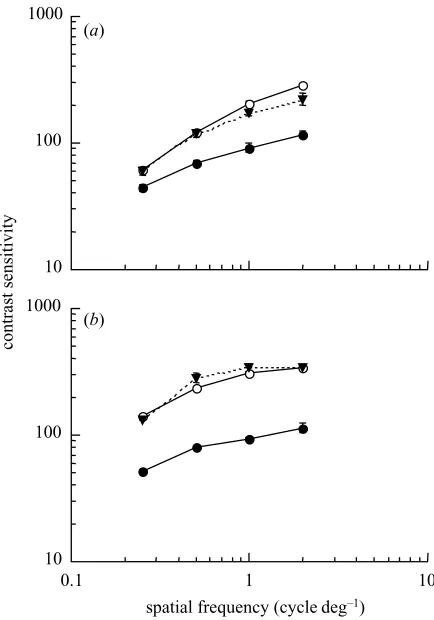
Figure 4 shows contrast sensitivity for the directional discrimination of luminance-modulated targets as a func-tion of spatial frequency following adaptafunc-tion to a blank field (open symbols) or to low-contrast luminance gratings (filled symbols). Results are shown for test gratings drift-ing in the same direction as the adapt stimulus (circles) and in the opposite direction (triangles). As with adap-tation to red–green gratings, adapadap-tation to low-contrast luminance gratings resulted in decreased contrast sensi-tivity for the directional discrimination of stimuli drifting in the same direction as the adapt stimulus. However, unlike chromatic pattern adaptation, adaptation to low-contrast luminance gratings had no effect on low-contrast sen-sitivity for test gratings drifting in the opposite direction to the adapt stimulus.
6. DISCUSSION
adap-10 100 1000
10 100 1000
0.1 1 10 0.1 1 10
spatial frequency (cycle deg–1)
contrast sensitivity
(a) (b)
(c) (d)
Figure 3. Contrast sensitivity for the directional discrimination of luminance-modulated gratings following adaptation to a blank yellow field (open symbols) or isoluminant red–green gratings (filled symbols) for observer S.J.A. Sensitivity is shown for gratings drifting in the same direction as the adapt stimulus (circles) or in the opposite direction (triangles). Data are shown for test temporal frequencies of (a) 1 Hz, (b) 4 Hz, (c) 8 Hz and (d) 16 Hz. Vertical bars indicate±1 s.e.m.
tation effect is critically dependent on temporal frequency, the magnitude of the non-directionally specific adaptation being greatest for temporal frequencies less than or equal to 16 deg s⫺1 (4 Hz) and minimal or non-existent for fre-quencies more than or equal to 32 deg s⫺1 (8 Hz).
Control experiments showed that the effects of cross-adaptation could not be explained by the introduction of phase lags between the red and green cones (figure 1), nor the intrusion of effective luminance contrast in the chromatic adapt grating arising by any other means (figure 4). How, then, may these results be explained?
The effects of adaptation to targets drifting in the same direction as the adapt stimulus could be mediated by a directionally selective mechanism sensitive to luminance contrast and with some capacity to signal changes in the hue of visual targets. The physiological substrate of such a mechanism would most probably include the motion-specialized middle temporal cortical visual area (MT), which contains some neurons that respond to drifting chromatic targets, providing the chromatic contrast is high (Saitoet al.1989; Dobkins & Albright 1994; Gegenfurtner
et al. 1994). However, the responses of such neurons to drifting chromatic targets are invariably highly specific for direction of motion (Saitoet al.1989; Gegenfurtneret al.
1994): as such, they are unlikely to contribute to the non-directionally specific adaptation effects reported here.
The non-directionally specific cross-adaptation effect can only be explained by the activity of a visual pathway sensitive to both chromatic and luminance information, and with a small degree of direction selectivity. Such properties are consistent with the known properties of neurons within parvocellular (P)-dominant regions of the lateral geniculate nucleus (LGN) and visual cortex. First, ‘double duty’ cells, conferring both chromatic opponency
and sensitivity to spatial variations in luminance, are largely restricted to the parvocellular LGN and P-dominated regions within striate cortex (Ingling & Martinez-Uriegas 1983; Rodieck 1991). Second, P cells in the LGN show lower temporal frequency optima and cut-off than other geniculate cells, suggesting that the role of P-driven cortical neurons in the analysis of stimulus motion declines with increasing temporal frequency (Derrington & Lennie 1984; Leeet al.1989). Third, the mean direc-tional index of cortical cells receiving solely P input is low (Ferreraet al.1994), suggesting that the P system may be capable of signalling the direction of stimulus motion while maintaining the capacity to respond to motion in any direction (see also Willis & Anderson 1998).
If anything, the effects of adaptation to isoluminant red– green gratings observed here may underestimate the extent of parvocellular involvement in the perception of drifting luminance-modulated gratings. In particular, the activity of a small proportion of P ganglion cells, sensitive only to spatial variations in luminance and corresponding to Wiesel & Hubel’s (1966) ‘type III’ units, would be unaffected by the prolonged viewing of isoluminant red– green targets. As a result, the contribution of a type III parvocellular pathway to the perception of low spatial fre-quency drifting luminance targets remains unknown.
While the full extent of the P system’s role in processing motion information remains unclear, the results reported here provide further evidence that our ability to perceive motion does not rely exclusively on the luminance-sensitive magnocellular pathway. Importantly, the results suggest that ‘double duty’, colour-opponent, P-derived cortical mechanisms, known to play an important role in limiting motion acuity (Andersonet al. 1995; Galvinet al.
10 100 1000
10 100 1000
0.1 1 10
contrast sensitivity
spatial frequency (cycle deg–1)
(a)
(b)
Figure 4. Contrast sensitivity for the directional
discrimination of luminance-modulated gratings following adaptation to a blank yellow field (open symbols) or low-contrast luminance gratings drifting in the same direction as the adapt stimulus (filled circles) or in the opposite direction (filled triangles). Results are shown for test temporal frequencies of (a) 1 Hz and (b) 4 Hz. Vertical bars indicate ±1 s.e.m. Data are plotted for observer A.W.
spatial frequency, drifting luminance-modulated targets drifting at velocities of up to 32°s⫺1.
This work was supported by Fight For Sight, London.
REFERENCES
Anderson, S. J. 1993 Visual processing delays alter the perceived spatial form of moving gratings.Vis. Res.33, 2733–2746. Anderson, S. J., Drasdo, N. & Thompson, C. M. 1995
Parvo-cellular neurones limit motion acuity in human peripheral vision.Proc. R. Soc. Lond.B261, 129–138.
Cavanagh, P. & Anstis, S. 1991 The contribution of color to motion in normal and color-deficient observers.Vis. Res.31, 2109–2148.
Cavanagh, P. & Favreau, O. E. 1985 Color and luminance share a common motion pathway.Vis. Res.25, 1595–1601. Cavanagh, P., Tyler, C. W. & Favreau, O. E. 1984 Perceived velocity of moving chromatic gratings.J. Optical Soc. Am.A
1, 893–899.
Cropper, S. J. & Derrington, A. M. 1996 Rapid colour-specific detection of motion in human vision.Nature379, 72–74. Derrington, A. M. & Badcock, D. R. 1985 The low level
motion system has both chromatic and luminance inputs.
Vis. Res.25, 1879–1884.
Derrington, A. M. & Lennie, P. 1984 Spatial and temporal contrast sensitivities of neurones in lateral geniculate nucleus of macaque.J. Physiol.357, 219–240.
Dobkins, K. R. & Albright, T. D. 1993 What happens if it changes color when it moves? Psychophysical experiments on the nature of chromatic input to motion detectors. Vis. Res.33, 1019–1036.
Dobkins, K. R. & Albright, T. D. 1994 What happens if it changes color when it moves? The nature of chromatic input to macaque visual area MT.J. Neurosci.14, 4854–4870. Ferrera, V. P., Nealey, T. A. & Maunsell, J. H. R. 1994
Responses in macaque visual area V4 following inactivation of the parvocellular and magnocellular LGN pathways. J. Neurosci.14, 2080–2088.
Flitcroft, D. I. 1989 The interactions between chromatic aber-ration, defocus and stimulus chromaticity: implications for visual physiology and colorimetry.Vis. Res.29, 349–360. Galvin, S. J., Williams, D. R. & Coletta, N. J. 1996 The spatial
grain of motion perception in human peripheral vision.Vis. Res.36, 2283–2295.
Gegenfurtner, K. R., Kiper, D. C., Beusmans, J. M. H., Caran-dini, M., Zaidi, Q. & Movshon, J. A. 1994 Chromatic proper-ties of neurons in macaque MT.Vis. Neurosci.11, 455–466. Ingling, C. R. & Martinez-Uriegas, E. 1983 The relationship between spectral sensitivity and spatial sensitivity for the pri-mate r-g X channel.Vis. Res.23, 1495–1500.
Lee, B. B., Martin, P. R. & Valberg, A. 1989 Sensitivity of macaque retinal ganglion cells to chromatic and luminance flicker.J. Physiol.414, 223–243.
Livingstone, M. S. & Hubel, D. H. 1988 Segregation of form, color, movement and depth: anatomy, physiology and per-ception.Science240, 740–749.
Maunsell, J. H. R. & Van Essen, D. C. 1983 Functional properties of neurons in the middle temporal visual area in the macaque monkey. I. Selectivity for stimulus direction, speed and orientation.J. Neurophysiol.49, 1148–1167. Merigan, W. H. & Maunsell, J. H. R. 1990 Macaque vision
after magnocellular lateral geniculate lesions.Vis. Neurosci.
5, 347–352.
Mullen, K. T. 1985 The contrast sensitivity of human colour vision to red–green and blue–yellow chromatic gratings.
J. Physiol.359, 381–400.
Mullen, K. T. & Baker, C. L. 1985 A motion aftereffect from an isoluminant stimulus.Vis. Res.25, 685–688.
Pantle, A. & Sekuler, R. W. 1969 Contrast response of human visual mechanisms sensitive to orientation and direction of motion.Vis. Res.9, 397–406.
Rodieck, R. W. 1991 Which cells code for color?. InFrom pig-ments to perception(ed. A. Valberg & B. B. Lee), pp. 83–94. New York: Plenum.
Saito, H., Tanaka, K., Isono, H., Yasuda, M. & Mikami, A. 1989 Directionally selective response of cells in the middle temporal area (MT) of the macaque monkey to the move-ment of equiluminous opponent color stimuli. Exp. Brain Res.75, 1–14.
Stromeyer, C. F., Kronauer, R. E., Ryu, A., Chaparro, A. & Eskew, R. T. 1995 Contributions of human long-wave and middle-wave cones to motion detection. J. Physiol. 485, 221–243.
Thorell, L. G., DeValois, R. L. & Albrecht, D. G. 1984 Spatial mapping of monkey V1 cells with pure color and luminance stimuli.Vis. Res.24, 751–769.
Wiesel, T. N. & Hubel, D. H. 1966 Spatial and chromatic interactions in the lateral geniculate body of the rhesus mon-key.J. Neurophysiol.29, 1115–1156.
Willis, A. & Anderson, S. J. 1998 Separate colour-opponent mechanisms underlie the detection and discrimination of moving chromatic targets.Proc. R. Soc. Lond.B265, 2435– 2441. (DOI 10.1098/rspb.1998.0595.)