1
Computer Simulation and Neutron Diffraction
Studies of Superionic Fluorides
by Winifred Michaela Jordan
A thesis submitted to the University of London for the
degree of Doctor of Philosophy
Sir Christopher Ingold Laboratories
Department of Chemistry
ProQuest N um ber: 10797804
All rights reserved
INFORMATION TO ALL USERS
The qu ality of this repro d u ctio n is d e p e n d e n t upon the q u ality of the copy subm itted.
In the unlikely e v e n t that the a u th o r did not send a c o m p le te m anuscript and there are missing pages, these will be note d . Also, if m aterial had to be rem oved,
a n o te will in d ica te the deletion.
uest
ProQuest 10797804
Published by ProQuest LLC(2018). C op yrig ht of the Dissertation is held by the Author.
All rights reserved.
This work is protected against unauthorized copying under Title 17, United States C o d e M icroform Edition © ProQuest LLC.
ProQuest LLC.
789 East Eisenhower Parkway P.O. Box 1346
2
Abstract
Computer simulation and neutron diffraction are applied in the evaluation of defect structure, ion dynamics and transport mechanisms in three superionic conductors. The systems studied include the rare earth fluoride, LaF3, and mixed metal fluorides, RbBiF4 and CsPbF3. These
materials have potential uses in a variety of technological applications.
The defect structure and transport properties of mobile F _ ions in, tysonite structured, LaF3 are analysed by extensive static and dynamic computer modelling studies. One consistent structural terminology is established across the literature. The static technique yields information on defect formation and migration for jumps between and within different F- sub-lattices. Anion-Frenkel pairs are identified as the intrinsic defects, with vacancies forming preferentially on one sub-lattice. The stability of neutral, bound Schottky quartets is also predicted. Calculated activation energies indicate preferred F- ion mobility in the horizontal a-b plane, although experiment points to motion in the vertical direction. Dopant studies reveal a dependency on the type of vacancy site and the radius of the dopant species, M2+, for the formation of nn or nnn configurational clusters. Calculated elastic constants are compatible with experimental values.
Molecular dynamics is used to provide structural and dynamical information at elevated temperatures. The presence of Frenkel disorder and high levels of anion diffusion are confirmed. Anisotropic mobilities are calculated. In addition, graphical representations of F- ion trajectories provide the first detailed insight into ion transport in superionic LaF3.
Neutron diffraction methods are used to explore the defect structures of RbBiF4 and CsPbF3. RbBiF4 has the fluorite structure and is a good F‘ ion conductor at moderate temperatures. Refinement of powder diffraction data for the highly conducting y-phase produces an improved R factor in comparison with previous studies. A high level of intrinsic disorder is observed with two possible interstitial sites identified. CsPbF3 is an ionically conducting fluoride perovskite at temperatures well below its melting point. Analysis of powder diffraction data, collected over several temperatures, reveals some interstitial features, but shows no evidence of
To my parents Margaret and Ken Jordan;
4
Acknowledgements
Firstly, I would like to thank my supervisor, Professor C. R. A. Catlow, for his guidance and encouragement during the course of this work.
Thanks are also due to my colleagues Drs. Andy Murray and Andy Fitch at University College London and University of Keele, respectively, and to my other friends: Fiona Sim, Paul Cox, Saiful Islam, Rob. Jackson, Frank Beech, Behnam Vessal, Mark Doherty, Simon Tomlinson and Clive Freeman, whose companionship made my time at UCL memorable. Thanks are also due to staff at UCL and Keele computer centres, especially Mr. Keith Robinson and Dr. Paul Collis.
For useful discussions and assistance in the provision of facilities at their various institutions, I extend my thanks to: Dr. Alan Chadwick and Professor John Strange at the University of Kent; Dr. Maurice Leslie at Daresbury Laboratory; Dr. Alan Hewat and Dr. Jeremy Cockcroft at ILL, Grenoble; and Dr. Bill David and Dr. Bill Harrison at the Rutherford Appleton Laboratory.
I would also like to thank Professor M. L. McGlashan for providing facilities in the Chemistry Department at University College London, Professor D. J. Millen for his interest, and the Science Faculty for the award of the Catherine Maude Pearce Scholarship. I also thank the S.E.R.C. for their post-graduate award.
5
List of Contents
p a g e
TITLE PAGE 1
ABSTRACT 2
ACKNOWLEDGEMENTS 4
LIST OF CONTENTS 5
LIST OF ILLUSTRATIONS 11
LIST OF TABLES 21
CHAPTER 1 INTRODUCTION 2 5
CHAPTER 2 REVIEW OF SUPERIONIC FLUORIDES 2 8
2.1 In tro d u c tio n 2 8
2 . 2 C o n d u ctivity in Fluorides 3 0
2.3 Ion Transport Physics 31
2.4 E xp erim e ntal T ech niq ues 3 2
2.4.1 X-ray and Neutron Scattering 33
2.4.2 EXAFS 33
2.4.3 Light Scattering 33
2.4.4 Nmr and Other Spectroscopic Techniques 34
2.4.5 Conductivity and Diffusion 35
2.4.6 Calorimetric Studies 35
2.5 F lu o rid e C o n d u cto rs 3 5
2.5.1 Fluorites 35
2.5.2 Anion Excess Fluorites 37
6
List of contents continued page
CHAPTER 3 COMPUTATIONAL AND THEORETICAL METHODS 4 2
3.1 Introduction 4 2
3.2 Aims of Computer Simulation 4 2
3.3 Static Lattice Simulations 4 4
3.3.1 Perfect Lattice 44
3.3.2 Summation Methods 45
3.3.3 Energy Minimisation 46
3.3.4 Minimisation to Constant Volume 48
3.3.5 Lattice Properties 49
3.3.6 Defect Lattice Simulation 50
3.3.7 Defect Codes 53
3.3.8 Reliability of Static Simulation Techniques 53
3.3.9 Static Lattice Simulation of Superionic Conductors 54
3.4 Molecular Dynamics 5 5
3.4.1 The MD Method 55
3.4.2 Initial Conditions 57
3.4.3 Integration Algorithm 58
3.4.4 Periodic Boundary Conditions 59
3.4.5 Calculation of Forces and Energy 60
3.4.6 Analysis of Data 61
3.4.7 Limitations 62
3.4.8 Overview of MD Procedures 63
3.5 Potential Models 6 3
3.5.1 Pair Potentials 64
3.5.2 Ionic Polarisation 65
3.5.3 Polarisation Models 65
3.5.4 Rigid-lon Model 67
3.6 Derivation of Potentials 6 7
3.6.1 Empirical Methods 6 8
7
List of contents continued page
CHAPTER 4 THE STRUCTURE, TRANSPORT PROPERTIES AND
APPLICATIONS OF LaF3 7 0
4.1 Introduction 7 0
4.2 The Structure of the Rare Earth Fluorides 7 1
4.3 The Crystal Structure of LaF3 7 1
4.4 The Transport Properties of LaF3 7 4
4.5 Technological Applications of LaF3 81
CHAPTER 5 A STATIC SIMULATION STUDY OF DEFECTS IN LaF3 9 0
5.1 Introduction 9 0
5.2 Structural Models 91
5.3 Potential Parameters 9 1
5.4 Potential Parameters for Dopant Ions 9 3
5.5 Region Size 9 4
5.6 Term inology 9 5
5.7 Comparison of Datasets: P63cm vs. P3c1 9 5 5.8 Results and Discussion, Part I: Defect Energetics in LaF3 9 6
5.8.1 Intrinsic Defects 96
5.8.2 Isolated Defects 96
5.8.3 Formation of Bound Schottky Quartets 99
5.8.4 Dissociation of Bound Schottky Quartets 102
5.8.5 Conclusions on the Defect Models in LaF3 103
5.8.6 Migration Studies 105
8
List of contents continued page
5.9 Results and Discussion, Part II:
Defect Aggregation Studies in Doped LaF3 1 0 9
5.9.1 Extrinsic Defects 109
5.9.2 Relative Stabilities of M2+ Clusters and Dependency on Size of
Dopant Ion 111
5.9.3 Solution Energies for Alkaline Earth Fluorides in LaF3 114
5.9.4 Relative Stabilities of O2- Clusters 115
5.9.5 Solution Energies for Oxygen Incorporation in LaF3 by
Oxidation or Hydrolysis 116
5.9.6 Conclusions 119
5.10 Results and Discussion, Part III:
Elastic Constant Studies in LaF3 1 1 9
5.10.1 Variation of Elastic Constants with Temperature 119
5.10.2 Method of Calculation 1 2 1
5.10.3 Comparison of Calculated and Experimental Elastic Constants 122
5 .10.4 Conclusions 124
CHAPTER 6 A MOLECULAR DYNAMICS STUDY OF LaF3 1 8 7
6.1 Introduction 1 8 7
6.2 Method of Calculation 1 8 8
6.2 . 1 Interionic Potentials 188
6.2 . 2 Box Size and Geometry 190
6.2.3 Details of Trajectory Calculations 190
6.3 Results I: Diffusion and Conductivity 191
6.3.1 Self-Diffusion Properties 191
6.3.2 Diffusion Constants and Conductivity 192
6.3.3 Thermal Parameters 196
6.4 Results ll: Structural Properties 1 9 7
9
List of contents continued page
6.5 Results III: Ion Transport Mechanisms 1 9 8
6.5.1 Individual Ion Displacements 199
6.6 Analysis of Ion Trajectories 2 0 0
6.6 . 1 Introduction 2 0 0
6.6.2 Ion Trajectories at 1200K 201
6.6.3 ion Trajectories at 1500K 208
6.6.4 ion Trajectories at 1700K 212
6.7 Conclusions 2 1 2
CHAPTER 7 NEUTRON DIFFRACTION METHODS 32 4
7.1 Introduction 3 2 4
7.2 Diffraction Theory 32 4
7.3 Neutron Scattering 3 2 6
7.3.1 Scattering Amplitude 326
7.3.2 Thermal Effects 327
7.3.3 Nuclear Density Distribution 328
7.4 Neutron Diffraction: General Considerations 32 9
7.5 Samples and Environments 3 3 1
7.5.1 Powder Diffraction 331
7.5.2 Constant Wavelength Experiments 332
7.5.3 Time of Flight Method 333
7.5.4 Neutron Detectors 335
7.6 Instrum entation 3 3 6
7.6.1 D1A 336
7.6.2 HRPD 337
7.7 Profile Analysis 3 3 8
7.7.1 Integrated Intensity Method 339
7.7.2 Rietveld Profile Analysis 341
7.7.3 Fourier Analysis 345
7.8 Other Scattering 3 4 6
7.8.1 Diffuse Scattering 346
10
List of contents continued page
CHAPTER8 NEUTRON DIFFRACTION STUDIES OF RbBIF4 3 5 2
8.1 Introduction 3 5 2
8.2 Rbt.xBixF.u2x Systems 35 2
8.3 Sample Preparation 35 4
8.4 Experimental Procedures 35 5
8.5 Structural Refinements and Results 3 5 6
8.5.1 High Temperature (420°C) 356
8.5.2 Room Temperature 358
8.6 Discussion 3 5 8
8.7 Conclusions 3 5 9
CHAPTER9 NEUTRON DIFFRACTION STUDIES OF CsPbF3 38 1
9.1 Introduction 38 1
9.2 The Perovskite Structure 38 1
9.3 Studies of Ionic Motion in Fluoride Perovskites 38 2
9.4 Sample Preparation 3 8 4
9.5 Experimental Procedures 3 8 4
9.6 Data Processing 38 5
9.7 Results and Discussion of Structural Refinements 3 8 6
9.8 Conclusions 38 9
CHAPTER 10 SUMMARY OF CONCLUSIONS AND RECOMMENDATIONS 4 3 0
APPENDICES 4 3 4
I Bom-Haber Lattice Energy Calculation for LaF3 434
II Calculation of Schottky Formation Energies 436
III Calculated Solution Energies at Infinite Dilution of
Alkaline Earth Fluorides in LaF3 437
List of Illustrations
page CHAPTER 2
2.1 Interstitial-vacancy complex for high-temperature fluorites. 40
2.2 Dopant-interstitial clusters in doped CaF2 (a) 2:2:2 cluster (b) 4:3:2 cluster. 41
2.3 Cubo-octahedral dopant-interstitial cluster. 41
CHAPTER 4
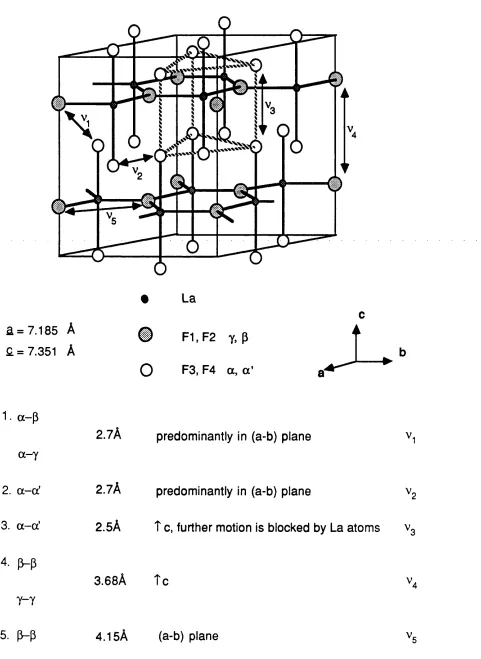
4.1 Crystal structure of LaF3 and possible defect jumps. 85
4.2 Coordination sphere of lanthanum atom in P63CIT1. 8 6
4.3 Coordination sphere of lanthanum atom in P3c1. 8 6
4.4 The bulk ionic conductivity of pure LaF3 and of several La-|.xBaxF3.x solid solutions. 87
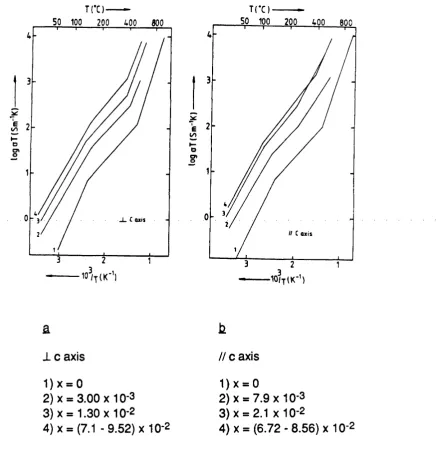
4.5 The bulk ionic conductivity of LaF3 // and 1 to the c axis. 8 8
4.6 Proposed models for LaF3. 89
CHAPTER 5
5.1 Short-range potential for La3+ - F- interaction. 163
5.2 Short-range potential for La3+ - La3+ interaction. 164
5.3 Short-range potential for F" - F' interaction. 165
5.4 Variation of vacancy formation energy with size of region I: F1. 166
5.5 Variation of vacancy formation energy with size of region I: F2. 166
5.6 Variation of vacancy formation energy with size of region I: F3. 166
5.7 Variation of vacancy formation energy with size of region I: F4. 166
5.8 Variation of F‘ interstitial formation energy with size of region I. 167
5.9 Variation of vacancy formation energy with reciprocal N. Site: F1. 168
5.10 Variation of vacancy formation energy with reciprocal N. Site: F2. 168
5.11 Variation of vacancy formation energy with reciprocal N. Site: F3. 168
12
List of illustrations continued page
5.13 Variation of interstitial formation energy with reciprocal N. Site: 1. 169
5.14 Plan view of unit cell of LaF3: P6 3cm. 170
5.15 Plan view of unit cell of LaF3 : P3c1. 170
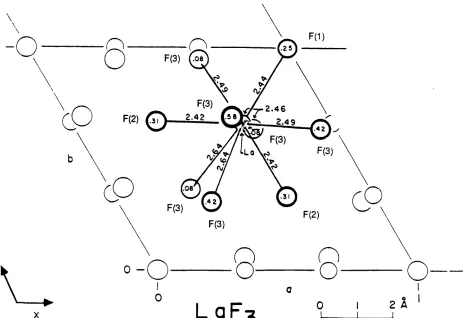
5.16 Distribution of F* ions around a central La3+ ion. 171
5.17 Calculation of activation energy for anion vacancy migration. 172
5.18 Crystal structure of LaF3 and possible defect jumps. 173
5.19 Migration 1: migration pathway between p - p sites //c. 174
5.20 Migration 2: migration pathway between y - y sites //c. 174
5.21 Migration 5: migration pathway between a - a' sites in c direction. 175
5.22 Migration 6: migration pathway between a - a' sites. 175
5.23 Migration 7: migration pathway between a' - a sites. 175
5.24 Migration 8: migration pathway between a - p sites. 176
5.25 Migration 9: migration pathway between a' - p sites. 176
5.26 Migration 1 1: migration pathway between y - a sites. 176
5.27 Migration 12: migration pathway between y -a sites. 176
5.28 Migration 13: migration pathway between y - a' sites. 177
5.29 Variation of binding energies for nn M2+ clusters with ionic radius of dopant
species where the vacancy is on an F1 site. 178
5.30 Variation of binding energies for nn M2+ clusters with ionic radius of dopant
species where the vacancy is on an F2 site. 178
5.31 Variation of binding energies for nn M2+ clusters with ionic radius of dopant
species where the vacancy is on an F3 site. 178
5.32 Variation of binding energies for nn M2+ clusters with ionic radius of dopant
species where the vacancy is on an F4 site. 178
5.33 Variation of binding energies for nnn M2+ clusters with ionic radius of dopant
species where the vacancy is on an F1 site. 179
5.34 Variation of binding energies for nnn M2+ clusters with ionic radius of dopant
13
List of illustrations continued p ag e
5.35 Variation of binding energies for nnn M2+ clusters with ionic radius of
dopant species where the vacancy is on an F3 site. 179
5.36 Variation of binding energies for nnn M2+ clusters with ionic radius of
dopant species where the vacancy is on an F4 site. 179
5.37 Expansion coefficients of LaF3 vs. temperature. 180
5.38 C-j! vs. temperature. 181
5.39 C< |2 vs. temperature. 182
5.40 C-J3 vs. temperature. 183
5.41 C3 3 vs. temperature. 184
5.42 C4 4 vs. temperature. 185
5.43 Cgg vs. temperature. 186
CHAPTER 6
6.1 MSD at 1200K, 1500K and 1700K for lanthanum. 2 2 0
6.2 MSD at 1200K, 1500K and 1700K for fluorine. 2 2 1
6.3 MSD at 1200K, 1500K and 1700K for fluorine in X-Y direction. 2 2 2
6.4 MSD at 1200K, 1500K and 1700K for fluorine in Z direction. 223
6.5.1 RDF La-La at 1200K. 224
6 .5 .2 RDF La-La at 1500K. 225
6 .5 .3 RDF La-La at 1700K. 226
6.6.1 RDF La-F at 1200K. 227
6 .6 .2 RDF La-F at 1500K. 228
6 .6 .3 RDF La-F at 1700K. 229
6.7.1 RDF F-F at 1200K. 230
6 .7 .2 RDF F-F at 1500K. 231
6 .7 .3 RDF F-F at 1700K. 232
6 . 8 Individual ion displacements during 0-1 ps at 1200K. 233
List of illustrations continued
14
p ag e
6.10 Individual ion displacements during 2-3 ps at 200K. 235
6.11 Individual ion displacements during 3-4 ps at 200K. 236
6.12 Individual ion displacements during 4-5 ps at 200K. 237
6.13 Individual ion displacements during 5-6 ps at 200K. 238
6.14 Individual ion displacements during 6-7 ps at 200K. 239
6.15 Individual ion displacements during 7-8 ps at 200K. 240
6.16 individual ion displacements during 8-9 ps at 200K. 241
6.17 Individual ion displacements during 9-10 ps a 1200K. 242
6.18 Individual ion displacements during 0 - 1 ps at 500K. 243
6.19 Individual ion displacements during 1 - 2 ps at 500K. 244
6.20 Individual ion displacements during 2-3 ps at 500K. 245
6.21 Individual ion displacements during 3-4 ps at 500K... 246
6.22 Individual ion displacements during 4-5 ps at 500K. 247
6.23 Individual ion displacements during 5-6 ps at 500K. 248
6.24 Individual ion displacements during 6-7 ps at 500K. 249
6.25 Individual ion displacements during 7-8 ps at 500K. 250
6.26 Individual ion displacements during 8-9 ps at 500K. 251
6.27 Individual ion displacements during 9-10 ps a 1500K. 252
6.28 Individual ion displacements during 0 - 1 ps at 700K. 253
6.29 Individual ion displacements during 1 - 2 ps at 700K. 254
6.30 Individual ion displacements during 2-3 ps at 700K. 255
6.31 Individual ion displacements during 3-4 ps at 700K. 256
6.32 Individual ion displacements during 4-5 ps at 700K. 257
6.33 Individual ion displacements during 5-6 ps at 700K. 258
6.34 Individual Ion displacements during 6-7 ps at 700K. 259
6.35 Individual ion displacements during 7-8 ps at 700K. 260
6.36 Individual ion displacements during 8-9 ps at 700K. 261
List of illustrations continued
15
page
6.38 Plan diagram showing cell 321 and neighbouring cells at the start of the
equilibration process. 263
16
List of illustrations continued page
6.61 1500K: trajectories of F atoms in cell 321 during 1-2 ps. 292 6.62 1500K: selected trajectories of F atoms in cell 321 during 1-2 ps. 293 6.63 1500K: trajectories of F atoms in cell 321 during 2-3 ps. 294 6.64 1500K: selected trajectories of F atoms in cell 321 during 2-3 ps. 295 6.65 1500K: trajectories of F atoms in cell 321 during 3-4 ps. 296 6.66.1 1500K: selected trajectories of F atoms in cell 321 during 3-4 ps. 297 6.66.2 1500K: selected trajectories of F atoms in cell 321 during 3-4 ps in 3D. 298 6.67 1500K: trajectories of F atoms in cell 321 during 4-5 ps. 299
6 . 6 8 1500K: selected trajectories of F atoms in cell 321 during 4-5 ps. 300
6.69 1500K: trajectories of F atoms in cell 321 during 5-6 ps. 301 6.70.1 1500K: selected trajectories of F atoms in cell 321 during 5-6 ps. 302 6.70.2 1500K; selected trajectories of F atoms in cell 321 during 5-6 ps in 3D... 303 6.71 1500K: trajectories of F atoms in cell 321 during 6-7 ps. 304 6.72 1500K: selected trajectories of F atoms in cell 321 during 6-7 ps. 305 6.73 1500K: trajectories of F atoms in cell 321 during 7-8 ps. 306 6.74.1 1500K: selected trajectories of F atoms in cell 321 during 7-8 ps. 307 6.74.2 1500K: selected trajectories of F atoms in cell 321 during 7-8 ps in 3D. 308 6.75 1500K: trajectories of F atoms in cell 321 during 8-9 ps. 309 6.76.1 1500K: selected trajectories of F atoms in cell 321 during 8-9 ps. 310 6.76.2 1500K: selected trajectories of F atoms in cell 321 during 8-9 ps in 3D. 311 6.77 1500K: trajectories of F atoms in cell 321 during 9-10 ps. 312 6.78 1500K: selected trajectories of F atoms in cell 321 during 9-10 ps. 313
6.79 1700K: trajectories of F atoms in cell 321 during 0-1 ps. 314 6.80 1700K: trajectories of F atoms in cell 321 during 1-2 ps. 315 6.81 1700K: trajectories of F atoms in cell 321 during 2-3 ps. 316 6.82 1700K: trajectories of F atoms in cell 321 during 3-4 ps. 317 6.83 1700K: trajectories of F atoms in cell 321 during 4-5 ps. 318 6.84 1700K: trajectories of F atoms in cell 321 during 5-6 ps. 319 6.85 1700K: trajectories of F atoms in cell 321 during 6-7 ps. 320
17
List of illustrations continued page
6.87 1700K: trajectories of F atoms in cell 321 during 8-9 ps. 322
6 . 8 8 1700K: trajectories of F atoms in cell 321 during 9-10 ps. 323
CHAPTER 7
7.1 Variation of neutron scattering lengths. 347
7.2 The dependence of X-ray and neutron scattering amplitudes on Bragg angle 0. 347 7.3 Scattering into Debye-Scherrer cones by a powder sample. 348 7.4 Spectral distribution of moderated neutrons from a nuclear reactor. 348 7.5 Schematic plan of the high resolution constant wavelength powder
diffractometer, D1A, ILL, Grenoble, France. " 349
7.6 D1A high resolution powder diffractometer, ILL, Grenoble, France. 350
7.7 Schematic plan of HRPD showing beam choppers, curved guide section
and backscattering detectors. 351
CHAPTER 8
8 . 1 Temperature dependence of conductivity for R bi.xBixF1+2x and for RbBi3F i0. 363
8 . 2 Observed neutron powder diffraction profile of RbBiF4 at 420°C on D1A (X=1.95A). 364
8.3 Fourier isoplot of the observed nuclear density of RbBiF4 at 420°C (z=0.00). 365
8.4 Fourier isoplot of the observed nuclear density of RbBiF4 at 420°C (z=0.10). 366
8.5 Fourier isoplot of the observed nuclear density of RbBiF4 at 420°C (z=0.20). 367
8 . 6 Fourier isoplot of the observed nuclear density of RbBiF4 at 420°C (z=0.25). 368
8.7 Fourier isoplot of the observed nuclear density of RbBiF4 at 420°C (z=0.30). 369
8 . 8 Fourier isoplot of the observed nuclear density of RbBiF4 at 420°C (z=0.40). 370
8.9 Fourier isoplot of the observed nuclear density of RbBiF4 at 420°C (z=0.50). 371
8.10 Fourier difference map of RbBiF4 at 420°C (z=0.00). 372
8.11 Fourier difference map of RbBiF4 at 420°C (z=0.10). 373
8.12 Fourier difference map of RbBiF4 at 420°C (z=0.20). 374
8.13 Fourier difference map of RbBiF4 at 420°C (z=0.25). 375
List of Illustrations continued
18 page
8.15 Fourier difference map of RbBiF4 at 420°C (z=0.40). 377
8.16 Fourier difference map of RbBiF4 at 420°C (z=0.50). 378
8.17 Observed neutron powder diffraction profile of RbBiF4 at room temperature
on D1A(X=1.423A). 379
8.18 Crystallographic sites of fluorine atoms in y-RbBiF4 as detected by neutron
diffraction. 380
CHAPTER 9
9.1 Views of the perovskite structure ABX3. 395
9.2 HRPD sample cell. 395
9.3 Raw ToF data for CsPbF3 at 350°C, showing the Bragg peaks superimposed
on the spectral distribution of the incident neutron beam. 396
9.4 Normalised profile of observed ToF data for CsPbF3 at 25°C. 397
9.5 Normalised profile of observed ToF data for CsPbF3 at 300°C. 398
9.6 Normalised profile of observed ToF data for CsPbF3 at 350°C. 399
9.7 Observed and fitted ToF profiles of CsPbF3 at 25°C for the region
20,000 - 100,000 ps. 400
9.8 Observed and fitted ToF profiles of CsPbF3 at 25°C for the region
35.000- 45,000 ps. 401
9.9 Observed and fitted ToF profiles of CsPbF3 at 25°C for the region
45.000- 50,000 ps. 402
9.10 Observed and fitted ToF profiles of CsPbF3 at 25°C for the region
50.000- 60,000 ps. 403
9.11 Observed and fitted ToF profiles of CsPbF3 at 25°C for the region
80.000 - 85,000 ps. 404
9.12 Observed and fitted ToF profiles of CsPbF3 at 25°C for the region
90.000- 100,000 ps. 405
9.13 Observed and fitted ToF profiles of CsPbF3 at 300°C for the region
List of illustrations continued
19
page
9.14 Observed and fitted ToF profiles of CsPbF3 at 300°C for the region
42.000- 44,000 ps. 407
9.15 Observed and fitted ToF profiles of CsPbF3 at 300°C for the region
50.000- 60,000 ps. 408
9.16 Observed and fitted ToF profiles of CsPbF3 at 300°C for the region
80.000 - 85,000 ps. 409
9.17 Observed and fitted ToF profiles of CsPbF3 at 300°C for the region
93.000 - 97,000 ps. 410
9.18 Observed and fitted ToF profiles of CsPbF3 at 350°C for the region
20.000- 100,000 ps. 411
9.19 Observed and fitted ToF profiles of CsPbF3 at 350°C for the region
42.000- 44,000 ps. 412
9.20 Observed and fitted ToF profiles of CsPbF3 at 350°C for the region
50.000 - 60,000 ps. 413
9.21 Observed and fitted ToF profiles of CsPbF3 at 350°C for the region
80.000 - 85,000 ps. 414
9.22 Observed and fitted ToF profiles of CsPbF3 at 350°C for the region
93.000 - 97,000 ps. 415
9.23 Fourier map of the observed nuclear density of CsPbF3 at 25°C, (z=0.00). 416
9.24 Fourier difference map of CsPbF3 at 25°C, (z=0.00). 417
9.25 Fourier map of the observed nuclear density of CsPbF3 at 25°C, (z=0.50). 418
9.26 Fourier difference map of CsPbF3 at 25°C, (z=0.50). 419
9.27 Fourier map of the observed nuclear density of CsPbF3 at 300°C, (z=0.00). 420
9.28 Fourier difference map of CsPbF3 at 300°C, (z=0.00). 421
9.29 Fourier map of the observed nuclear density of CsPbF3 at 300°C, (z=0.50). 422
9.30 Fourier difference map of CsPbF3 at 300°C, (z=0.50). 423
9.31 Fourier map of the observed nuclear density of CsPbF3 at 300°C, (z=0.25). 424
9.32 Fourier difference map of CsPbF3 at 300°C, (z=0.25). 425
9.33 Fourier map of the observed nuclear density of CsPbF3 at 350°C, (z=0.00). 426
20
List of illustrations continued page
9.35 Fourier map of the observed nuclear density of CsPbF3 at 350°C, (z=0.50). 428
List of Tables
21
page CHAPTER 4
4.1 Proposed space groups for the tysonite structure. 82
4.2 Interatomic distances for LaF3. 83
4.3 Summary of conductivity data for nominally pure LaF3. 84
CHAPTER 5
5.1 Atomic parameters in P6 3cm. 125
5.2 Atomic parameters in P3c1. 125
5.3 Trial LaF3 shell model potential parameters. 126
5.4 Final LaF3 shell model potential parameters. 127
5.5 Comparison of calculated and experimental bulk crystal properties. 128
5.6 Variation of vacancy formation energy with size of region I: F I . 129
5.7 Variation of vacancy formation energy with size of region I: F2. 130
5.8 Variation of vacancy formation energy with size of region I: F3. 131
5.9 Variation of vacancy formation energy with size of region I: F4. 132
5.10 Variation of F* interstitial formation energy with size of region I. 133
5.11 P6 3cm: comparison of coordinates for the relaxed and unrelaxed lattice. . 134
5.12 P3c1: comparison of coordinates for the relaxed and unrelaxed lattice. 135
5.13 P6 3cm: formation energies using the Schottky model. 136
5.14 P6 3cm: formation energies using the Frenkel model. 136
5.15 P3c1: formation energies using the Schottky model. 137
5.16 P3c1: formation energies using the Frenkel model. 137
5.17 Differences in Frenkel pair formation energies between P3c1 and P6 3cm. 138
5.18 P6 3cm: formation energies for bound Schottky quartets. 139
List of tables continued
22
page
5.20 P6 3cm: dissociation energies for bound Schottky quartets forming Schottky
trios. 141
5.21 Migration energies. 142
5.22 Energy profiles along migration pathways. 143
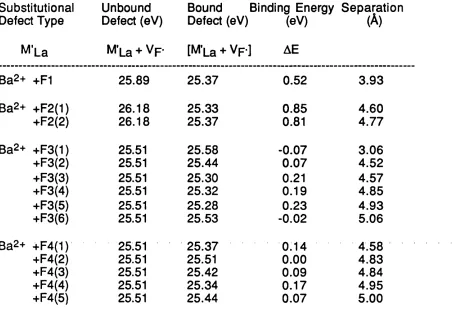
5.23 Formation energies for isolated M2+ substitutionals. 146
5.24 Formation and binding energies for bound defect clusters between an
M2+ substitutional and an F* vacancy in nn configurations. 147
5.25 Formation and binding energies for bound defect clusters between an
M2+ substitutional and an F* vacancy in nnn configurations. 148
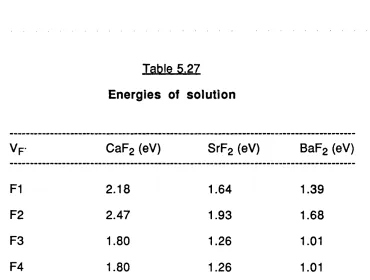
5.26 Lattice energies. 150
5.27 Energies of solution. 150
5.28 Formation energies for isolated O2' substitutionals. 151
5.29 Formation and binding energies for bound defect clusters between an
O2' substitutional and an F* vacancy in nn configurations. 152
5.30 Dissociation energies. 153
5.31 Electron affinities. 154
5.32 Energies of oxidation and hydrolysis reactions. 154
5.33 Lattice contribution to solution energy for oxygen incorporation. 155
5.34 Energies of solution by oxidation and hydrolysis. 156
5.35 Expansion coefficients of LaF3 at 298K and averages over various intervals. 157
5.36 Variation of expansion coefficients with temperature. 157
5.37 Material parameters for LaF3. 158
5.38 Variation of LaF3 elastic constant Ci ■) with temperature. 158
5.39 Variation of LaF3 elastic constant C i2 with temperature. 159
5.40 Variation of LaF3 elastic constant C- |3 with temperature. 159
5.41 Variation of LaF3 elastic constant C3 3 with temperature. 160
5.42 Variation of LaF3 elastic constant C4 4 with temperature. 161
5.43 Variation of LaF3 elastic constant Cg6 with temperature. 161
5.44 Experimental Cjj gradients and changes. 162
23
List of tables continued page
CHAPTER 6
6.1 Rigid-ion potential parameters. 215
6.2 Comparison of calculated and experimental bulk crystal properties. 216
6.3 Details of trajectory calculations. 217
6.4 Diffusion constants and conductivities. 218
6.5 Calculated thermal parameters in superionic LaF3. 219
CHAPTER 8
8.1 Experimental conditions for RbBiF4. 360
8.2 Structural parameters for RbBiF4 at 420°C. 361
8.3 Comparison of observed and calculated intensities and structure factors. 362
CHAPTER 9
9.1 Experimental details. 391
9.2 Refined structural parameters for CsPbF3 at room temperature for the region
20.000 - 100,000 ps. 392
9.3 Refined structural parameters for CsPbF3 at 300°C for the region
20.000 - 100,000 ps. 393
9.4 Refined structural parameters for CsPbF3 at 350°C for the region
24
Let me grow lovely, growing old
-So many fine things do.
Laces and ivory and gold
And silks need not be new;
And there is healing in old trees;
Old streets a glamour hold;
Why may not I, as well as these,
Grow lovely, growing old?
25
Chapter 1
Introduction
Superionic fluorides are an important class of technological materials. If their properties are to be optimised for the design of materials for specific applications e.g. solid state batteries then it is necessary to understand the nature of the defects present, their distributions, interactions and movements. The aim of this work is to develop an understanding of the above properties for three highly conducting fluorides: LaF3, RbBiF4 and C sPbF3 , by applying the techniques of computer simulation and powder
neutron diffraction. References are made to data from other sources, such as conductivity, nmr, EXAFS and Brillouin scattering, where appropriate.
Chapter 2 provides background material on superionic conductors with special emphasis on conductivity in fluorides. There is also a brief description of the defect physics of superionics and a review of some common experimental techniques used in this field. The rest of the thesis divides into two sections. The first, Chapters 3-6, contains details of simulation methods and results from the LaF3 investigation in which they
were applied. The second, Chapters 7-9, discusses neutron diffraction techniques and results derived from their use in the studies of RbBiF4 and CsPbF3.
Chapter 3 describes the theoretical methods of static lattice simulations and molecular dynamics. Both techniques are used to probe the structure and transport properties of LaF3. A section is also included on the
derivation of realistic potentials, the use of which is fundamental to the application of these methods.
Information collected from other studies shows that LaF3 undergoes a
high F' ion conductivity. These and other works are reviewed in Chapter 4, where for the first time one consistent structural terminology has been established. There is, however, no general agreement on the nature of intrinsic defects or on the method of transport through inequivalent sub lattices exhibiting multi-site behaviour. Both of these issues are addressed fully in Chapters 5 and 6.
The results from static lattice calculations for LaF3 are given in three
parts in Chapter 5, together with a description of the potentials used. This is the first comprehensive study of its kind for LaF3 and provides valuable
information on the character of structural and defect properties in this material. In part one, defect formation energies are calculated for a number of defect models, as are activation energies for various F- migration pathways. Part two examines cluster formation in alkaline earth and oxygen doped LaF3 and draws conclusions on the stability of defect configurations
in relation to, for example, the radius of the dopant ion or the method of formation. The final part examines elastic properties and compares them with experimental values derived from Brillouin scattering experiments.
Transport in LaF3 is simulated at three elevated temperatures: 1200K,
1500K and 1700K, using molecular dynamics, and these results are reported in Chapter 6. There are little experimental data available at high temperature because of sample reactivity with the atmosphere. Similarly, there is no previously reported molecular dynamics study of LaF3 at these
27
Chapter 7 provides an overview of Bragg neutron diffraction theory. There is also a description of both diffraction methods used in this work i.e. constant wavelength, CW, and time-of-flight, ToF, methods and their associated instrumentation. Data refinement methods employed, such as integrated intensities, Rietveld profile analysis and Fourier summations, are also reviewed.
Chapter 8 describes the results of a structural investigation of the highly disordered solid solution Rbi_xBixF1+2x at the composition x = 0.5, i.e. RbBiF4. Using D1A at ILL, Grenoble data were collected at high temperature, above the phase transition to the highly conducting fluorite y-phase. The conductivity is strongly composition dependent in this system and decreases for x > 0.5 because of a progressive increase in local ordering on the anion sub-lattice. The aim of this study is to gain a better understanding of the defect models prevailing at the composition yielding the optimum conductivity.
The structural properties of CsPbF3 are analysed in Chapter 9 using
data collected at a series of temperatures on the high resolution powder diffractometer using ToF facilities at the Rutherford Appleton Laboratory, Oxfordshire. CsPbF3 is a fluoride conducting perovskite, but despite
evidence of high conductivities in this class of materials there have been few experimental or theoretical investigations and there has been no clear understanding of how the conductivity arises. The aim of this study is, therefore, to gain an insight into the nature of the defect structure prevailing and to note any significant thermal effects.
Finally, Chapter 10 summarises the overall conclusions and recommendations drawn from this work and assesses the contribution that the three fluorides, LaF3, RbBiF4 and CsPbF3, may make to the field of solid
28
Chapter 2
Review of Superionic Fluorides
2.1 introduction
Solid materials displaying high ionic conductivity comparable to that found in molten salts are known as superionics, fast-ion conductors or solid electrolytes. These materials have a number of technological applications in high energy density solid state batteries, fuel cells, gas sensors and other electrochemical devices. Consequently, for the last 15 years, research has concentrated on understanding the underlying causes and effects of superionicity for the development of improved conducting materials.
Transport is usually associated with defect generation and migration on one ionic sub-lattice, which is supported by a more rigid framework on the other sub-lattice. The disorder is either thermally generated at raised temperatures or induced as charge compensating defects as a consequence of aliovalent doping.
Many different types of superionic are now known ranging from the structurally very simple to the highly complex. A few examples are given below, but for a more comprehensive coverage see Kleitz et al., (1983). They include the following:
♦ Fluorites and their derivatives;
e.g. halide ion conductors: CaF2, PbF2, SrCI2 MF-BiF3 (M=Na,K,Rb,Ag,TI)
29
♦ Ag+/Cu+ conductors
e.g. a-Agl, a-Cul, p-CuCI RbAg4l5
♦ Li+ conductors
e.g. layer compounds: Li3N inverse spinels: Li2MgCI4
♦ Tysonite fluorides and derivatives
e.g. LaF3; (LaF3)-type solid solutions MF2:LnF3 (M=Ca, Sr, Ba or Pb)
♦ Mixed metal fluorides
e.g. perovskites: CsPbF3
♦ Framework conductors with variable stoichiometry
e.g. 1-D tunnel structures: K+-Hollandite K2xMgxTi8_x0 16 2-D layer: Na+-p-alumina (1+x)Na20.11 Al20 3
3-D Nasicon Na1+xZr2SixP3_x0 12
♦ Proton Conductors
e.g. inorganic acids H TaW 04
30
2.2 Conductivity in Fluorides
Solid fluorides might be expected to be amongst the best anionic conductors. A major factor relates to the special nature of the F- ion itself, i.e. its small size and monovalency. Other contributing factors are associated with the type of crystal structure and the characteristics of the binding cation.
Reviews of conduction in ionic fluorides, particularly the comprehensive paper of Reau and Grannec (1985), point to several criteria for the existence of high F- mobilities. One of the factors of importance concerns structures which lead to non-stoichiometry with resultant defects e.g. fluorite, tysonite and YF3 structures. Stoichiometric fluorides with rock salt, rutile or R e 0 3 structures have reduced mobility. A second factor is the
presence of cations which are highly polarisable. For iso-structural fluorides, those where the cation is more polarisable (typically large ions with loosely bound electrons), are also better anion conductors e.g. KF (or RbF) vs. TIF, CaF2 (or SrF2) vs. p-PbF2 and YF3 vs. BiF3. In contrast, since fluorine is the
most electronegative element in the periodic table the fluoride ion has low polarisability.
Coordination numbers, which are low for anions and high for cations are a third consideration. A comparison of conductivity, a, for conductors NaF, CaF2 and LaF3 at certain temperatures reveals the following order:
cNaF < oCaF2 < aLaF3
The respective coordination numbers are:
anion : 6,4,2
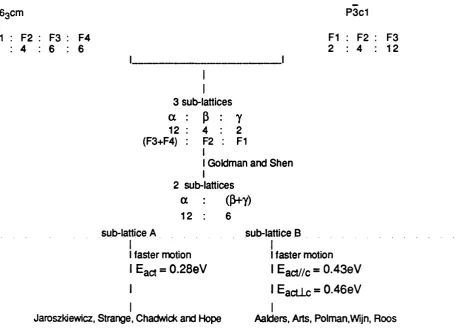
cation : 8,9,11 (9+2 or 10+1 depending on spacegroup P3c1 or P63cm)
31
earth fluorides is greater at a given temperature than in zirconia, which has the higher melting point. The explanation is linked to the lower charge of the
F- ion which reduces the crystal lattice energy and melting point.
All of these factors, when combined, provide the right mix of structural and thermodynamic properties (e.g. low activation energies for migration), thus promoting fast-ion transport in fluorides.
A further consequence of the high electronegativity of fluorine is that most fluorides are electronic insulators with electron localisation and a low energy valence band. Electron activation energies are prohibitive with large band gaps (~12 eV for MgF2) leaving conduction bands empty. This
property is a pre-requisite if fluorides are to be used in battery systems where internal shorting is to be avoided.
2.3 Ion Transport Phvsics
Ion transport in solids is invariably associated with the motion of point defects such as vacancies or interstitials (Lidiard, 1974; Beniere and Catlow, 1983). These can either be produced thermally as intrinsic defects or as charge compensating extrinsic defects in a doped crystal.
32
isolated point defects becomes meaningless as defect interaction leads to the formation of more complex aggregates.
Transport in superionics, with the rapid diffusion of mobile ions through a rigid lattice framework, requires the methodologies of both solid state and liquid physics. The solution must consider many-body interactions between the mobile ions themselves, between the mobile ions and the framework species and any interactions within the framework itself. Several simplified theoretical models have been put forward, e.g. elaborate hopping models, lattice gas models and others as reviewed by Dieterich etal. (1980).
The method which has emerged as the most accurate for modelling 'V
the structural and dynamical complexities of a real system is molecular dynamics. This technique, described more fully in Chapter 3, is ideally suited to studying superionic behaviour because it follows the time evolution of the system in which all degrees of freedom are treated explicitly. A complementary computational technique, also described in Chapter 3, is the static lattice defect simulation method. This calculates formation and migration energies for ionic species and the binding energies between defects or defects and impurities. The information gained from molecular dynamics and supporting methods is useful when interpreting a wealth of data available from experiment. Some of the commonly used experimental techniques are described in the next section.
2.4 Experimental Techniques
33
2.4.1 X-ray and Neutron Scattering
There are different types of defect scattering: first, Bragg scattering which produces a diffraction pattern giving structural information about the average unit cell; second, diffuse scattering which is useful as a probe for short range ordering of defects. It appears as a modulation of the background between Bragg peaks and is more difficult to interpret. A third kind is quasi-elastic scattering and this is used in the study of defect dynamics.
Neutron scattering experiments require the specialist resources of central facilities as at ILL Grenoble, whereas X-ray scattering can be performed in a well equipped laboratory, although as shall be seen below, synchrotron radiation sources provide major advantages.
2.4.2 EXAFS
In contrast to diffraction methods, Extended X-ray Absorption Fine Structure, EXAFS, provides information on the local environment of particular atomic species (Hayes and Boyce, 1983). The technique uses synchrotron radiation and has been used to determine the nature of cluster formation in CaF2 when doped with a range of rare-earths (Catlow et al.,
1984a) and in environment studies for Rb and Bi atoms in RbBiF4 (Cox,
1989).
2.4.3 Light Scattering
Two types of light scattering experiment yield information on lattice vibrations and these may be interpreted in terms of the extent of disorder. The experiments are known as Brillouin and Raman scattering (Kittel, 1971). Brillouin measurements yield acoustic mode frequencies which are related to elastic constants, Cjj. Raman studies give frequency shifts for optical
34
2.4.4 Nmr and Other Spectroscopic Techniques
Nuclear magnetic resonance, nmr, is another useful technique providing information on ion dynamics at the microscopic level (Strange, 1986). It is nucleus specific, thus enabling identification of mobile species even to the extent that it distinguishes between motion of the same chemical species on inequivalent lattice sites.
In a simple absorption experiment the resonance line has a finite width, Aco, due to small variations in the energy levels of the nuclei. However, if diffusion is occurring each nuclear spin sees only an average of the local field and line narrowing occurs. Measurements of line width and relaxation times (spin - lattice T 1f spin - spin T2) enable jump frequencies
35
2.4.5 Conductivity and Diffusion
Measurements of the bulk conductivity, a , and the self diffusion coefficient, DT, of an isotropic tracer (by radiotracer or nmr methods) provide
information on the thermodynamic parameters which control point defect behaviour. Conductivity depends on the net movement of charge by the defects and diffusion on the movement of the tracer via the defects. Analysis using both methods helps to identify transport mechanisms in ionic crystals (Chadwick and Corish, 1986).
For doped materials additional electrical techniques are used to study the re-orientation of impurity-defect clusters. The methods used include dielectric relaxation and ionic thermo-current, ITC, measurements (Capelletti, 1986).
2.4.6 Calorimetric Studies
Specific heat measurements are also used when studying superionics. As noted for high temperature fluorites (Dworkin and Bredig, 1968) and LaF3 (Lyon et al., 1978) there is a specific heat anomaly at
approximately the same temperature as when the conductivity rises sharply. Both phenomena are believed to originate from a disordering of the anion sub-lattice.
2.5 Fluoride Conductors
2.5.1 Fluorites
The structural and transport properties of fluorite structured alkaline earth fluorides (CaF2, SrF2, BaF2) have been studied widely over the last 15
36
The fluorites have a simple and open structure consisting of a cubic array of anions with alternate cube centre sites occupied by divalent cations. At low temperatures the intrinsic point defects are anion-Frenkel pairs with interstitials occupying some of the empty cube centre sites. Ionic transport is low, as would be expected for a normal ionic solid, and occurs via vacancy or interstitial mechanisms. Vacancy motion has an activation energy of ~0.3 to ~0.5 eV and occurs when an anion makes a direct jump into a neighbouring vacancy. Interstitials follow a more complicated intersticialcy mechanism with higher activation energies (0.7 to 0.9 eV).
As the temperature increases, there is a specific heat anomaly at T c, several hundred degrees below the melting temperature. Beyond Tc the
conductivity rises rapidly before levelling out, putting fluorites into the superionic class. There has been much uncertainty as to the nature and extent of disorder in the superionic phase. The conductivity rise was originally thought to derive from the massive generation of anion Frenkel disorder (Derrington et al., 1975). However, more recent studies (e.g. diffraction - Dickens et al., 1979a and Brillouin scattering - Catlow et al.,
1978) have shown this not to be so and that lower levels of disorder (3 to 5%) are more realistic. Molecular dynamics (Gillan and Dixon, 1980, Dixon and Gillan, 1980a) and neutron studies (Dickens et al., 1979b, Hutchings et al., 1984) have also shown that there is negligible occupancy of the interstitial cube centre site. The simulation work also demonstrated that interstitials as well as vacancies act as charge carriers and contribute to the migration process, although the predominant method is by vacancy hopping along the <100> cube edge direction. This is supported by the quantum elastic neutron scattering work of Dickens etal. (1983).
The levelling of the conductivity above Tc has been attributed to the
formation of defect clusters, such as that illustrated in Figure 2.1 (Dickens
et al., 1982, Hutchings et al., 1984). This cluster is similar to the ,2:2:2’
37
by the vacancies. Support for this type of model has come from the defect energy calculations of Catlow and Hayes (1982), which show this cluster to be stable with respect to the component isolated defects. Additional evidence for cluster models is provided by the conductivity analysis of Allnatt
et al., 1987 which tested the stability of a variety of cluster types. Clusters
with an excess of interstitial anions were found to be particularly stable. Their formation can help explain fast-ion conduction in terms of the generation of charge compensating mobile vacancies in the rest of the lattice. Beyond a certain temperature, however, repulsion between defect aggregates and the build up of large neutral clusters will preclude the formation of further clusters and hence the conductivity no longer increases.
An alternative explanation of the conductivity in the fast-ion region has been put forward in the reviews of Gillan (1985, 1986 a, b). Analysis suggests that it is not necessary to involve cluster formation to explain the neutron diffraction observations and that the rapid motion of defects will suffice instead. Whatever the reality, large anharmonic vibrations certainly exist and these could make the structural interpretation difficult. Therefore, despite several years of research, a detailed understanding of the complex dynamical disorder of the fast-ion region is still proving difficult.
2.5.2 Anion Excess Fluorites
Alkaline earth fluorides can dissolve up to ~40 mol% of trivalent rare earth fluorides and still retain the fluorite structure. The result of such aliovalent doping is the generation of charge compensating F' interstitials and a variety of cluster formations dependent on the concentration of dopant. The latter dominate the structure and transport properties in anion excess fluorites.
38
has been calculated by lattice simulation methods (Wapenaar and Catlow, 1981 and Corish et al., 1982). The type of cluster formed is determined by the size of the impurity ion relative to the host cation and the lattice parameter. A general conclusion is that nn clusters are favoured by small lattice constants and large dopant radii (except for Y 3+). Thus, nn clusters are the most frequent defect structure in C aF2 / MF3, whereas in BaF2, nnn configurations dominate. SrF2 shows mixed behaviour with smaller ions
tending towards nnn.
As dopant concentrations increase, diffraction techniques have revealed more complex clusters. These range from the 2:2:2 and 4:3:2 clusters used to explain the respective neutron diffraction data of 5 and 10 mol% CaF2/Y3+ by Cheetham et al. (1971),
Figure
2.2, to the larger cubo-octahedral cluster of Gettman and Greiss (1978),Figure 2.3.
Support for the stability of these clusters is provided by calculations of their energies by Catlow (1973, 1976) and Catlow et al. (1984b). Their relative stability is strongly dependent on the radius of the dopant ion. For large cations, e.g. La3+, the 2:2:2 model is preferred, whereas for smaller cations, e.g. Er3+, cubo-octahedral clusters have higher stability.Conductivity in anion excess fluorites is not as high as in pure fluorites. This is because clusters trap the mobile F_ ions. However, conductivity studies by Schoonman (1980) have suggested that clusters indirectly cause a lowering of activation energy for F* migration by providing low energy pathways around the clusters for interstitial migration.
High temperature studies by Archer et al. (1983) have shown a rise in conductivity at ~600°C, which is thought to arise from cluster dissociation. In addition, doping has been found to lower the transition temperature to the superionic state (Catlow et al., 1981). For 10 mol% CaF2 / Y3+, T c is reduced
39
temperature. Calculations by Catlow and Hayes (1982) support this by showing appreciable trapping energies for the 2:2:2 clusters.
2.5.3 Other Fluorides
Conduction in rare earth fluorides (which is one of the main interests in this thesis) has also attracted interest, as these materials are known to have better electrical performances than pure alkaline earth fluorides. A review of previous work is given in Chapter 4, although as shall be seen, little is known about the mechanisms of defect behaviour. The results of static and molecular dynamics calculations on defect formation and transport are discussed in Chapters 5 and 6, respectively.
Mixed metal fluorite structured fluorides, A-j.xMyF-j^x, are another set
of fast-ion conductors which have been shown to have higher conductivities than simple fluorites. The background and results of a neutron diffraction study of such a material, RbBiF4, is described more fully in Chapter 8.
Other metallic fluorides with superionic properties are lead-based materials, such as the fluorite structured PbF2 and PbSnF4. These materials
40
Figure 2.1 Interstitial-vacancy complex for high-temperature fluorites.
O *1 0>
!
>
—anion vacancy
41
Figure 2.2
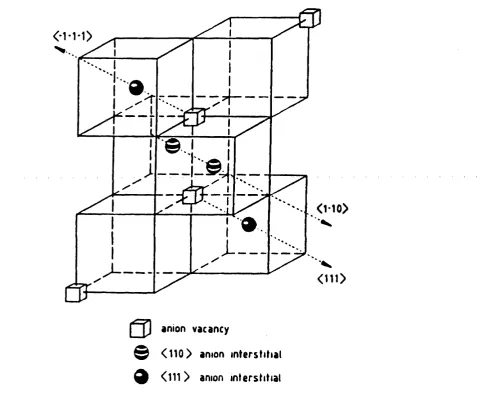
Dopant-interstitial clusters in doped CaF2 (a) 2:2:2 cluster (b) 4:3:2 cluster.q Ca2+/Ln3+
© < 110 > anion interstitial
q < 111 > anion interstitial □ Normal anion vacancy
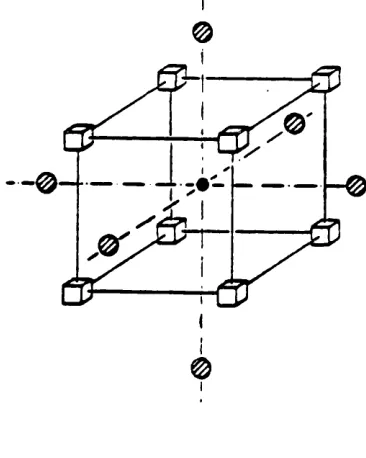
Figure 2.3
Cubo-octahedral dopant-interstitial cluster.0
- 0
0
□ anion vacancy
0 dopant ton
42
Chapter 3
Computational and Theoretical Methods
3.1 Introduction
This chapter examines the techniques of computer simulation and shows how they are applied to the study of fast-ion conductors. The methods described fall into two classes: static lattice simulations, which take no explicit account of thermal vibrations, and molecular dynamics, which model the dynamical and time-dependent properties of the system. This thesis is concerned with the application of such methods to experimental problems rather than their development and so the descriptions which follow will summarise the main features of each technique and demonstrate the value of each to the study of superionics. Both classes of simulation are well established in the field of solid state studies and are the subject of several reviews in the literature (Catlow and Mackrodt, 1982; Sangster and Dixon, 1976). Each class of simulation requires the specification of interatomic potential models to represent the forces acting between ions in the system. Reliable specifications are fundamental to the accuracy of the simulation results. This important topic is discussed in the final section of this chapter.
3.2 Aims of Computer Simulation
The aim of computer simulation is to provide information on the structure and transport properties of ionic or semi-ionic materials at the microscopic level. Such detail is complementary to conventional experimental techniques such as powder neutron diffraction, conductivity and nmr and so simulation is a useful analytical tool.
success (Catlow et al., 1977 a, b). The advent of powerful supercomputers with their parallel and concurrent architectures has, however, increased the range and scope of investigation to include more complex materials. A greater level of understanding has been afforded in, for example, the behaviour of superionic, non-cubic materials (Wolf et al., 1984 a,b; Wolf and Catlow, 1984), silicates (Catlow and Parker, 1985), zeolites (Hope, 1985) and ceramics (Lewis and Catlow, 1985). A growing area of interest is surface simulation for which associated techniques have been developed (Tasker, 1979; Colbourn, 1986) and these have been extended to examine grain boundary interfaces (Duffy and Tasker, 1983).
The basis of the modelling technique is the specification of reliable interatomic potentials from which the following properties may be calculated:
i)Crystal structure - in terms of unit-cell coordinates and cell dimensions.
These calculations may be used in conjunction with diffraction data to analyse complex structures. Alternatively, they may be used as a predictive tool when probing a system under extreme conditions of temperature or pressure.
ii)Crystal properties, such as elastic, dielectric, piezoelectric constants
and lattice dynamics.
\\\) Defect properties, which hold the key to transport properties of solids
and are of primary interest in this thesis. The static simulations characterise the nature of the defect species responsible for the transport process. This is achieved by calculating energies of formation and migration and the binding energies of defects and impurity defect species. Molecular dynamics treats thermal motion explicitly and is instrumental in identifying the microscopic mechanisms of ion transport. It is also useful for the analysis of complex and high temperature structures.
The work on LaF3 presented in Chapters 5 and 6 is principally
The following sections describe the simulation methods used in this thesis. Each of the methods is based on the classical Born model approach to the solid, that is, the specification of short-range potential functions acting between point ion charges.
3.3 S tatic Lattice Sim ulations
3.3.1 Perfect Lattice
The lattice energy, Ul, of a perfect crystal may be written as:
where the summations refer to all ion pairs, i and j, such that i * j, and all trios i, j, k, where i * j * k. r^ equals the separation between all pairs of ions, qj is the charge on species i, ^ describes the short-range interaction between ion pairs and is the three body potential between atom i and
two others, j and k.
The first term on the right hand side of equation 3.1 is the long-range Coulombic or electrostatic energy which provides the dominant contribution to the lattice energy, being around 90% for ionic materials. The short-range interactions represent the forces between adjacent ions. They are described by simple analytical functions containing a repulsive term due to charge cloud overlap and an attractive term consisting of dispersive and any covalent interactions. The short-range term in equation 3.1 has also been extended to include three-body, angular-dependent interactions (Leslie, 1985). For simulation work, pair potential models are generally acceptable for ionic materials, although three body terms become large in covalent systems (Sim, 1988; Sanders et al, 1984). These higher order potentials were not used in this thesis.
3.3.2 Summation Methods
The Coulombic, r 1 sums of equation 3.1, are only slowly converging in real space and cannot be truncated without leading to serious artefacts (Adams, 1983). They do, however, become rapidly convergent when transformed into reciprocal space according to the method of Ewald (1921).
The physical basis for the Ewald method is the replacement of each point ion by a Gaussian charge distribution at every lattice site. Considering the lattice to be composed of sub-lattices of opposite charge, the electrostatic potential experienced by any one reference ion in the presence of all other ions is given by,
*F = ^ + ¥ 2 (3.2).
The potential 'F-j arises from a Gaussian charge distribution of the same size
and sign as the ions replaced. However, according to the definition of the Madelung constant, the charge distribution on the reference site is not considered to contribute to either of the potentials 'F-j o r x¥ 2- Potential *Fi
may, therefore, be written as,
(3.3)
where x¥ a is the potential of a continuous series of Gaussian distributions and ^ t h a t of a single distribution at the reference site. Potential ¥ 2, in
equation 3.2, corresponds to a lattice of point charges with an additional, but equally opposite, Gaussian charge distribution superimposed on the first.