Minimizing the cost of two-tier cellular network with
queuing handoff calls in microcell using genetic
algorithm
Pankaj Goel
1* and D.K. Lobiyal
2Abstract
Call dropping probability is less desirable rather than call blocking probability for modeling of two tier cellular network design. To reduce call dropping probability queuing for handoff calls in microcell may be the one solution. Determining number of cells in each tier without compromising the quality can realize the network design as an optimization problem. In this paper, we have considered cost optimization problem of a two tier cellular network design. In this problemM/M/c/kqueuing model is used in microcell for hadling the handoff calls. A two dimensional Markov chain model has been developed to determine the steady state probabilities of number of calls served by macrocells and microcells. This optimization problem has been solved by using genetic algorithm. The results of the proposed solution are compared with the results of Simulated Annealing based algorithm using guard channel CAC without queuing.
Keywords
Cellular Network; Tier; Genetic Algorithm; Simulated Annealing; Markov Chain; GACN; Queuing model.
1,2School of Computer and Systems Sciences, Jawaharlal Nehru University, New Delhi, Delhi 110067, India.
*Corresponding author:[email protected];[email protected]
Article History: Received24December2017; Accepted21January2018 c2018 MJM.
Contents
1 Introduction. . . 14
2 Related Work. . . 15
3 Mathematical Model. . . 15
3.1 Model assumptions . . . 15
3.2 Model formulation and parameter . . . 16
Performance analysis of microcell•Performance analysis of macrocell 4 Formulation of Optimization Problem. . . 17
5 GACN algorithm. . . 18
6 Experimentation and Results. . . 18
7 Conclusion. . . 20
References. . . 20
1. Introduction
In last decade exponential growth has been seen in the inverse of mobile users. People show more interest in digital payment, mobile banking, digital news, and digital locker due to digital India program. New network operator like Jio comes in market. Due to policies of new operator there is
tremendous increase in mobile users which put pressure on bandwidth. There are many factors like Quality of service, lower power usages and ever- present mobile coverage play important role to select the mobile operator by the users.
Availability of limited frequency spectrum makes Quality of Service a challenging task. Therefore, Multi-tier network-ing becomes vital in providnetwork-ing QoS. To improve the spatial reuse of frequency spectrum multi-tier architecture plays an important role. The whole coverage area is covered by two tier of cells, one is macrocells and other is microcells. One macrocell has many microcells. Each cell has base station (BS) which control the cells and transmits signals to mobile terminals. According the transmission power constraints and availability of spectrum, a group of channels are assigned to each cell.
probabilities are two important Quality of Service measures.
In this paper, we are usingM/M/c/kqueuing model in
microcell for handoff calls with guard channel CAC. We are presenting two-tier cellular networks problem as an optimiza-tion problem with call blocking, call dropping probability in microcell and macrocell and number of microcell covered by a macrocell assumed as an odd integer as constraints and minimizing the implementation cost of the network. We are
using GACN [6] to solve the optimization problem .
The remaining of the paper is as follows. Research work related to two-tier cellular network carried out in the literature is presented in section 2. The mathematical model developed in this work is explained in section 3. Genetic Algorithm used for solving the guard channel CAC optimization problem in Cellular Network (GACN) is presented in section 4. Numer-ical results obtained are discussed in section 5. Finally the work presented in paper is present in the last section.
2. Related Work
It is expected that within time span of 5 year mobile user will be doubled and thus the cellular infrastructure should be
developed accordingly [1]. To satisfy the Quality of service
and manage increasing volume of traffic, Hierarchical Cellular
Network (HCN) may be considered as an solution [2]. In
HCN, tiered networks are designed to provide high coverage and capacity over a given service area. In a two-tier network, macrocell works as upper tier which radius is approximately 1-2 km while microcells works as lower tier whose radius
is upto 1 km. Heterogeneous Cellular Networks considerk
tier model where each tier consists of particular class BSs
such as femtocells or pico-cells [3], Mobile velocity based
bidirectional scheme in HCN is discussed by Shan and Fan
[4]. In mobile velocity based scheme slow mobility user
are directed to microcell while overflow user from microcell, handoff calls and fast mobility users are directed to macrocell. Network design for two tier cellular network based on class
selection strategy is discussed by Ekici and Erosy [5]. Goel
and Lobiyal find minimum cost for two tier cellular network
design using genetic algorithm [6].
Preserving new call blocking probability while reducing handoff probability may be achieved using channel sub-rating
strategy. Xiaolong et al. in their paper [7] proposed a call
ad-mission control scheme for HCN based on channel sub-rating using 1-D Markov process in microcell and 2-D Markov pro-cess in Macrocell. Martin Taranetz evaluated the performance of typical indoor users in urban two-tier heterogeneous mo-bile networks with indoor-deployed small cell base stations (BSs) and normal outdoor BSs. In this indoor and outdoor environments are partitioned by walls with a certain
pene-tration loss [8]. Jain and Rakhee [17] proposed a model in
which guard channel scheme is used and priority is given to
handoff calls. Huang, Kumar and Kuo [18] proposed a model
of three service classes: handoff priority, handoff guarantee and best effort service. An optimal allocation scheme for an integrated wireless cellular model with handoff priority and
handoff guarantee services is designed by Jain and Mittal [9].
The millimeter-wave (mmWave) frequency band is seen as a key enabler of multigigabit wireless access in future cellular networks. MAC tier issues, such as synchronization, random access, handover, channelization, interference management, scheduling, and association for mmWave frequency band are
discussed by Hossein Shokri-Ghadikola et al. [10]. Optimal
channel assignment in mobile communications using Genetic
algorithms is proposed by Wang, Arun Kumaar and Gu [11].
3. Mathematical Model
In this work we divided total no of channels in a cells in two groups one group is known as guard channels which is reserve for handoff calls. Another group with rest of channels used for new call as well as handoff calls. Whole region is divided into microcells covered by macrocells. A macrocell contains odd integer multiple of microcell. Incoming calls are classified in two class one as slow mobility and other as fast mobility. Slow mobility calls arrive in the microcell whereas fast mobility new calls arrive in the macrocell. The blocked calls and dropped handoff calls from microcell are also dealt by the overlayed macrocells. To handle the handoff calls in excess of guard channels in microcell FIFO queue with size
3 is used. M/M/c/kqueuing model is used for modeling
of Markov chain. In designing two tier cellular network, it is important to determine the optimal number of microcells and macrocells to achieve the performance. Therefore, in this paper we have formulated it as an optimization problem to estimate the cost of designing a two tier cellular network.
3.1 Model assumptions
For constructing mathematical model, we have made the following assumptions:
(1) The whole service area is covered by macrocells and a macrocells has odd number of microcells within it.
(2) The radius of a macrocell and a microcell are approxi-mately 600m and 1400m respectively.
(3) Two mobility classes - slow mobility and fast mobility are considered.
(4) Microcell takes slow mobility calls and macrocell takes fast mobility calls as well as overflowed slow mobility calls from microcells.
(5) The mean velocity of fast mobility users(vf)and slow
mobility users(vs)are considered as exponentially
dis-tributed and remain the same for the entire call duration.
(6) All available channels between microcells and macro-cells are randomly distributed.
(8) When guard channels are not available FIFO queue with size 3 used for handoff calls only.
(9) The time spend by a user in a cell is called dwell time
and calculated as in [12].
(10) λmsandλM f are call arrival rate of slow and fast users
and they follow Poisson distribution.
(11) In a microcell if only guard channels are available all new calls are blocked and overflowed to overlaying macrocell.
(12) In a microcell, if queue is full than handoff calls are blocked and overflowed to overlaying macrocell.
(13) Any call from macrocell to microcell is not allowed in any situation.
3.2 Model formulation and parameter
3.2.1 Performance analysis of microcell
Microcell tier of two-tier cellular network can be modeled
in terms of one-dimensional Markov chain [6]. In this model
usedM/M/c/kqueuing model. In this model we considered
no of serving channels fixed and size of queue also fixed as 3. The mean queue time depends on mean cell dwelling time and
maximum crossover distancem, over the overlapping zone
between two cells. Mean queen time is shown as [16].
Mean queue timeµ1
q
= 100M µ1 ms
The variables used in modeling are defined as follows
λms: slow mobility call arrival rate in microcell
λmsh: slow mobility asymptotic handoff rate in microcell
1/µms: Dwell time of the slow mobility user in Microcell
1/µt: Mean call duration
r: Microcell radius
R: Macrocell radius
vs: Mean speed of slow mobility user
ch1: Number of channels in microcell
G1: Number of Guard channels in microcell
SAm2: Call arrival rate per second perm2for slow mobility
user
Pmb: Microcell call blocking probability
Pmd: Microcell call dropping probability
Where 1/µms=2rπvs,a=λms+λmsh,b=λmsh,c=µt+µms,
d=µt+µq,ch1=n,G1=m
A Markov chain for a microcell withnchannels,mguard
channel with queue size 3 is presented in Figure 1
Figure 1
In Figure 1, number of calls served by a microcell
corre-sponds to a state. Each microcell consists ofnchannels out of
whichmguard channels and(n−m)channels are available
for new calls as well as handoff calls. If the number of busy
channels are greater than(n−m)channels then new call is
blocked. Blocked new call is transfered to overlayed macro-cell. Further handoff calls are served by guard channels. If
number of busy channels are greater thannthenM/M/k/c
queue of size 3 channels are used by handoff calls only. From
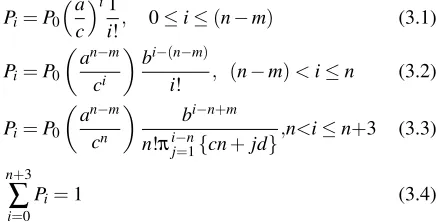
the state diagram in Figure 1 the steady state probabilitiesPi
in microcell is given as follows:
Pi=P0 a
c
i1
i!, 0≤i≤(n−m) (3.1)
Pi=P0 an−m
ci
bi−(n−m)
i! , (n−m)<i≤n (3.2)
Pi=P0 an−m
cn
bi−n+m
n!πij−=1n{cn+jd},n<i≤n+3 (3.3)
n+3
∑
i=0
Pi=1 (3.4)
The Asymptotic handoff rate λmsh is calculated iteratively
until difference between two iteration is less than 0.0000005 using the following formula
λmsh(k) =
n+3
∑
i=0
i.Pi.µms (3.5)
The slow new calls in the microcell are blocked after all (n-m) channels are busy and calls are blocked. Therefore, the call blocking probability in microcell can be represent as
Pmb=
n+3
∑
i=n−m
Pi (3.6)
The slow handoff calls in the microcell are dropped, if all channels are busy& queue of size 3 is full. The call blocking
probability,Pmdis given as
Pmd=Pi, wherei=n+3(7) (3.7)
The blocked slow calls in microcells are overflowed to the
macrocell with rateλosand dropped handoff calls overflowed
to the macrocell with rateλosh. The overflow call rateλosand
overflow handoff rateλoshare given as
λos=Nc.λms.Pmb (3.8)
λosh=Nc.λmsh.Pmd (3.9)
Where
Nc=Nc−4+6(c−2), (3.10)
N1=1 and N−1=0
3.2.2 Performance analysis of macrocell
λM f: Fast mobility call arrival rate in a macrocell
λM f h: Fast mobility asymptotic handoff rate in a Macrocell
λMsh: Slow mobility asymptotic handoff rate once they enter
a macrocell
µMs: Dwell time of the slow mobility user in the Macrocell
µM f: Dwell time of the fast mobility user in the Macrocell
1/µt: Mean call duration
vf: Mean speed of fast mobility user
ch2: Number of channelsna macrocell
G2: Number of guard channels in a macrocell
FAm2: Call arrival rate per second perm2for fast mobility
users
PMb: Call blocking probability in a macrocell
PMd: Call dropping probability in a macrocell
Where 1
µMs =
Rπ 2vs,
1 µM f =
Rπ
2vf,X =λMsh+λosh+λos,Y =
λM f+λM f h,[D=µt+µMs,E=µt+µM f,a=λMsh+λosh,
b=λM f h,ch2=n,G2=n−m.
A Markov chain for a macrocell withnchannels is
pre-sented in Figure 2.
In this figure a state corresponds to the number of fast
usersiand slow users jserved by a macrocell. Using state
transition diagram given in Figure 2, the equilibrium equations can be written as follows:
(X+Y)P0,0=DP0,1+EP1,0 (3.11)
(X+iE+Y)Pi,0=DPi,1+Y Pi−1,0+ (i+1)EPi+1,0,
for 0<i<m (3.12)
(a+iE+b)Pi,0=DPi,1+Y Pi−1,0+ (i+1)EPi+1,0,fori=m
(3.13)
(a+iE+b)Pi,0=DPi,1+bPi−1,0+ (i+1)EPi+1,0,
form<i<n (3.14)
iEPi,0=bPi−1,0, i=m (3.15)
(X+Y+jD)P0,j=X P0,j−1+EP1,j+ (j+1)DP0,j+1,
0<j<m (3.16)
(a+b+jD)P0,j=X P0,j−1+EP1,j+ (j+1)DP0,j+1, j=m
(3.17)
(a+b+jD)P0,j=aP0,j−1+EP1,j+ (j+1)DP0,j+1,
form<j<n (3.18)
jDP0,j=aP0,j−1, j=n (3.19)
(X+jD+iE+Y)Pi,j
=Y Pi−1,j+X Pi,j−1+ (j+1)DPi,j+1+ (i+1)EPi+1,j,
for 0<i+j<m (3.20)
(a+jD+iE+b)Pi,j
=Y Pi−1,j+X Pi,j−1+ (j+1)DPi,j+1+ (i+1)EPi+1,j,
fori+j=m (3.21)
(a+jD+iE+b)Pi,j
=bPi−1,j+aPi,j−1+ (j+1)DPi,j+1+ (i+1)EPi+1,j,
form<i+j<n (3.22)
(jD+iE)Pi,j=bPi−1,j+aPi,j−1,fori+j=n (3.23)
n
∑
i=0
n−i
∑
j=0
Pi,j=1 (3.24)
The Asymptotic handoff rateλMsh andλM f hare calculated
iteratively with accuracy of 0.000005 using the following equations
λMsh(k) = n
∑
i=0
n−i
∑
j=0
(iPi,jD) (3.25)
λM f h(k) =
n
∑
i=0
n−i
∑
j=0
(jPi,jE) (3.26)
The equilibrium equations form 11 to 24 are solved using Gauss Jordon numerical method for calculating the steady
state probabilitiesPi,j.
The call blocking probability,PMbandcall dropping
prob-ability,PMdin macrocell is calculated as follows:.
PMb=
∑
i
∑
jPi,jandi+j≥(n−m) (3.27)
PMd=
∑
i
∑
jPi,jandi+j=n (3.28)
The total call blocking(Pb)and call dropping(Pd)
probabili-ties are calculated using the following equations
Pb=
NcλmsPmbPMb+λM fPMb
Ncλms+λM f
(3.29)
Pd=
NcλmsPmdPMd+λM fPMd
Ncλms+λM f
(3.30)
4. Formulation of Optimization Problem
We have considered a cost minimization problem for two-tier cellular network. The minimum cost problem can be formulated as follows:
MinC=C1N1+C2N2 (4.1)
s.t.
Pb≤Pbmax (4.2)
Pd≤Pdmax (4.3)
πr2N1≤Area (4.4)
πR2N2≤Area (4.5)
R
r =Oddinteger (4.6)
WhereCis total cost of designing a micro-macro cell system.
The cost of designing one unit of microcell and macrocell
areC1andC2respectively. The number of microcells and
macrocells in the system areN1andN2respectively.
The radius of microcell and macrocell are represented by
randRrespectively. PbmaxandPdmaxare maximum
accept-able value of call blocking and call dropping probabilities
Inequality constraints in equation (32) and (33) represent the call blocking and call dropping probabilities which should be less than the given limits. Inequality constraints in equa-tion (34) and (35) represent total coverage area. Inequality constraints in equation (36) represents that there should be integer number of covering microcells in a macrocell. We solved the above optimization problem by using a Genetic Algorithm(GACN).
5. GACN algorithm
The Genetic Algorithm to solve Cellular Network (GACN) optimization problem in this work is given as follows:
Step-1:Initialized population
First we considered genes of 4 cell with field
Ch1 Ch2 G1 G2 r R
Where
• Ch1 is number of channels in a microcell
• Ch2 number of channels in a macrocell
• G1 number of guard channels in a microcell
• G2 number of guard channels in a macrocell
• r radius of a microcell
• R radius of a macrocell
The population is initialized by generating randomly Ch1, Ch2, r and R. For example a gene C1 can be as follows
18 16 5 8 466 398
Using the fitness function population is accepted if R/r is an odd integer; otherwise again new population is generated. We have considered an initial population of 40 chromosomes.
Step-2:Mutation
Select a gene randomly and then select a random position p between 1-6 in the gene
If(p≤4)then
Generate that particular cell accordingly
elseif(5≤p≤6)then
Generate both cell 5 and 6 such that R/r is odd integer For example if random gene is C1 and p=2 then new gene C2 is as
18 15 5 8 466 398
If p=3 or 4 thenrandRboth are generated again such
that ratioR/ris an odd integer
Step-3: Crossover
Select two random population e.g. C1 and C2 as follows.
18 15 5 7 466 398
19 20 1 3 466 398
Select random positionpbetween 1-6 e.g. p=2 then new
genes are
18 20 1 3 466 398
19 15 5 7 466 398
Step-4:Apply the fitness function
Step-5: Evaluate the population
Step-6: Check the stopping criteria
If(stopping criteria is not satisfied) then Go to step no 2
else end
6. Experimentation and Results
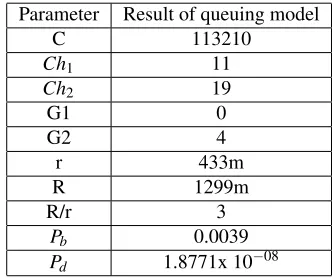
The GACN algorithm is used to solve the optimization problem described in 3.2.3 as follows. First an initial popula-tion of 50 is generated. Ch1 and Ch2 are randomly generated between (11,20). G1 and G2 are randomly generated between (0,10). Let the radius of microcell(r) is approximately 0.5 km and the radius of macrocell (R) is between 800-1400 meters.. We apply GACN algorithm for the base problem using the parameters given in Table 1. The results of the experiments are given in table 2.
Table 1.Parameters with their base values
Parameter Base Value
vs 1 m/s
vf 8m/s
SAm2 8×10⁻⁸calls per sec perm2
FAm2 2×10⁻⁸calls per sec perm2
1/Dt 100 sec
C1 10 cost unit
C2 30 cost unit
A 50000Km2
CS 7
Pb,max 0.01
Pd,max 0.001
Chtotal 150
Table 2.Values of decision parameters for the base problem
Parameter Result of queuing model
C 113210
Ch1 11
Ch2 19
G1 0
G2 4
r 433m
R 1299m
R/r 3
Pb 0.0039
Pd 1.8771x 10−08
We solve queuing model using GACN algorithm to see convergence around 600 times this algorithm. It is observed that after 200 iterations total cost start decreasing and after 450 iterations the cost remain same. We performed this 600 times and result is shown in Figure 3.
(n-1)E
0,0
2E 1,0 E
Y
…...
mE
Y b
(m+1)E
…….. b
nE n,0 (n-1),0 b m,0
Y
2E 1,1 E
Y
…...
mE
b b
(m+1)E
…….. b (n-1),1 (n-1)E m,1
Y b b
E 2E
b E
………
…….
………..
Figure 2. Transition diagram for macrocell with n channels & (n-m) guard channels Figure 2
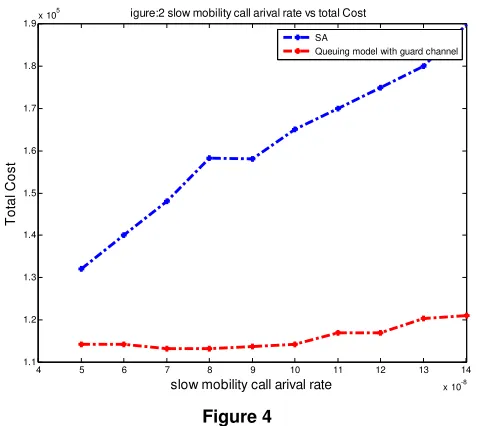
Now we study the effect of some other parameters on the cost. First we study, change of slow mobility call arrival rate
from 5×10⁻⁸to 15×10−8calls per sec perm2with a step
size of 1×10⁻⁸calls per sec perm2result are shown in figure
4.
0 100 200 300 400 500 600
1.14 1.15 1.16 1.17 1.18 1.19 1.2 1.21x 10
5
Number of iteration
T
o
ta
l C
o
s
t
Figure:1 Number of iteration vs Total Cost
Queuing Model with gaurd channel
Figure 3
In Figure 4 it is shown that when slow mobility call arrival rate increase, the system cost increases. In GA algorithm rate of change of cost is more than our proposed queuing model with GACN algorithm.
To examine the effect of fast mobility user arrival rate on the total cost, we considered the fast mobility user arrival rate
from 1×10⁻⁸to 5×10⁻⁸calls per sec perm2with a step size
of 1×10⁻⁸calls per sec perm2. The results are shown in
Figure 5.
4 5 6 7 8 9 10 11 12 13 14
x 10-8
1.1 1.2 1.3 1.4 1.5 1.6 1.7 1.8 1.9x 10
5
slow mobility call arival rate
T
o
ta
l
C
o
s
t
igure:2 slow mobility call arival rate vs total Cost
SA
Queuing model with guard channel
Figure 4
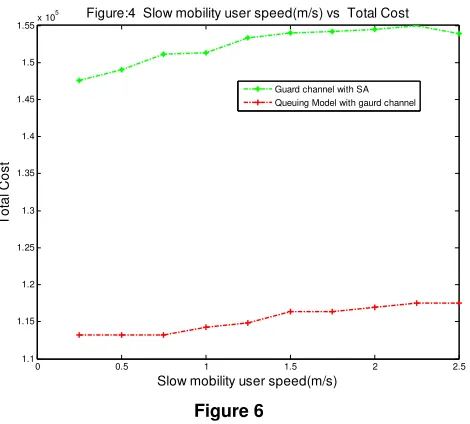
Now, we study change in total cost as we change the average speed of slow mobility user from 0.25m/s to 2.25 m/s taking step size 0.25 m/s and the results shown in figure 6.
1 1.5 2 2.5 3 3.5 4 4.5 5
x 10-8 1.1
1.2 1.3 1.4 1.5 1.6 1.7 1.8 1.9x 10
5
Fast mobility call arival rate
T
o
ta
l C
o
s
t
Figure:3 Fast mobility call arival rate vs total Cost
queuing model with gaurad channel
Figure 5
0 0.5 1 1.5 2 2.5 1.1
1.15 1.2 1.25 1.3 1.35 1.4 1.45 1.5 1.55x 10
5
Slow mobility user speed(m/s)
T
o
ta
l C
o
s
t
Figure:4 Slow mobility user speed(m/s) vs Total Cost
Guard channel with SA Queuing Model with gaurd channel
Figure 6
Similarly, we study the change in total cost as we change the average speed of fast mobility user from 6 m/s to 9 m/s taking step size 0.25 m/s result is shown in figure 5
6 6.5 7 7.5 8 8.5 9
1.12 1.14 1.16 1.18 1.2 1.22 1.24 1.26 1.28 1.3 1.32x 10
5
High mobility user speed(m/s)
T
o
ta
l C
o
s
t
Figure:5 High mobility user speed(m/s) vs Total Cost
Queuing Model with gaurd channel
Figure 7
7. Conclusion
In this work, we make a model using queuing with guard channel CAC policy and total minimum cost of two-tier cel-lular network calculated using GACN algorithm. We also compared GACN algorithm with SA algorithm Our results show that this queuing model with GASN algorithm gives better results in most of the situation with in comparison to SA.
References
[1] More Than 50 Billion Connected Devices,
Er-icsson White Paper, February 2011 available at
http://www.akosrs.si/files/Telekomunikacije/Digitalna agenda/Internetni protokol Ipv6/More-than-50-billion connected-devices.pdf
[2] C. Hartmannn and O. Schelegelmilch, Hierarchical cell
structures with adaptive radio resource management,in
Proceedings IEEE Vehicular Technology Conference, pp. 1764–1771, 2000.
[3] H.S. Dhillon, R.K. Ganti and J.G. Andrews, Modeling
and analysis of k-tier downlink heterogeneous cellular
networks,IEEE Journal on Selected Area in
Communica-tions, 30(3), 2012.
[4] W.H. Shan and P.Z. Fan, Performance evaluation of a
hierarchical cellular system with mobile velocity-based
bidirectional call-overflow scheme,IEEE Transactions
on Parallel and Distributed System, 14, 72–83, 2003.
[5] E. Ekici and C. Erosy, Multi-tier cellular networking
dimensioning,Wireless Network, 7, 401–411, 2001.
[6] P. Goel and D.K. Lobiyal, Minimize the cost of two-tier
cellular network using genetic algorithm,International
Journal of Control Theory and Application, 10(6), 375– 387, 2017.
[7] W.U. Xiaolong, H.E. Min, F. Wang, J. Zheng et al.,
Per-formance analysis of sub-rating for handoff calls in HCN,
Int. J. Communications, Network and System Sciences, 2(1), 1–89, 2009.
[8] M. Taranetz, R.W. Heath and M. Rupp, Analysis of urban
two-tier heterogeneous mobile networks with small cell
partitioning,IEEE Transactions on Wireless
Communica-tions, 15(10), 2016.
[9] M. Jain and R. Mittal, Adaptive call admission control
and resource allocation in multi server wireless/cellular
network,Journal of Industrial Engineering International,
12(1), 2016, 71–80.
[10] H. Shokri-Ghadikolaei, C. Fischione, G. Fodor, P.
Popovski and M. Zorzi, Millimeter Wave Cellular
Net-works: A MAC Layer Perspective,IEEE Transactions on
Communications, 63(10), 2015.
[11] L. Wang, S. Arun Kumaar and W. Gu, Genetic algorithms
for optimal channel assignment in mobile communica-tions, Neural Information Processing, 2002, ICONIP ’02. Proceedings of the 9th International Conference on 18-22 Nov. 2002.
[12] L. Orthigoza-Guerrero and A.H. Ahgvami, On
Op-timal spectrum partitioning in a microcell/macrocell
layout with overflow, in Proceedings of the IEEE
Global Telecommunications Conference (IEEE GLOBE-COM’97), Arizona (1997)
[13] D. Bertsekkas and R. Gallager,Data Networks, 2nd ed.
(Prentice –Hall, Englewood Chiffs, NJ, 1992).
[14] G. Boggia, P. Camarda and N. Di Fonzo, Tele traffic
analysis of hierarchical cellular communication networks,
IEEE Transactions on Vehicular Technology, 52, 931– 946, 2003.
[15] X. Yang and M. Guizani, Optimal paging load balance
hierar-chical cellularNetworks, 5 (8), 2202–2209, 2006.
[16] T. Salih and K. Fidanboylu, Modeling and analysis of
queuing handoff calls in single and two-tier cellular
networks,Computer Communications, 29, 2006, 3580–
3590.
[17] M. Jain and Rakhee, Priority based channel assignment
scheme for PCS with integrated traffic,J. Comput. Sci.
Inf., 33(1), 8–18, 2003.
[18] L. Huang, S. Kumar and C.C.J. Kuo, Adaptive resource
allocation for multimedia QoS management in wireless
networks,IEEE Trans Veh Technol., 53 (2), 547–558,
2004.
? ? ? ? ? ? ? ? ?
ISSN(P):2319-3786
Malaya Journal of Matematik
ISSN(O):2321-5666