Analysis of Land Use/Land Cover Changes Using Remote
Sensing Data in Dindigul District, Tamil Nadu, India
Jismol S Pinakkattu1, B. Gurugnanam2, S. Bairavi3
1,2,3Centre for Applied Geology, Gandhigram Rural Institute – Deemed to be University, Dindigul, Tamil Nadu,
India
ABSTRACT
Land use/land cover (LU/LC) changes in Dindigul District, Tamil Nadu, were determined during the period 2000 to 2016 using Geospatial technology. Landsat imageries were used to study the past and present land use/ land cover changes. The study results show that there is an increasing trend in the built-up area, especially in urban built-up.
Keywords: Land Use/Land Cover (LU/LC), Change detection, Remote sensing, GIS
I.
INTRODUCTION
Land use / Land cover change is a major issue of concern with regards to change in global environment (Qian et al., 2007). The land use/land cover pattern of a region is an outcome of both natural and socio-economic factors and their utilizing by men in time and space. The land is becoming a scarce commodity due to immense agricultural and demographic pressure. The change in land use pattern over space and are thus responsible for physical-economic-social and environment factors. There are different types of land use/land cover existing on the earth for e.g., cropland, water bodies, forest plantation, dense forest, barren rocky, built-up area etc. The land use/ land cover analysis is one of the common methods for development; planning and management of natural, particularly land. The remote sensing gives the synoptic view of the earth surface. The repetitive coverage of satellite has made possible to examine the changes on a regular interval of time (Mani et al., 2014). Land use/Land cover dynamics are widespread, accelerating, and significant processes majorly
impelled by human actions and at the same time resulting to changes that impact human livelihood (Agarwal et al., 2002). The land use/land cover dynamics modify the availability of different important resources including vegetation, soil, water and other (Bruijnzeel, 2004 & Chomitz et al., 1998). At present, an attempt focused to study Land use/Land cover changes occurred in Dindigul District, Tamil Nadu State to understand the impact of changes in Land use/Land cover between 2000, 2008 and 2016.
II.
STUDY AREA
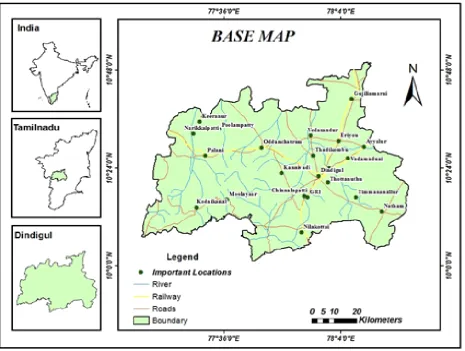
Figure 1.
The Base map of the Dindigul district
III. DATA USED
In the present study, land use/cover change detection
has been carried out using multispectral, LANDSAT
data of 2016, 2008 and 2000-year data. All the satellite
images were brought to Universal Transverse
Mercator (UTM) projection in zone 440 N. The
toposheets requisite for the study has been collected
from Survey of India and the details are given in table.
1.
Table 1.
Datasets Used In The Present Study And Their Source
S. No Data type
Year of product
Scale/Resolution Source
1
Toposheet
No:58J01-58J08
58F06 -58F16
1968 -1973
1:50:000
SOI
2
LANDSAT 5
2000
30m
USGS
3
LANDSAT 7
2008
30m
USGS
4
LANDSAT 8
2016
30m
USGS
The required satellite imagery for the study area
was downloaded from the USGS Earth Explorer.
Processing the imagery and image interpretation for
development of Land use and Land cover layers of
each year is done in ENVI Imagine software and
ArcGIS. The obtained maps are studied and
analysed to detect the change in land use/land cover.
The methodology adopted in detail is shown below
Figure 2.
Figure 2.
Methodology flowchart of Land use /
Land cover Mapping
V.
RESULTS AND DISCUSSION
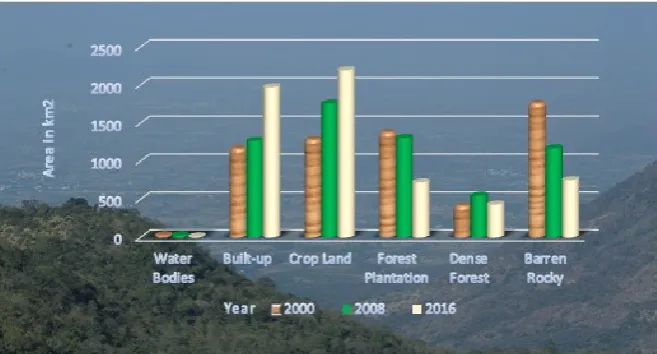
5.1. Land Use / Land Cover Classification (2000) The barren Rocky land is the dominant feature in the study area and it covers 1769.62 km2 Fig.3. Second major land use is forest plantation land and it covers
1384.97 km2 area. The Southwest portion of the district has wide forest plantation land. Total Crop Land in the district is 1292.18 km2 area. Totally the settlements covered 1174.21 km2 area. Dense forest covered 421.51km2 area. The surface water bodies are the major source for the cultivation and drinking water for many regions. 39.36 km2 area was covered by surface water bodies in 2000.
5.2. Comparison of Land Use / Land Cover from 2000 to 2008
Fig.4. shows the land use/land cover in 2008 image. Table. II. illustrates the changes in land use in 8 years from 2000. The maximum changes occurred in Barren Rocky. The 9.87% area of Barren Rocky had reduced in 2008. Crop Land and Dense Forest were increased to 1.52 km2, 7.68 km2, and 2.09 km2 areas respectively. And they occupied 1.52%, 7.68% and 2.09% in total area of the district. The maximum changes occurred in water bodies. The percentage of changes in Forest Plantation and Water bodies are -1.26% and -0.18% respectively. The built-up land was increased. The 1267.21 km2 area of built-up land increased in 2008.
5.3. Comparison of Land Use / Land Cover from 2008 to 2016
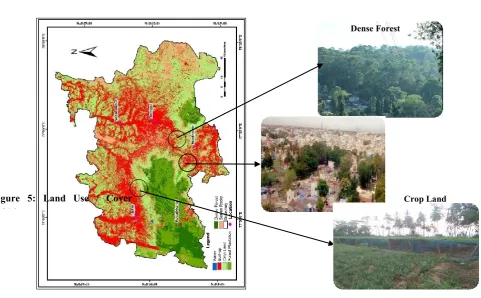
Dense Forest
Crop Land
Figure 5: Land Use / Cover _2016
Table 2. Land Use/Land Cover Changes From 2000 To 2008 Land Use / Land
Cover Classes
Area in km2 % of Area Changes (Area in km2)
% of Changes 2000 2008 2000 2008
Water Bodies 39.36 28.74 0.65 0.47 -10.62 -0.18 Built-up 1174.21 1267.21 19.31 20.83 93 1.52
Crop Land 1292.18 1760.32 21.25 28.93 468.14 7.68
Forest Plantation 1384.97 1308.72 22.77 21.51 -76.25 -1.26
Dense Forest 421.51 548.91 6.93 9.02 127.4 2.09
Barren Rocky 1769.62 1170.22 29.1 19.23 -599.4 -9.87
Table 3. Land Use/Land Cover Changes From 2008 To 2016 Land Use /
Land Cover Classes
Area in km2 % of Area Changes (Area in km2)
% of Changes 2008 2016 2008 2016
Water Bodies 28.74 12.5 0.47 0.21 -16.24 -0.26
Built-up 1267.21 1971.75 20.83 32.41 704.54 11.58
Crop Land 1760.32 2195.51 28.93 36.04 435.51 7.11
Forest Plantation 1308.72 722.33 21.51 11.87 -586.39 -9.64 Dense Forest 548.91 432.07 9.02 7.1 -116.84 -1.62
Barren Rocky 1170.22 751.9 19.23 12.36 -418.32 -6.87
5.4. Comparison of Land Use / Land Cover from 2000, 2008 to 2016
VI. CONCLUSION
This paper focuses on land use/land cover changes in Dindigul district, Tamil Nadu, India, using remote sensing data and GIS technology. Our results clearly show that land use/land cover changes were significant during the period from 2000,2008 and 2016. Forest Plantation land gradually decreased in this study area due to its conversion to cropland and Built-up area increased in the study area. While the areal extent of water bodies, dense forest, and barren rocky is decreased.
VII.
ACKNOWLEDGMENT
The authors are thankful to the university authorities, Gandhigram Rural Institute – Deemed to be University, Dindigul, Tamil Nadu for providing necessary facilities to complete this work.
VIII.
REFERENCES
[1]. Agarwal, C., Green, G.M., Grove, J.M., Evans, T.P., and Schweik, C.M. (2002) A Review and Assessment of Land-Use Change Models: Dynamics of Space, Time and Human Choice. Center for the Study of Institution, Population, and Environmental Change, USDA Forest Service Northeastern Forest Research Station, USA, 1-62.
[2]. Bruijinzeel, L.A. (2004) Hydrological functions of tropical forests: not seeing the soil for the trees Agriculture, Ecosystems and Environment 104: 185-228.
[3]. Chilar, J. (2000) Land Cover Mapping of Large Area from Satellites, Status and Research Priorities. International Journal of Remote Sensing, 21 (67), 1093-1114.
[4]. Chomitz, K.M., and Kamari, K. (1998) The domestic benefits of tropical forests. The World Bank Observer 13: 13-35.
[5]. Gaylan Rasul Faqe Ibrahim. (2017) Urban Land Use Land Cover Changes and Their Effect on Land Surface Temperature: Case Study Using Dohuk City in the Kurdistan Region of Iraq. Doi:10.3390/cli5010013.
[6]. Mani, N.D., and Rama Krishnan. N. (2014) Remote Sensing and GIS for Assessing the Impact of Changes on Land Use/ Land Cover in Dindigul District, Tamil Nadu, India, Volume:3/Issue 1.1000114/ 2169-0049.
[7]. Mercy C. Cheruto., Matheaus K Kauti., Patrick D Kisangau., and Patrick Kariuki. (2016) Assessment of Land Use Land Cover Chane Using GIS and Remote Sensing Techniques: A Case Study OF Makueni County, Kenya GIS 5:175. doi:10.4175/2469-4134.1000175.
[8]. Nithu, Raj., and Gurugnanam, B. (2017) Assessment of Land Use Land Cover Changes in Ennore River Mouth of Thiruvallur District, Tamil Nadu, South India. IJSRD, 4(12), 286-288. [9]. Praveen Kumar Mallupattu and Jayarama Reddy
Sreenivasula Reddy. (2013) Analysis of Land Use/Land Cover Changes Using Remote Sensing Data and GIS at an Urban Area, Tirupati, India,
Article ID 268623 (6),
(http://dx.doi.org/10.1155/2013/268623).
[10]. Qian. J., Zhou, Q., and Hon, Q. (2007) Comparison of pixel-based and object-oriented classification methods for extracting built-up area in arid zone. In: ISPRS Workshop on Updating Geo-Spatial Databases with Imagery & the 5th ISPRS Workshop on DMGISs, 163-171.
[11]. Reibsame, W.E., Meyer, W.B., and Turner, B.L.