www.orientjchem.org
An International Open Free Access, Peer Reviewed Research Journal
2018, Vol. 34, No.(4): Pg. 2114-2124
This is an Open Access article licensed under a Creative Commons Attribution-Non Commercial-Share Alike 4.0 International License (https://creativecommons.org/licenses/by-nc-sa/4.0/), which permits unrestricted Non Commercial use, distribution and reproduction in any medium, provided the original work is properly cited.
Estimation of Preptin in Serum of Thyroid dysfunction Patients
and its Relationship with other Parameters
TAMARA A. ALUbAIdI
1*, TAgHREEd U. MOHAMMd
1and ISAM N. ALkARAwI
21 Departement of Chemistry, College of Education for Pure Science, Ibn Al-Haitham,
Baghdad University, Iraq.
2National Diabetes Center, AL-Mustansiriyah University, Baghdad, Iraq.
*Corresponding author E-mail: [email protected]
Doi http://dx.doi.org/10.13005/ojc/3404052
(Received: May 03, 2018; Accepted: June 27, 2018)
AbSTRACT
The research includes a clinical study of Preptin with other parameters. The normal value of preptin in hypothyroidism (2638.4 ± 280.0) in female while (2960.4 ± 256.6) in male, in hyperthyroidism (589.0 ± 90.1) in male, while in female (993.2 ± 103.9), diabetes (2465.6 ± 282.4 ) in female, in male (2085.5 ± 282.8), in diabetes & hypothyroidism (3314.3 ± 177.3) in male, (3179.4 ± 265.7) in female, but control group in female (427.8 ± 60.4), in male (384.7 ± 62.4) at age (20-45) years they were divided into five groups: group one (G1) consisted of 30 hypothyroidism. The two group (G2) consisted of 30 patients with hyperthyroidism. And three group (G3) consisted of 30 healthy group, four group (G4) consisted of 30 patient with diabetes, and five group (G5) consisted of 30 patient with diabetes & hypothyroidism. The result show BMI where the results showed higher females compared with male in all groups, and a rise in the TSH in hypothyroidism and diabetes & hypothyroidism compared with other group, while shown low result in hyperthyroidism compared with other groups. But calcium, vitamin D3, FSH, and LH were non- significant because of people with osteoporosis and heart disease were excluded as did women with multiple polycystic ovaries. The aim of this study is to estimate the efficacy of preptin hormone for thyroid patients with diabetes.
keywords: Preptin, Thyroid dysfunction, Diabetes mellitus,
INTROdUCTION
Disorder of thyroid gland can be classified into: hypothyroidism and hyperthyroidism. In hypothyroidism mention to the usual pathological condition of TH inadequacy. If untreated, it can lead to significant contrary health impact and in the end loss of life1. The marks for diagnosis hypothyroidism
concentration of TH in tissues caused by elevated synthesis hormones, extreme free of performed TH an endogenous or exogenous extra thyroidal origin3.
The clinical features of hyperthyroidism ranges from a symptomatic to thyroid storm. Increased TH levels raise catecholamine signaling through elevated numbers of cell surface beta- adrenergic receptors 4.
Preptin is recently evolved peptides critical for controlling energy metabolism. Preptin is synthesized firstly in the pancreas, salivary gland, mammary tissue, and kidney. The first roles of preptin is controlling carbohydrate metabolism by moderating glucose-mediated insulin free.5 Preptin
was first isolated from the pancreatic beta-TC6-F7 cell lines of rats by Bucham and colleagues in 2001. Some peptide hormones show a high degree of resemblance. Scientists have classified certain hormones with analogne structures and distinguish in hormone families (e.g., the pro-opio melanocortin (POMC) hormone family)6. Diabetes manifested as a
group of metabolic disorders with a usual phenotype of elevated blood glucose level (hyperglycemia). A lot of factors contribute to this widely disease, like fatness, sedentary life-style and high blood pressure.
The pathogenic pathway involved in hyperglycemia involve autoimmune demolition of pancreatic insulin excreting cells (β-cells) leading to insulin lack and anomalies that give to insulin resistance.7,8 The aim of the study The measurement
of the concentration of the Preptin hormone, which is a recent study in terms of measuring the concentration in the serum of patients with thyroid dysfunction.
Subject
One hundred fifty individuals with age ranged between (20-45) year were enrolled in this study. They were divided into five groups: group one (G1) consisted of 30 hypothyroidism. The two group (G2) consisted of 30 patients with hyperthyroidism. And three group (G3) consisted of 30 healthy group, four group (G4) consisted of 30 patient with diabetes, and five group (G5) consisted of 30 patient with diabetes & hypothyroidism. The patients attended the specialized center for Endocrinology and Diabetes during June 2017 to August 2017. People with osteoporosis and heart disease were excluded as did women with multiple polycystic ovaries (PCOS).
Specimens Collection and analysis
Five milliliters of blood were collected from all fasting subjects The serum obtained was used to determination of Preptin, thyroid hormones [Thyroid-stimulating hormone (TSH), Total triiodothyronine (TT3), Total tetra iodothyronine (TT4)], fasting blood glucose (FBG), Hemoglobin A1c (HbA1c), Vitamin D3 (V. D3), Insulin resistance, Follicle-stimulating hormone (FSH), Luteinizing hormone (LH), and Calcium.
Methods
The Preptin hormone was measured according to Sandwich- Elisa technique, TT3, TT4, TSH were measured according to ELFA. Vitamin D3 was measured according to Competitive-ELISA. HbA1c was measured according to The Bio-Rad VARIANT Hemoglobin A1c programme, FSH and LH were measured according to sandwich immunodetection method. Glucose was determined after enzymatic oxidation in the presence of glucose oxidase (GOD), calcium was method is based on the specific binding of cresolftalein complexone (OCC), a metal-chromic indicator.
Statistical analysis
The data were statistically analyzed by using the computer IBM SPSS program version 25. The data were expressed as mean ± SE, ANOVA table and Duncan test were used to express the significant differences among the studied groups.
RESULTS ANd dISCUSSIONS
body Mass Index (bMI)
Fig. 1. bMI in studied groups according to the gender
Preptin Hormone
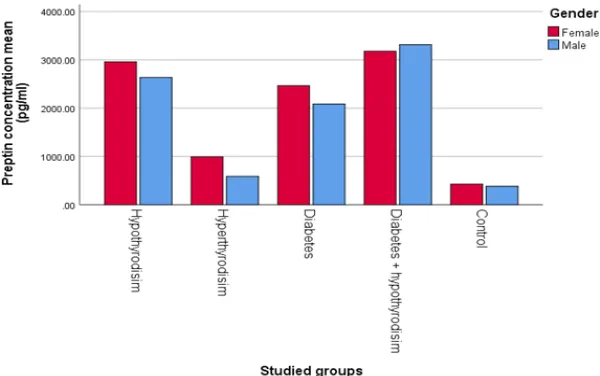
The mean value ± SE of BMI for hypothyroidism, hyperthyroidism, diabetes, diabetes & hypothyroidism, and control are respectively shown in Table (2). And Fig. (2) the results show a non- significant change in hyperthyroidism and control (p > 0.05) but result show a significant in hypothyroidism, diabetes, and diabetes & hypothyroidism (p ≤ 0.05). of males and females, there is no literature to explain the relationship between the hormone preptin and thyroid dysfunction, but the interpretation can be predicted the mechanism of hormone preptin that in
the case of hunger will need the body to energy and this energy comes from glucose and when eating a meal will rise blood sugar ratio, which leads to rise of insulin hormone and therefore increases the hormone preptin also in the case of hypothyroidism suffers from slow metabolism, high insulin hormones well as preptin hormone, vice versa in case of hyperthyroidism. But diabetes mellitus show a significant this is confirmed by literature where it was shown the concentration of preptin levels were higher in patients with diabetes mellitus.10
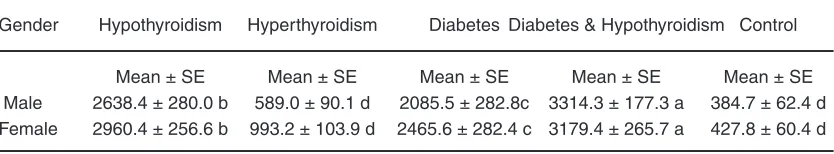
Table 2: Preptin concentration in studied groups according the gender
Gender Hypothyroidism Hyperthyroidism Diabetes Diabetes & Hypothyroidism Control
Mean ± SE Mean ± SE Mean ± SE Mean ± SE Mean ± SE
Male 2638.4 ± 280.0 b 589.0 ± 90.1 d 2085.5 ± 282.8c 3314.3 ± 177.3 a 384.7 ± 62.4 d Female 2960.4 ± 256.6 b 993.2 ± 103.9 d 2465.6 ± 282.4 c 3179.4 ± 265.7 a 427.8 ± 60.4 d
Similar letters: No significant difference (p > 0.05) between means Different letters: Significant difference (p ≤ 0.05) between means
Table 1: bMI studied groups according to the gender
Gender Hypothyroidism Hyperthyroidism Diabetes Diabetes & Hypothyroidism Control
Mean ± SE Mean ± SE Mean ± SE Mean ± SE Mean± SE
Male 37.9 ± 0.5 a 21.4 ± 0.5 a 34.9 ± 0.8 a 38.3 ± 0.4 a 25.0 ± 0.8 a
Female 38.1 ± 0.5 a 22.2 ± 0.5 d 35.9 ± 1.0 b 38.9 ± 0.3 a 24.9 ± 1.0 c
Fig. 2. Preptin concentration in studied groups according the gender
Fasting blood glucose (Fbg)
The mean value ± SE of FBG for hypothyroidism, hyperthyroidism, diabetes, diabetes & hypothyroidism, and control are respectively shown in Table (3) and Fig. (3) the results show a significant change of hypothyroidism, hyperthyroidism, and control compared with diabetes& hypothyroidism
and diabetes (p ≤ 0.05) in male and female. Note that the results of the statistics were high in diabetes & hypothyroidism and diabetes. The literature has shown that diabetes mellitus is a chronic heterogeneous illness in which there is dysregulation of carbohydrates, protein and lipid metabolism, leading to increased blood glucose levels11.
Fig. 3. Fg concentration in studied groups according the gender
Table 3: Fg concentration in studied groups according the gender
Gender Hypothyroidism Hyperthyroidism Diabetes Diabetes & Hypothyroidism Control
Mean ± SE Mean ± SE Mean ± SE Mean ± SE Mean ± SE
Male 88.0 ± 2.8 b 83.0 ± 2.1 b 332.8 ± 16.6 a 342.7 ± 25.5 a 89.9 ± 2.7 b Female 88.9 ± 2.7 b 88.4 ± 1.8 b 329.4 ± 17.6 a 343.0 ± 14.2a 88.9 ± 2.7 b Similar letters: No significant difference (p > 0.05) between means
HbA1c
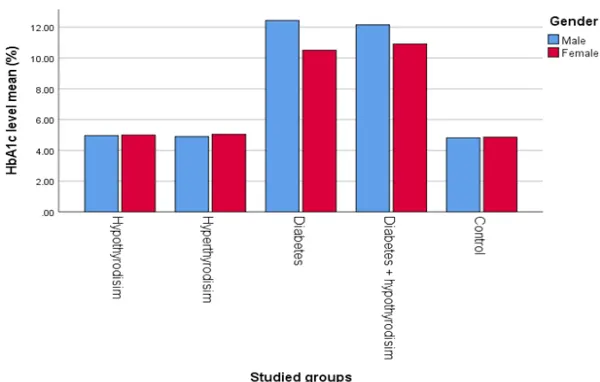
The mean value ± SE of HbA1c for hypothyroidism, hyperthyroidism, diabetes, diabetes & hypothyroidism, and control are respectively shown in Table (4) and Fig. (4) the results show a significant change of diabetes and diabetes & hypothyroidism compared with hypothyroidism, hyperthyroidism
and control (p ≤ 0.05) in male and female. The literature confirmed that Hba1c is a helpful foreteller of diabetes danger in childhood and can be applied to identify prediabetes in childhood with other type 2 diabetes danger factor with the same predictive value as FPG12.
Table 4: HbA1c concentration in studied groups according to the gender
Gender Hypothyroidism Hyperthyroidism Diabetes Diabetes & Hypothyroidism Control
Mean ± SE Mean ± SE Mean ± SE Mean ± SE Mean ± SE
Male 5.0 ± 0.1 b 4.9 ± 0.1 b 12.4 ± 0.6 a 12.2 ± 0.8 a 4.8 ± 0.1 b
Female 5.0 ± 0.1b 5.0 ± 0.1b 10.5 ± 0.4a 10.9 ± 0.8a 4.9 ± 1.5b
Similar letters: No significant difference (p > 0.05) between means Different letters: Significant difference (p ≤ 0.05) between means
Fig. 4. HbA1c concentration in studied groups according to the gender
Insulin Resistance (IR)
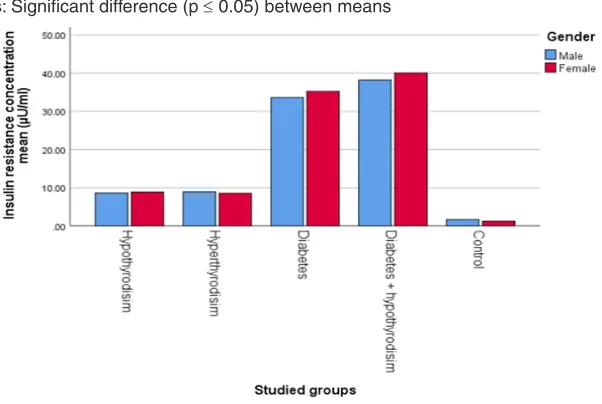
The mean value ± SE of BMI for hypothyroidism, hyper thyroidism, diabetes, diabetes & hypothyroidism, and control are respectively shown in Table (5) and Fig. (5) the results show a significant in diabetes, diabetes & hypothyroidism and control (p ≤ 0.05), but show non-significant in hypothyroidism and hyperthyroidism (p > 0.05) of male and female, in a thyroid disorder, thyroid hormones have a significant impact on glucose metabolism and the development of insulin resistance. In hyperthyroidism there are scarce studies of the impact of hypothyroidism on glucose metabolism than those assessing insulin resistance in patient with hyperthyroidism. In hyperthyroidism is a case involves a significant elevated in the level
of tissue metabolism13. IR is one of the key factors
in the pathogenesis of diabetes mellitus. The spread of thyroid disorders has elevated14 along with the
elevated spread of diabetes mellitus and IR globally in recent years.
Calcium
Table 5: Insulin resistance concentration in studied groups according to the gender
Gender Hypothyroidism Hyperthyroidism Diabetes Diabetes & Hypothyroidism Control
Mean ± SE Mean ± SE Mean ± SE Mean ± SE Mean ± SE
Male 8.6 ± 0.3 c 9.0 ± 0.4 c 33.6 ± 1.7 b 38.2 ± 2.3 a 1.7 ± 0.4 d
Female 8.9 ± 0.3c 8.6 ± 0.5c 35.2 ± 1.8b 40.1 ± 1.2a 1.3 ± 0.1d
Similar letters: No significant difference (p > 0.05) between means Different letters: Significant difference (p ≤ 0.05) between means
Fig. 5. Insulin resistance concentration in studied groups according to the gender.
Table 6: Calcium concentration in studied groups according the gender
Gender Hypothyroidism Hyperthyroidism Diabetes Diabetes& Hypothyroidism Control
Mean ± SE Mean ± SE Mean ± SE Mean ± SE Mean ± SE
Male 9.6 ± 0.1 a 9.6 ± 0.2 a 9.7 ± 0.2 a 9.6 ± 0.1 a 9.5 ± 0.2 a
Female 9.4 ± 0.2a 9.6 ± 0.2a 9.5 ± 0.2a 9.4 ± 0.2a 9.4 ± 0.2a
Similar letters: No significant difference (p > 0.05) between means Different letters: Significant difference (p ≤ 0.05) between means
Vitamin d3
The mean value ± SE of Vitamin D3 for hypothyroidism, hyperthyroidism, diabetes, diabetes & hypothyroidism, and control are respectively shown in Table (7) and Fig. (7) The results show a non-significant change of all groups (p > 0.05) in male and female. This is because the samples should be free from osteoporosis and the appearance of a non- significant change is evidence that people are healthy and without osteoporosis shown in Figure (3).
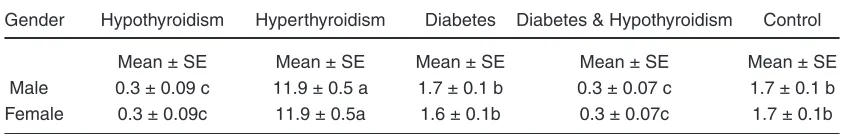
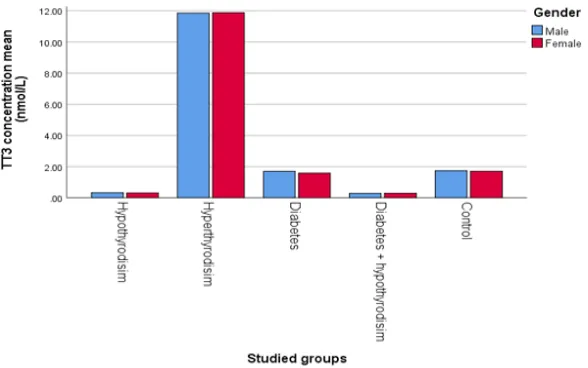
TT3
The mean value ± SE of TT3 for
hypothyroidism, hyperthyroidism, diabetes, diabetes & hypothyroidism, and control are respectively shown in Table (8) and Fig. (8) the results show a significant change of hyperthyroidism compared with other groups (p ≤ 0.05) in male and female. According to the literature which confirmed that in the case of hypothyroidism there is not enough production of T3, it is considered the most common condition in puberty. While in the case of hyperthyroidism the thyroid gland increased amounts of T315. This
confirms the validity of the results research and their conformity with the literature.
Table 7: Vitamin d3 concentration in studied groups according to the gender
Gender Hypothyroidism Hyperthyroidism Diabetes Diabetes & Hypothyroidism Control
Mean ± SE Mean ± SE Mean ± SE Mean ± SE Mean ± SE
Male 42.6 ± 0.6 a 44.3 ± 1.6 a 43.7 ± 1.0 a 43.4 ± 0.7 a 43.5 ± 1.6 a
Female 43.9 ± 1.0a 42.3 ± 1.5a 42.9 ± 0.8a 43.1 ± 0.8a 43.0 ± 1.5a
Similar letters: No significant difference (p > 0.05) between means Different letters: Significant difference (p ≤ 0.05) between means
Fig. 7. Vitamin d3 concentration in studied groups according to the gender
Table 8: TT3 concentration in studied groups according to the gender
Gender Hypothyroidism Hyperthyroidism Diabetes Diabetes & Hypothyroidism Control
Mean ± SE Mean ± SE Mean ± SE Mean ± SE Mean ± SE
Male 0.3 ± 0.09 c 11.9 ± 0.5 a 1.7 ± 0.1 b 0.3 ± 0.07 c 1.7 ± 0.1 b
Female 0.3 ± 0.09c 11.9 ± 0.5a 1.6 ± 0.1b 0.3 ± 0.07c 1.7 ± 0.1b
Fig. 8. TT3 concentration in studied groups according to the gender
TT4
The mean value ± SE of TT4 for hypothyroidism, hyperthyroidism, diabetes, diabetes & hypothyroidism, and control are respectively shown in Table (9). The mean value ± SE of TT4 for hypothyroidism, hyperthyroidism, diabetes, diabetes & hypothyroidism, and control are respectively shown in Table (8) and Figure the results show a significant
change of hyperthyroidism compared with other groups (p ≤ 0.05) in male and female. According to the Duncan test. The main reason for the emergence of a result T4 high in the case of hyperthyroidism is the thyroid gland free increased amounts of T4, but hypothyroidism there is not enough production of T415, this confirms the validity of the results research
and their conformity with the literature.
Table 9: TT4 concentration in studied groups according to the gender
Gender Hypothyroidism Hyperthyroidism Diabetes Diabetes & Hypothyroidism Control
Mean ± SE Mean ± SE Mean ± SE Mean ± SE Mean ± SE
Male 33.5 ± 2.1 c 142.6 ± 3.0 a 88.4 ± 1.0 b 34.4 ± 2.7 c 90.5 ± 3.3 b
Female 36.0 ± 2.8c 145.8 ± 3.5a 88.9 ± 4.0b 33.0 ± 2.2c 92.5 ± 3.7b
Similar letters: No significant difference (p > 0.05) between means Different letters: Significant difference (p ≤ 0.05) between means
Thyroid-Stimulating Hormone (TSH)
The mean value ± SE of TSH for hypothyroidism, hyperthyroidism, diabetes, diabetes & hypothyroidism, and control are respectively shown in Table (10) and Fig. (10) the results show a significant differences in control and diabetes
compared with other groups, previous literature showed that the first test to know that the patient is infected with hypothyroidism is that test TSH is high this is confirmed by the results in the case of hypothyroidism and diabetes & hypothyroidism16.
Table 10: TSH concentration in studied groups according to the gender
Gender Hypothyroidism Hyperthyroidism Diabetes Diabetes & Hypothyroidism Control
Mean ± SE Mean ± SE Mean ± SE Mean ± SE Mean ± SE
Male 38.8 ± 3.0 b 0.1 ± 0.02 d 1.8 ± 0.4 c 47.6 ± 2.8 a 1.6 ± 0.3 c
Female 32.6 ± 3.4b 0.1 ± 0.02d 1.9 ± 0.3c 38.0 ± 4.2a 2.2 ± 0.4c
Similar letters: No significant difference (p > 0.05) between means Different letters: Significant difference (p ≤ 0.05) between mean
Fig. 10: TSH concentration in studied groups according to the gender
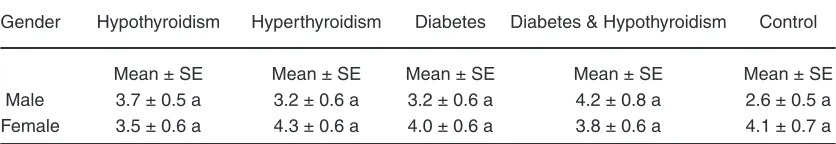
Luteinizing hormone (LH)
The mean value ± SE of LH for hypothyroidism, hyperthyroidism, diabetes, diabetes & hypothyroidism, and control are respectively shown in Table (11) and Fig. (11) the results show
a non-significant change of all groups (p > 0.05) in male and female, the main reason for show a non-significant change is that the samples should be uninfected with multiple polycystic ovaries in females, and males should be infertile.
Table 11: LH concentration in studied groups according to the gender
Gender Hypothyroidism Hyperthyroidism Diabetes Diabetes & Hypothyroidism Control
Mean ± SE Mean ± SE Mean ± SE Mean ± SE Mean ± SE
Male 3.7 ± 0.5 a 3.2 ± 0.6 a 3.2 ± 0.6 a 4.2 ± 0.8 a 2.6 ± 0.5 a
Female 3.5 ± 0.6 a 4.3 ± 0.6 a 4.0 ± 0.6 a 3.8 ± 0.6 a 4.1 ± 0.7 a
Fig. 11. LH concentration in studied groups according to the gender
Follicle-Stimulating Hormone (FSH)
The mean value ± SE of FSH for hypothyroidism, hyperthyroidism, diabetes, diabetes & hypothyroidism, and control are respectively shown in Table (12). The results show a non-significant
change of all groups (p > 0.05) in male and female, the main reason for show a non-significant change is that the samples should be uninfected with multiple polycystic ovaries in females, and males should be infertile.
Table 12: FSH concentration in studied groups according to the gender
Gender Hypothyroidism Hyperthyroidism Diabetes Diabetes & Hypothyroidism Control
Mean ± SE Mean ± SE Mean ± SE Mean ± SE Mean ± SE
Male 5.8 ± 0.6 a 5.2 ± 0.6 a 5.5 ± 0.6 a 5.1 ± 0.6 a 5.5 ± 0.7 a
Female 5.7 ± 0.6a 6.3 ± 0.6a 5.9 ± 0.5a 6.3 ± 0.4a 6.0 ± 0.6a
Similar letters: No significant difference (p > 0.05) between means Different letters: Significant difference (p ≤ 0.05) between means
CONCLUSION
The results of the current study proved that the hormone preptin increased concentration in the case of hypothyroidism, hypothyroidism & diabetes and diabetes, while there is no change in concentration in the case of hyperthyroidism.
Other life variables were also studied BMI where the results showed higer females compared with male in all groups, and a rise in the TSH in hypothyroidism and diabetes & hypothyroidism
compared with other group, while shown low result in hyperthyroidism compared with other groups.
But calcium, vitamin D3, FSH, and LH were non- significant because of people with osteoporosis and heart disease were excluded as did women with multiple polycystic ovaries.
ACkNOwLEdgMENT
I would like to thank Department of Chemistry, Faculty of Education Ibn Al-Haytham for Science, University of Baghdad, to complete this article.
REFERENCES
1. Carle A., Pederson I., Kundsen N., Perrild H., Ovesen L., and Laurbery P.,“Gender differences in symptoms of hypothyroidism: a population-based Dan Thyr study.” Clin Endocrinal., 2015, 83, 717-25.
2. Chen Z., and Hetzal B., “Cretinism Revisited” Clinical Endocrinology and Metabolism.,
2010, 24, 39-50.
3. Igork K., “Hyperthyroidism: Diagnosis and treatment” Am fam physican., 2016, 39, 363-370. 4. Silva J., and Bianco S., “Thyroid-adrenergic
interactions: physiological and clinical implications. Thyroid., 2008, 18, 157-165. 5. Harris R., Dijkstra P., and Hofmann H.,
“Complex structural and regulatory evolution of the pro-opiomelanocortin gene family.” Gen com Endocrinol., 2014, 195, 107-15. 6. Ibrahim M., Suttan S., Amal S., Alhanouf
M., Fandiyyah R., Noor N., and Zuhur N.,“Prevalence of thyroid dysfunction in diabetes patients.” J diabetes Metab Disord Control., 2017, 4, 2-7.
7. Bharthankar S., Madole M., Somwanshi S., and Ganjewar V., “Evaluation of thyroid hormones in patients with type II diabetes mellitus.” Journal of medical education and research., 2013, 3(2). 100-15.
8. Hassan M., “Impact of obesity on serum levels of thyroid hormones among euthyroid Saudi adult.” Journal of thyroid research., 2017, 5, 105-111. 9. Gangyi Y., Ling L., Wenwen C., Hua L.,
Guenther B., and Ke L., “Circulating preptin in normal, impaired glucose tolerance, and type 2 diabetes subjects” Original Article.,
2009, 41, 1.
10. Anjali G., Siddhrth K., Padmavathi B., Rajan S., Mamatha G., Sandeep K., Sayak R., and Mohit S., “Elevation of correlation of blood glucose and salivary glucose level in known diabetic patients” Journal of clinical and diagnostic research., 2015, 9, 106-109. 11. Pavithra V., Robert G., Robert L., William C.,
and Madhumita S., “ HbA1c and the prediction of type 2 diabetes in children and adults.,
2017, 40, 16-21.
12. Dimitriadis G, Mitrou P, Lambadiari V., and et al. “Insulin-stimulated rates of glucose uptake in muscle in hyperthyroidism: the importance of blood flow. J Clin Endocr Metab., 2008, 93, 2413–2415.
13. Marcin G., Joanna G., and Roman J., “Insulin resistance and thyroid disorders” JIDA., 2014, 25(4), 2132-2140.
14. Igork K., “Hyperthyroidism: Diagnosis and treatment” Am fam physican., 2016, 39, 363-370.
15. Ujihara M., Yamamoto K., Nomura K., Toyoshima S., Demura H., Nakamura Y., Ohmura K., and Osawa T.,"Subunit-specific sulphation of oligosaccharides relating to charge-heterogeneity in porcine lutrophin isoforms". Glycobiology., 1992, 2, 225–31. 16. Shlomo M., Mbchb M ., Kenneth S., Ian