http://www.sciencepublishinggroup.com/j/aap doi: 10.11648/j.aap.20190402.11
ISSN: 2471-9692 (Print); ISSN: 2471-9714 (Online)
The Effects of Salt and Water Loading on Kidney Function
in Healthy Undergraduates
Ehmann Peter J.
1, Brush Christopher J.
1, 2, Bozzini Brittany
1, Dowden Robert A.
1, Ogilvie Anna
1,
Wisniewski Paul J.
1, Bernard Laura P.
1, Merrill Gary F.
1, *1Department of Cell Biology and Neuroscience, Rutgers University, Piscataway, USA
2
Department of Psychology, Florida State University, Tallahassee, USA
Email address:
*
Corresponding author
To cite this article:
Ehmann Peter J., Brush Christopher J., Bozzini Brittany, Dowden Robert A., Ogilvie Anna, Wisniewski Paul J., Bernard Laura P., Merrill Gary F. The Effects of Salt and Water Loading on Kidney Function in Healthy Undergraduates. Advances in Applied Physiology. Vol. 4, No. 2, 2019, pp. 11-18. doi: 10.11648/j.aap.20190402.11
Received: October 8, 2019; Accepted: November 6, 2019; Published: November 17, 2019
Abstract:
Rutgers University juniors and seniors enrolled in Systems Physiology Laboratory (01:146:356) Spring, 2019. One-hundred forty-five students volunteered to test the effects of salt and water loading on kidney function. Students were investigated beginning at 8:40 a.m., 1:40 p.m., and 6:40 p.m. They were approximately evenly distributed between male and female genders and were of multiple cultural/ethnic backgrounds. Upon entering the laboratory baseline data were collected. Approximately half of the volunteers then consumed 200 mL of a 2.0% NaCl solution (n=77). The others directly consumed 1.0 L of tap water (n=68). Upon entering the laboratory baseline data were collected. The others directly consumed 1.0 L of tap water. Kidney function was monitored each 30 minutes for the next 90 minutes. Under baseline conditions, urine osmolality was elevated in all students (≥ 280 mOsm/kg) but was significantly (P<0.05) greater in the 8:40 a.m. group than in either of the p.m. groups. Urine specific gravity and sodium excretion were also elevated in the 8:40 a.m. group compared to the others. Urine flow rate was least in the 8:40 group and greatest in the 1:40 p.m. group. We conclude that in these students renal function was influenced by a diurnal pattern. We also conclude that without compelling incentives (e.g. financial, grade-influencing) it was virtually impossible to get students to comply with pre-experimental instructions (e.g. no salt-laden meals after 6:00 p.m. before the day of experimentation).Keywords: Dehydration, Salt Loading, Urine Osmolality, Water Balance, Water Loading, Sodium Excretion, Urine Flow
1. Introduction
Physiological kidney function is one of the sine qua non of good health [1, 2]. In medicine clinicians have been using the estimated glomerular filtration rate (eGFR) for the past 15-20 years as an indicator of renal function [3-5]. There are many other estimates of kidney function as well, including volume of urine excreted and frequency of urination. The latter two, coupled with measures of urine osmolality, urine specific gravity, and urinary sodium excretion, are excellent and standard measures of body water content and therefore of the degree of hydration/dehydration [6-8]. We use these measures routinely in a laboratory experiment designed to teach kidney function to juniors and seniors planning careers
in medicine and related health sciences professions (e.g. physician assistants, physical/occupational therapy, etc.).
2. Methods
Experimental subjects were students enrolled in Systems Physiology Laboratory (01:146:357) at Rutgers University, New Brunswick/Piscataway, New Jersey, in the Spring Semester, 2019. Upon arriving in the lab subjects (n=145) were divided into two, salt- and water-consuming groups. As they arrived in the laboratory all students were sent to the restrooms to empty their bladders and to obtain urine samples. After this students in the salt group (n=77) quickly consumed 200 mL of a 2.0% salt solution. Students in the water group (n=68) drank 1.0 L of tap water as quickly as possible. Thereafter, timers were set and each student subsequently collected additional urine samples at 30, 60 and 90 minutes post-consumption of their respective drinks. Measurements of urine flow rate, specific gravity, NaCl concentration and osmolality were made/calculated on each sample. Students handled only their own urine, and this and other experiments in this experimental physiology laboratory course have been reviewed and approved by Rutgers University.
Specimen containers were graduated and full at 100-120 ml. If the volume of urine voided exceeded 100-120 ml, students dumped the first volume in the toilet and continued collecting the remaining volume. To estimate their rates of urine flow (mL/min), students noted the volume markings on specimen cups. They then divided the volume (mL) by the time elapsed (min) since the last urine collection.
Specific gravity---Specific gravities of each urine sample were estimated using refractometry (refractometers, ExTech Instruments, model RF20, China). With the prism cover slip open and the prism cleaned, students calibrated their refractometers by carefully dispensing 2-3 drops of distilled, deionized water (dH2O) onto the prism. They moved the cover
slip to the closed position and waited several seconds for the fluid to be evenly distributed across the prism. Holding the refractometer to an eye and parallel to the floor, they used the adjustable screw to set the refractive index scale to 1.000. The prism was once again cleaned, and students carefully dispensed 2-3 drops of urine onto the prism. They moved the cover slip to the closed position and waited several seconds for the urine sample to be evenly distributed across the prism. They then observed and recorded the specific gravity for each sample.
Sodium chloride concentration (mg/mL)---Using micropipettes students transferred approximately 500 µL of urine into clean test tubes and then added 100 µL potassium chromate. To this they added 100 µL aliquots of a 2.9% silver nitrate solution (AgNO3), incrementally, while gently
shaking the sample as each aliquot was added, until the yellow-colored urine turned a brown hue. They recorded the total volume of silver nitrate needed to make the colorimetric change. Each 100 µL of 2.9% silver nitrate added represented approximately 0.15 mg NaCl in 500 µL (i.e., 100 µL of AgNO3 = 0.3 mg NaCl/ml.). They calculated the NaCl
concentration (mg/mL) in the urine as: [NaCl] = [(µL AgNO3) X (0.3mg NaCl/ml urine)].
Osmolality--- Osmolality---Under baseline conditions and at each 30-minute timed interval graduate student teaching assistants (TAs) received 20 µl urine samples from experimental subjects and analyzed osmolalities (mOsm/L, model 2020 osmometer, Advanced Instruments, Norwood, MA). Osmometers were previously calibrated using standard sodium chloride solutions of 50, 280, 750 and 1200 mOsm/L. Between each 30-minute collection/calculation period, TAs led 10-minute discussions on the physiology of kidney function (power point mini-lectures). Students were asked to not consume excess salt and/or water during the 24 hours prior to initiation of the experiment.
Statistics
As data were collected they were recorded on a white board so all participants could see and make records of them. No records were kept that would allow any participant to be identified (data were confidential). The grouped data were later used by students to complete written laboratory reports.
Baseline data (3 levels; 8:40 a.m., 1:40 p.m., 6:40 p.m.) were analyzed with a one-way ANOVA. Pairwise comparisons were conducted using Tukey’s HSD test for renal variables with significant ANOVA results. Effects over time (4 levels; baseline, 30min, 60min, 90min) for each experimental group (2 levels; salt, water) were analyze with a repeated-measures ANOVA. Pairwise comparisons were conducted using Tukey’s HSD test for renal variables with a significant Time x Group interaction. All data are reported as mean plus or minus one standard deviation. Statistically significant results were identified at P<0.05.
3. Results
3.1. Baseline Data
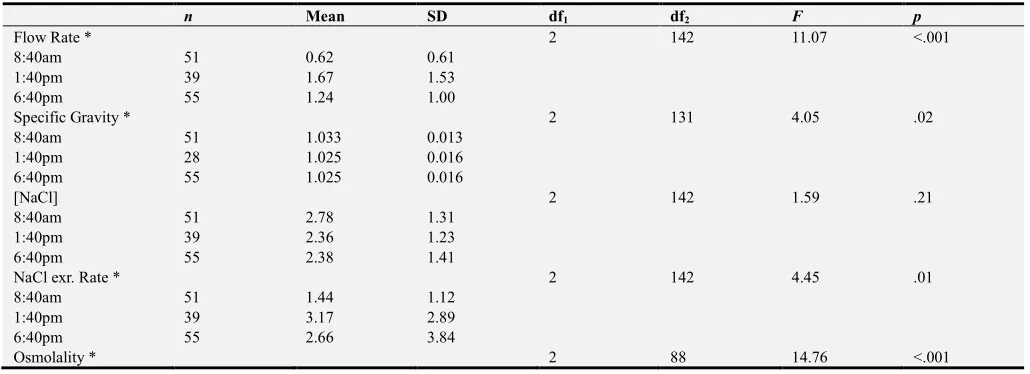
Results of the one-way ANOVA and descriptive statistics are presented in Table 1. Pairwise comparisons for each variable with significant ANOVA results are presented in Table 2. Flow rate was significantly lower at 8:40 a.m. compared to the p.m. times. Urine specific gravity was only significantly different between 8:40 a.m. and 6:40 p.m. times, with the former being greater. No differences were observed over time in urine NaCl concentration at baseline. NaCl excretion rate was significantly different between 8:40 a.m. and 1:40 p.m. times, with the former being lower. Urine osmolality was significantly greater at 8:40 a.m. than both the 1:40 p.m. and 6:40 p.m. time points.
3.2. Group Differences over Time
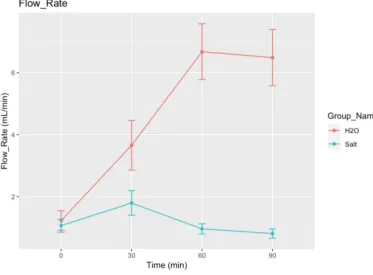
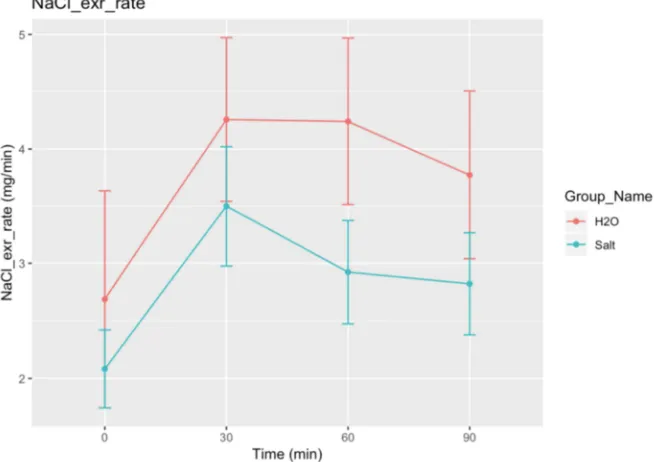
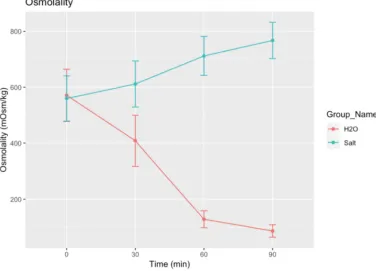
Figures 1-5 display group differences in each variable over time (bounded by 95% confidence interval). Importantly, no differences were observed between groups for any variable at baseline (indicating proper random group assignment).
significantly to about 0.8 ml/min (P<0.05, Figure 1).
Figure 1. Influence of tap water vs a 2.0% solution of NaCl on the rate of urine flow.
Urine specific gravity---On the average and relative to baseline conditions, the specific gravity of urine in the water group declined significantly (P<0.05) at 30, 60, and 90 minutes post-consumption. Conversely, there was a trend (at
60 and 90 minutes post-consumption) for specific gravity to increase in the group that consumed 2.0% NaCl which did reach statistical significance relative to baseline (P<0.05, Figure 2).
Urine sodium chloride concentrations---Urinary sodium chloride concentrations increased significantly in the salt group and decreased significantly in the tap water group (Figure 3).
Figure 3. Influence of tap water and a 2.0% NaCl solution on the concentration of sodium chloride in the urine.
For example, under baseline conditions, salt concentrations in the urine were about 2.5 mg/dl in both groups. In the salt group this rose to 2.7, 3.5 and 3.9 mg/dl, on the average at 30, 60, and 90 minutes, respectively, post-consumption. Conversely, corresponding figures in the water group at 30, 60, and 90 minutes were, 1.7, 0.7 and 0.6 mg/dl.
Urinary sodium chloride excretion---Relative to baseline
conditions, the rates of excretion of sodium chloride in both groups of subjects were elevated throughout the experiment (i.e. 30-90 minutes following consumption of tap water and a 2.0% solution of NaCl). At 60 minutes the rates were significantly lower (P<0.05) in the salt group than in the water group (Figure 4).
Figure 4. Rates of excretion of sodium chloride following consumption of tap water and salt solutions in experimental subjects.
Figure 5. Differences in urine osmolality in subjects after consuming 1.0 liters of tap water and 200 mL of a 2.0% NaCl solution.
Urine osmolality---On the average urine osmolality was close to 560 mOsm/kg under baseline conditions in both groups of students. It rose steadily but modestly to about 800 mOsm/kg in the salt group at 90 minutes, and declined significantly to about <100 mOsm/kg at the same time in the water group. In the salt group urine osmolality was only statistically significant at 90 minutes (relative to baseline, Figure 5), whereas in the water group it was significantly different than baseline at 60 and 90 minutes.
4. Discussion
The kidneys are the chief regulators of the internal environment of the body (internal milieu as opposed to the external milieu). They help control the concentration of ions, water, and pH in the several body water compartments (intracellular space, interstitial space, intravascular space). In addition, kidneys eliminate waste products of metabolism. The nearly one million nephrons in each kidney contain two main structures: the glomeruli (glomerulus, singular) and the renal tubules. As blood passes through the kidneys it is filtered by the glomeruli at a rate of approximately 120 ml/min, (in healthy adult humans; known as the glomerular filtration rate, GFR).
Chemically, the glomerular filtrate is similar to blood plasma except that large molecules having molecular weights of more than 70 kD are excluded (e.g., plasma proteins). As this glomerular filtrate (also known as an ultrafiltrate) passes along the proximal and distal tubules most of the water is reabsorbed, and many other inorganic and some organic chemicals are actively or passively reabsorbed back into the bloodstream. Toxic byproducts of metabolism, as well as
substances in excess, are retained in the ultrafiltrate or are secreted into the ultrafiltrate and finally excreted in the urine (urine flow rate is approximately 0.3 – 3.0 ml/min; diurnal variation). Thus the final composition of urine is quite different from that of the glomerular ultrafiltrate and reflects the integrity of kidney function and changes in blood composition.
An analysis of urine can yield valuable information about the health of the kidney and of the body in general. Various diseases are characterized by altered metabolism, which causes unwanted byproducts of metabolism to appear in the urine. For example, phenyl pyruvic acid appears in the urine in phenylketonuria (PKU), a disease resulting in mental retardation. In diabetes mellitus, deficient production of insulin by the pancreas results in the appearance of glucose in the urine (glucosuria). Thus, the volume of urine produced, its rate of flow, urine osmolality and specific gravity, and related qualities give information on the state of hydration or dehydration of the body.
reducing its excretion in the urine.
Arginine vasopressin, so named because its vasopressor (vascular) effects were identified before its renal effects were, enhances the production and subcellular movement of proteins known as ‘aquaporins’ [13, 14-16]. These protein water channels are inserted into the apical membranes of tubular epithelial cells where they enhance the ability of tubules to reabsorb water, thus conserving it. Although we did not measure AVP, aquaporins, or related compounds in this experiment, our speculation is reasonable because it is based on irrefutable, supporting evidence [17-21].
Urine osmolality---Significantly reduced urine flow rates at 8:40 a.m. were not expected. Based on diurnal patterns in humans, urine flow rates are lowest in the late p.m. to early a.m. hours, and highest in the late a.m. to early p.m. hours [22, 23]. We suspect the reduced flow was caused by hyperosmolality as baseline data suggest (e.g. see Figure 5, baseline values in both water and salt groups). University students, as a rule, lead unregulated dietary lifestyles. This includes eating at any time of the day, e.g. ordering pizza with extra sauce, pepperoni, and cheese after midnight (personal communications). Similarly, it is common for university students to visit sushi bars in the late p.m. to early a.m. hours, where they consume extra soy sauce (salt laden) with their sushi (personal communications). We believe it is their generally-poor dietary habits that best explain high urine osmolality at 8:40 a.m. in university students.
Hypothalamic osmoreceptors would have been stimulated by elevated plasma osmolality (pizza, sushi, salt) leading to increased release of AVP from the neurohypophysis. The subsequent increased insertion of aquaporins into apical membranes of renal tubular cells would have promoted tubular water conservation leading to increased urine osmolality. Support for this reasoning can be confirmed by carefully reviewing the data in Figures 1-4.
Water and salt balance---The distribution and regulation of body water is tightly coupled to fluid osmolality. Likewise, the regulation of osmolality is physiologically determined by
the regulation of body water [24-27]. For example, intracellular fluid volume is determined, in part, by the osmolality of extracellular fluid, including plasma osmolality. As extracellular fluid sodium concentration increases post-consumption of a salt-loaded meal, so too will extracellular osmolality increase. Among other physiological events, this will lead to withdrawal of water from the intracellular compartment (by osmosis), and to stimulation of hypothalamic osmoreceptors. Thirst mechanisms will be simultaneously activated driving the person to consume water.
During a 24-hour period following salt loading, salt concentration in the intravascular compartment will begin to decline (with renal water conservation and corresponding thirst-driven water consumption). Decreasing salt concentrations in the extracellular compartment will be accompanied by a decrease in the osmolality of the hypothalamic, interstitial spaces and to a reduction in the release of neurohypophyseal AVP. With reduced AVP, epithelial cells in the distal renal tubules will recycle apical aquaporins and water reabsorption will decrease. Physiological homeostasis for the distribution of body water and salt in the student will be re-achieved until the next craving pizza/sushi in the late p.m./early a.m. hours.
5. Conclusions
Students consuming a 2% solution of NaCl had lower rates of urine flow and higher urine osmolalities than those consuming tap water. Principles of renal water conservation and renal excretion of excess salt were confirmed in this routine experiment on body water and salt homeostasis. Disappointingly, most students had hyperosmotic urine even during the baseline period. This suggests the unwillingness of students to comply with experimental instructions, e.g. please do not consume excess salt and/or water during the 24 hours prior to this classic renal experiment.
Appendix
Table 1. One-way ANOVA results and descriptive statistics (M ± SD) analyzing effect of time of day on renal variables.
n Mean SD df1 df2 F p
Flow Rate * 2 142 11.07 <.001
8:40am 51 0.62 0.61
1:40pm 39 1.67 1.53
6:40pm 55 1.24 1.00
Specific Gravity * 2 131 4.05 .02
8:40am 51 1.033 0.013
1:40pm 28 1.025 0.016
6:40pm 55 1.025 0.016
[NaCl] 2 142 1.59 .21
8:40am 51 2.78 1.31
1:40pm 39 2.36 1.23
6:40pm 55 2.38 1.41
NaCl exr. Rate * 2 142 4.45 .01
8:40am 51 1.44 1.12
1:40pm 39 3.17 2.89
6:40pm 55 2.66 3.84
n Mean SD df1 df2 F p
8:40am 38 738 279
1:40pm 22 481 230
6:40pm 31 412 260
Note: Sample size is much lower for Osmolality because graduate student TA did have enough time to collect all students’ samples. Tukey HSD pairwise comparisons for significant results are presented in Table 2.
Table 2. Tukey HSD pairwise comparisons for variables with significant ANOVA results.
difference 95% CI lower 95% CI upper p adj
Flow Rate
2 – 1 * 1.048 0.511 1.586 <.001
3 – 1 * 0.618 0.127 1.109 <.01
3 – 2 -0.431 -0.960 0.098 .13
Specific Gravity
2 – 1 -0.007 -0.016 0.001 .09
3 – 1 * -0.008 -0.144 -0.001 .03
3 – 2 -0.001 -0.008 0.008 .99
NaCl exr. rate
2 – 1 * 1.728 0.279 3.178 .01
3 – 1 1.223 -0.102 2.547 .08
3 – 2 -0.506 -1.933 0.920 .68
Osmolality
2 – 1 * -257 -424 -90 <.01
3 – 1 * -326 -477 -175 <.001
3 – 2 -69 -242 105 .61
Note: 1 = 8:40am, 2 = 1:40pm, 3 = 6:40pm. Comparisons are significant if zero does not fall within the 95% CI. Adjusted p-values are shown.
References
[1] Pitts, RF. Physiology of the kidney and body fluids. Year Book Medical Publishers, Inc., Chicago, 1963.
[2] Qian Q. Salt, water and nephron: mechanisms of action and link to hypertension and chronic kidney disease. Nephrology (Carlton). Suppl 4: 44-49, 2018.
[3] Bertolo RG, Zargar H, Autorino R, Fiori C, Kaouk JH, Russo P, Thompson RH, Porpiglia F. Estimated glomerular filtration rate, renal scan and volumetric assessment of the kidney before and after partial nephrectomy: a review of the current literature. Minerva Urol Nephrol. 69: 539-547, 2017.
[4] Hornum M, Feldt-Rasmussen B. Drug dosing and estimated renal function: any step forward from Effersoe? Nephron. 136: 268-272, 2017.
[5] Luis-Lima S, Porrini E. An overview of errors and flaws of estimated GFR versus true GFR in patients with diabetes mellitus. Nephron. 136: 287-291, 2017.
[6] Armstrong LE, Johnson EC. Water intake, water balance, and the elusive daily water requirement. Nutrients. 10: E1928. doi: 10.3390/nu10121928, 2018.
[7] Marcolini EG, Putnam AT, Aydin A. History and perspectives on nutrition and hydration at the end of life. Yale J Biol Med. 91: 173-176, 2018.
[8] Perrier ET. Shifting focus: from hydration for performance to hydration for health. Ann Nutr Metab. 70 Suppl 1: 4-12, 2017.
[9] Zaidi M, New MI, Blair HC, Zallone A, Baliram R, Davies TF, Cardozo C, Iqbal J, Sun L, Rosen CJ, Yuen T. Actions of pituitary hormones beyond traditional targets. J Endocrinol. 237: R83-R98, 2018.
[10] Singh AT, Mc Causland FR. Osmolality and blood pressure stability during hemodialysis. Semin Dial. 30: 509-517, 2017.
[11] van Gastel MDA, Torres VE. Polycystic Kidney Disease and the Vasopressin Pathway. Ann Nutr Metab. 70: 43-50, 2017.
[12] Nevéus T. Pathogenesis of enuresis: towards a new understanding. Int J Urol 24: 174-182, 2017.
[13] Olesen ET, Fenton RA. Aquaporin-2 membrane targeting: still a conundrum. Am J Physiol Renal Physiol. 312: F744-F747, 2017.
[14] Pavlov TS, Staruschenko A. Involvement of ENaC in the development of salt-sensitive hypertension. Am J Physiol Renal Physiol. 313: F135-F140, 2017.
[15] Bai JJ, Tan CD, Chow BKC. Secretin, at the hub of water-salt homeostasis. Am J Physiol Renal Physiol. 312: F852-F860, 2017.
[16] Verkerk AO, Lodder EM, Wilders R. Aquaporin channels in the heart: physiology and pathophysiology. Int J Mol Sci. Apr 25; 20 (8). pii: E2039. doi: 10.3390/ijms20082039, 2019.
[17] Abir-Awan M, Kitchen P, Salman MM, Conner MT, Conner AC, Bill RM. Inhibitors of mammalian aquaporin water channels. Int J Mol Sci. Mar 29; 20 (7). pii: E1589. doi: 10.3390/ijms20071589, 2019.
[18] He J, Yang B. Aquaporins in renal diseases. Int J Mol Sci. Jan 16; 20 (2). pii: E366. doi: 10.3390/ijms20020366, 2019.
[19] Nakada T, Kwee IL. Fluid dynamics inside the brain barrier: current concept of interstitial flow, lymphatic flow, and cerebrospinal fluid circulation in the brain. Neuroscientist. 25: 155-166. 2019.
[21] Verkman AS, Smith AJ, Phuan PW, Tradtrantip L, Anderson MO. The aquaporin-4 water channel as a potential drug target in neurological disorders. Expert Opin Ther Targets. 21: 1161-1170, 2017.
[22] Mills JN. Diurnal rhythm in urine flow. J Physiol. 113: 528-36, 1951.
[23] Sharp GW. Persistence of the diurnal rhythm of flow of urine. Nature. 193: 37-41, 1962.
[24] Goh MY, Millard MS, Wong ECK, Berlowitz DJ, Graco M, Schembri RM, Brown DJ, Frauman AG, O'Callaghan CJ. Comparison of diurnal blood pressure and urine production between people with and without chronic spinal cord injury. Spinal Cord. 56: 847-855, 2018.
[25] Claybaugh JR, Sato AK, Crosswhite LK, Hassell LH. Effects of time of day, gender, and menstrual cycle phase on the human response to a water load. Am J Physiol Regul Integr Comp Physiol. 279: R966-973, 2000.
[26] Boncompain-Gérard M, Robert D, Fouque D, Hadj-Aïssa A. Renal function and urinary excretion of electrolytes in patients receiving cyclic parenteral nutrition. J Parenter Enteral Nutr. 24: 234-239, 2000.