LAND USE AND LAND COVER CHANGE DETECTION THROUGH REMOTE SENSING APPROACH:
A CASE STUDY IN THE PARTS OF PUDUKKOTTAI DISTRICT, TAMIL
Department of Industries and Earth Sciences, Tamil University,
ARTICLE INFO ABSTRACT
Land use and land cover is an important component in understanding the interactions of the human activities with the environment and thus it is necessary to be able to simulate changes. Empirical observation revealed a change in land use land cover classification in the parts of Pudukkottai District Tamil Nadu state. In this paper an attempt is made
the study area 10 years period (2003
satellite imageries data (Path153, Row053, acquired on 30 meter resolution image). The image characteristics like
were considered for interpretation and to achieve it initial identification of different land use classes was pointed out on the image before carrying out the image classi
image was also carried out. The satellite digital data was rectified using Survey of India (SOI) to posheets and field visits in the parts of Pudukkottai District accessibility is the main reason to exploitation of land
land use/land cover maps were integrated in GIS environment. In 2003, dense trees cover, agriculture and water bodies dominated the entire study area, covering a total of 110
fourth largest land cover corresponds to
followed by current fallow land (5.8%), sandy area (4.2%), Land with Scrub (3.4%), Barren land (1.5%) and built up land (1.4%).
Copyright ©2016, R.Kayalvizhi and K.Sankar. This is an open access article distributed under the Creative Commons Att unrestricted use, distribution, and reproduction in any medium, provided the original work is properly cited.
INTRODUCTION
Land and its coverage’s of agricultural / features is the most important natural resources that could play a vital role in the life of not only human beings, but also the entire collection of all living beings which area includes plants and animals and the development of land use / land cover in spatio
/ sequences would be provide the basic foundation for planning, development and evaluation of lands and its resources and related activities.Land use and land cover illustrates man’s pursuit in ancient / modern civilization and management influenced by environmental and socio-economic spectrum in relation to state or nature of land and also how the land has been used or kept. Land use and land cover the vegetation stratum either natural way or artificial build up over the land surface and they influence each other between various land uses on separate dynamic and never static. The land us
land management of region directly / indirectly reveals that the
*Corresponding author; R. Kayalvizhi,
Department of Industries and Earth Sciences, Tamil University, India
ISSN: 0975-833X
Article History:
Received 23rd February, 2016
Received in revised form
10th March, 2016
Accepted 26th April, 2016
Published online 20th May,2016
Key words:
Land use, Land cover, Change Analysis.
Citation: Kayalvizhi, R. and Sankar, K.2016. “Land use and land cover change detection through remote sensing approach:
Pudukkottai District, Tamil nadu”, International Journal of Current Research
RESEARCH ARTICLE
LAND USE AND LAND COVER CHANGE DETECTION THROUGH REMOTE SENSING APPROACH:
A CASE STUDY IN THE PARTS OF PUDUKKOTTAI DISTRICT, TAMIL
*
Kayalvizhi, R. and Sankar, K.
Industries and Earth Sciences, Tamil University, Thanjavur,
ABSTRACT
Land use and land cover is an important component in understanding the interactions of the human activities with the environment and thus it is necessary to be able to simulate changes. Empirical observation revealed a change in land use land cover classification in the parts of Pudukkottai District Tamil Nadu state. In this paper an attempt is made to study the changes in land use and land cover in the study area 10 years period (2003-2013). The land use/land cover prepared LANDSAT ETM+ satellite imageries data (Path153, Row053, acquired on 30 meter resolution image). The image characteristics like size, shape, shadow, tone/colors, texture, pattern and various associated features were considered for interpretation and to achieve it initial identification of different land use classes was pointed out on the image before carrying out the image classi
image was also carried out. The satellite digital data was rectified using Survey of India (SOI) to posheets and field visits in the parts of Pudukkottai District accessibility is the main reason to exploitation of land resources. The land use was classified into nine classes. The two different year land use/land cover maps were integrated in GIS environment. In 2003, dense trees cover, agriculture and water bodies dominated the entire study area, covering a total of 110
fourth largest land cover corresponds to Land without Scrub, which occupied 8.8% of the landscape followed by current fallow land (5.8%), sandy area (4.2%), Land with Scrub (3.4%), Barren land (1.5%) and built up land (1.4%).
is an open access article distributed under the Creative Commons Attribution License, which use, distribution, and reproduction in any medium, provided the original work is properly cited.
Land and its coverage’s of agricultural / features is the most important natural resources that could play a vital role in the beings, but also the entire collection of all living beings which area includes plants and animals and the development of land use / land cover in spatio - temporal serial be provide the basic foundation for planning, uation of lands and its resources and Land use and land cover illustrates man’s pursuit in ancient / modern civilization and management economic spectrum in lso how the land has been used or kept. Land use and land cover the vegetation stratum either natural way or artificial build up over the land surface and they influence each other between various land uses on separate dynamic and never static. The land use pattern and land management of region directly / indirectly reveals that the
Industries and Earth Sciences, Tamil University, Thanjavur,
condition of the people of the region and their economic status, knowledge and value of resources. The low economic status and lack of information of the people have blocked the perspective of good land use and management in the investigated area. Some of the land use patterns degrade the environment or make better the soil productivity based on the effectiveness of the application of the knowledge and resources on them and hence land is a non
play a significant role in the lif
most favorable land use maps on a scientific basis to stop deterioration is essential for healthy and wealthy living of population. Acceptance of land use / land cover pattern of a river basin activity has a vital role in gr
water resources calculated and has a significant plan for land and water resources management and related activities. The quantity of different land use/land cover types, their spatial spread over and understanding changes in their p
of importance. Chapin (1965) has been suggested that the land use divided the system as a systematic means of grouping based on types of land use. The divided system is of immense purpose in the derivation of land use maps and the fundamen
planning process. This divided system would be basically fit to
International Journal of Current Research
Vol. 8, Issue, 05, pp.31251-31258, May, 2016
INTERNATIONAL
Land use and land cover change detection through remote sensing approach:
International Journal of Current Research, 8, (05), 31251-31258.
LAND USE AND LAND COVER CHANGE DETECTION THROUGH REMOTE SENSING APPROACH:
A CASE STUDY IN THE PARTS OF PUDUKKOTTAI DISTRICT, TAMIL NADU
Thanjavur, India
Land use and land cover is an important component in understanding the interactions of the human activities with the environment and thus it is necessary to be able to simulate changes. Empirical observation revealed a change in land use land cover classification in the parts of Pudukkottai District to study the changes in land use and land cover in 2013). The land use/land cover prepared LANDSAT ETM+ satellite imageries data (Path153, Row053, acquired on 30 meter resolution image). The image size, shape, shadow, tone/colors, texture, pattern and various associated features were considered for interpretation and to achieve it initial identification of different land use classes was pointed out on the image before carrying out the image classification and Geo-referencing of the image was also carried out. The satellite digital data was rectified using Survey of India (SOI) to posheets and field visits in the parts of Pudukkottai District accessibility is the main reason to resources. The land use was classified into nine classes. The two different year land use/land cover maps were integrated in GIS environment. In 2003, dense trees cover, agriculture and water bodies dominated the entire study area, covering a total of 1103.4 Km2 (74.85%). The , which occupied 8.8% of the landscape followed by current fallow land (5.8%), sandy area (4.2%), Land with Scrub (3.4%), Barren land
ribution License, which permits
condition of the people of the region and their economic status, knowledge and value of resources. The low economic status and lack of information of the people have blocked the perspective of good land use and management in the the land use patterns degrade the environment or make better the soil productivity based on the effectiveness of the application of the knowledge and resources on them and hence land is a non-renewable resource that could play a significant role in the life of human beings. Generating most favorable land use maps on a scientific basis to stop deterioration is essential for healthy and wealthy living of Acceptance of land use / land cover pattern of a river basin activity has a vital role in groundwater and surface water resources calculated and has a significant plan for land and water resources management and related activities. The quantity of different land use/land cover types, their spatial spread over and understanding changes in their pattern are also Chapin (1965) has been suggested that the land use divided the system as a systematic means of grouping based on types of land use. The divided system is of immense purpose in the derivation of land use maps and the fundamental tools for planning process. This divided system would be basically fit to
INTERNATIONAL JOURNAL OF CURRENT RESEARCH
meet specific purpose needs in the present and future. The planning of the system would be basically done using graphic representation. The spatial data information spread over of land use/land cover types as per the divided system and the pattern of its change acts as a pre requisite for planning use and management of the natural resources. The basic knowledge for land use planning is made of true, reliable, updated data and comprehensive data on physical, ecological and socio-economic underlying structure of an area. National land use / land cover classification for India which is moderately well suited for requirement was evaluated by land use/land cover classification under Integrated Mission for Sustainable Development (IMSD, National Remote Sensing Agency, 1985). Land degradation is mostly due to population pressure, which leads to intense land use without proper management practices. High growth rate in population has made people to move towards sensitive places such as high lands. The influence of road construction, vegetation, water and soil are responsive factor for human intervention. Land development, sometimes even over development of land structures leads to degradation (Barrow, 1991). The land use system is highly dynamic and usually would undergo effective changes based on the changing socio-economic and natural environment. The change in any form of land use largely depends on the external forces and the pressure build up within the system (Bisht and Kothyari, 2001). Changes in the system of land use can often lead to very unsuitable secondary effects and fragile natural environment (Latham and Denis, 1980). Assessment of spatial and temporal changes in land use and land cover pattern is an effective tool for the evolution of changes occurring in land use and the extent of environmental degradation. Remote Sensing can be a powerful technique for analyzing and monitoring changes in land cover and land use systematically (Young, 1998).
Study Area
The taluks located in the southeastern parts of the Pudukkottai
District lies between North latitudes 100 10’ to 100 45’ East
longitudes 780 50’ to 790 15’ and falls in the Survey of India
toposheets Nos. 58 J/14, J/15, J/16, 58 N/2, N/3, and N/4 in
thescale of 1:50,000. The geographical extent occupies an area
of 1795 sq.km. The location map of study area are given in the Fig (1). The study area bounded in the north by Thanjavur district, east by Orathanadu and Patukkottai taluks and Pudukkottai taluk situated in the western and southern parts occupies Manalmelkudi taluk in the study area. There are number of medium scale industries such as coach building industry, groundnut and rice mills etc. Alangudi town is one among the biggest groundnut market across the Tamilnadu State. Two major rivers are found in the study area (Vellar & Agniyar). There are number of small streams / rivers are flown in these study area. Existing rivers are non-perennial nature, during the heavy North East Monsoon Seasons full water flows and carrying soft sediments and allied materials. The study area is bounded by two rivers namely Vellar in the west and Agniar river found to in the northern parts. The general climate of the area is dry climate. The wind velocity is found to be highest in the southwest monsoon and where as lowest are exists in the northeast monsoon season. The relative humidity varies during the monsoon periods and summer dry season. The period from April to June is generally hot and dry. The weather is pleasant during the period from November to January. The normal
annual rainfall over the study area varies from 414.40 mm to 1057.80 mm. It is the minimum in the western and northwestern parts of the district around Nagudi (414.40 mm) and it is the maximum around Aranthangi (1057.80 mm). The
mean maximum temperature is around 32.82 0C and mean
minimum temperature is 25.90 0C. The maximum relative
[image:2.595.311.555.160.391.2]humidity in a day varies from 86.14% to 95% minimum relative humidity in a day varies from 39.38% to 62.22%
Fig.1. Study area map in the parts of Pudukkottai District, Tamil Nadu
Objectives
The main objective of the present paper is to analyse the nature and extent land use / land cover changes in the parts of Pudukkottai District in the 10 years and to identify in the main changes. Since from 1940s PAN images and aerial photographs
were using by analysis for land use mapping (Lillesand et al.,
2007) for this analysis land sat satellite images were used and processed on remote sensing platform. The mapping consist two phases, each phases having 10 years of Gap like 2003 and 2013, lands at ETM+ Images was used its resolution is 30 meter. Images are classified into nine classes, the result of this mapping discussed further below.
Data Used and Methodology
The land use/land cover prepared LANDSAT ETM+ satellite imageries data (Path153, Row053, acquired on 30 meter resolution image). The image characteristics like size, shape, shadow, tone/colors, texture, pattern and various associated features were considered for interpretation and to achieve it initial identification of different land use classes was pointed out on the image before carrying out the image classification and Geo-referencing of the image was also carried out.
RESULT AND DISCUSSION
a. Landuse/ Landcover- 2003
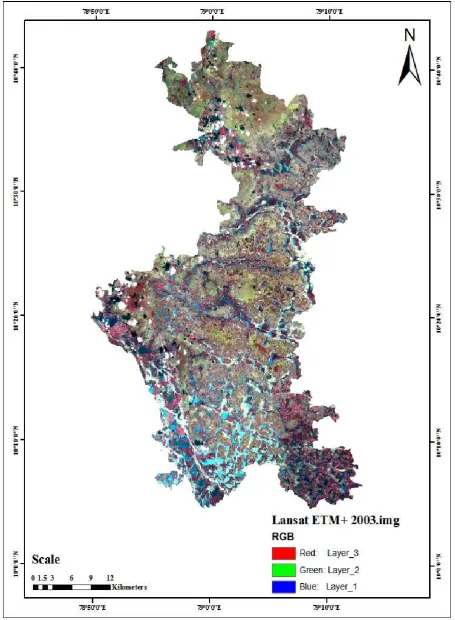
First phase mapping consist 2003 land use/land cover analysis. For this landsat ETM + 30 meter resolution image was used.
Total area of the is 1474 Km2. Study area major portion of land
covered by dense trees cover, second l in the part of pudukkottai District argest land cover is Agriculture land and third major land cover is water bodies. These are the three major land cover of in the part of pudukkottai District. Nearly
percent (522.8 Km2) of land covered by dense trees cover.
Agricultural land was covered by 344.5 Km2 and 236.1 Km2 of
land covered by Water bodies. Land without scrub are covered
129.7 Km2, and current fallow land covered 86.1 Km2. Rest of
the classes are covered 62.1 Km2, 50 Km2, 21.4 Km2, 21.3 Km2
[image:3.595.309.557.223.341.2]like, sandy area, land with scrub, barren land and build-up land. The results shows moderate land use and people not yet started to extract the resources fully, Fig.(3)
Table 1. Spatial Distribution Result of the Land use/Land cover-2003 in the parts of pudukkottai District
S.No. Land use/land cover class Area in
sq.km
Area in percentage
1 Agricultural land 344.5 23.4
2 Barren land 21.4 1.5
3 Builtup area 21.3 1.4
4 Current fallow land 86.1 5.8
5 Dense trees cover 522.8 35.5
6 Land with scrub 50.0 3.4
7 Land without scrub 129.7 8.8
8 Sandy area 62.1 4.2
9 Water bodies 236.1 16.0
Total 1474 100
b. Landuse / Landcover- 2013
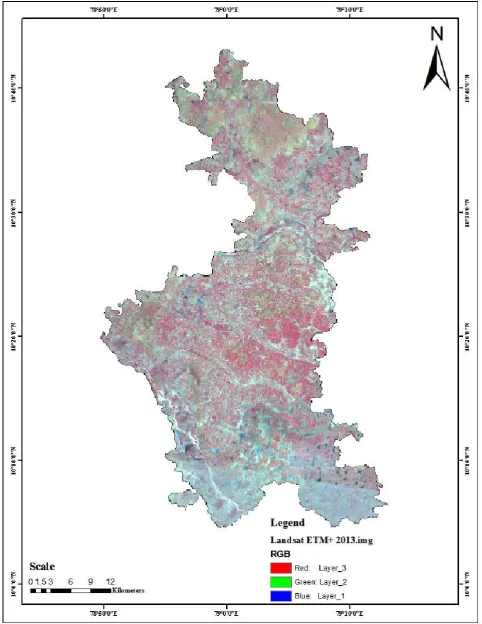
Landsat ETM+ - 30 meter resolution image used to classify the 2013 Land use. The results showing dense trees cover was
recorded 36.9 percent (543.5 Km2), it was 35.5 percent during
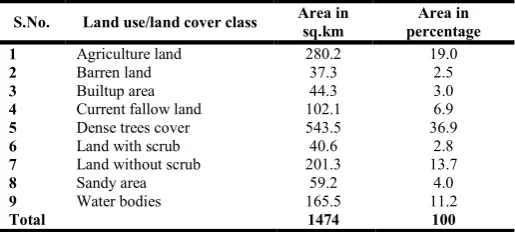
2003, from 2003 to 2013 nearly 20.7 Km2 of dense trees cover
was increased. Agricultural land was decreased from 23.4
percent (344.5 Km2) to 19 percent (280.2 Km2) nearly 64.3
Km2 of area was decreased as a cultivatable land. Water bodies
was decreased from 16 percent (236.1 Km2) to 11.2 percent
(165.5 Km2), Land without scrub increased from 8.8 percent
(129.7 Km2) to 13.7 percent (201.3 Km2), in areal unit wise the
increase is 71.6 Km2. Built up lands are increased from 1.4
percent (21.3 Km2) to 3 percent (44.3 Km2). Current fallow
land was increased from 5.8 percent (86.1 Km2) to 6.9 percent
(102.1 Km2). Sandy area was decreased from 4.2 percent (62.1
Km2) to 4 percent (59.2 Km2). Land with scrub was decreased
from 3.4 percent (50 Km2) to 2.8 percent (40.6 Km2), nearly 9.4
Km2 land with scrub was converted into usable land. Barren
land was increased from 1.5 percent (21.4 Km2) to 2.5 percent
(37.2 Km2). The result of this mapping shows increasing
tendency of land use like dense trees cover, current fallow land, land without scrub, built up area and Barren land, and its identified the illegal encroachment in agriculture land, water bodies, land with scrub, and sandy area, Fig.(4)
Land Use/Land Cover Change Detection Analysis
a Land Use /Land Cover Classification (2003)
In the year 2003, Fallow land was well separated with most of the other classes but was mixed with crop land and land with
[image:3.595.45.282.308.425.2]scrub. In addition, it was mixed with dense trees cover, while some dry areas were classified as land without scrub. Settlement was the most confused class and was mixed with all other classes. The classification resulted into a land use/land cover map with nine classes. Dense trees cover, agriculture land, water bodies, and land without scrub was the most dominant class covering 35.5%, 23.4%, 16%, and 8.8% followed by current fallow land, sandy area, land with scrub, and barren land like 5.8%, 4.2%, 3.4%, and 1.5%, villages (Rural) and Towns/cities (Built-up land) at 1.4% of the total area (Table 3).
Table 2. Spatial Distribution Result of the Land use/Land cover-2013 in the parts of pudukkottai District
S.No. Land use/land cover class Area in
sq.km
Area in percentage
1 Agriculture land 280.2 19.0
2 Barren land 37.3 2.5
3 Builtup area 44.3 3.0
4 Current fallow land 102.1 6.9
5 Dense trees cover 543.5 36.9
6 Land with scrub 40.6 2.8
7 Land without scrub 201.3 13.7
8 Sandy area 59.2 4.0
9 Water bodies 165.5 11.2
[image:3.595.304.562.382.498.2]Total 1474 100
Table 2. Spatial Distribution Result of the Land use/Land cover-2013 in the parts of pudukkottai District
S.No. Land use/land cover class Area in
sq.km
Area in percentage
1 Agriculture land 280.2 19.0
2 Barren land 37.3 2.5
3 Builtup area 44.3 3.0
4 Current fallow land 102.1 6.9
5 Dense trees cover 543.5 36.9
6 Land with scrub 40.6 2.8
7 Land without scrub 201.3 13.7
8 Sandy area 59.2 4.0
9 Water bodies 165.5 11.2
Total 1474 100
b Land Use/ Land Cover Classification (2013)
Supervised classification was done it landsatETM+ data in the year 2013 and the resulting spectral clusters were mostly mixed. Crop land was well separated with most of the other classes but it was mixed with dense trees plantation and fallow land. Land without scrub was the most confused class and was mixed with fallow land and plantation. Settlement was another most confused class and was mixed with all other classes. The classification resulted into a land use/land cover map. Dense trees cover, agriculture land, water bodies, land without scrub and current fallow land was the most dominant class covering 36.9%, 19%, 11.2%, 13.7% and 6.9%, followed by sandy area, land with scrub, and Barren land like 4%, 2.8%, and 2.5%, villages (Rural) and Towns (Built-up land) at 3% of the total area (Table 3).
Comparison of land covers classification (2003 and 2013)
There are two different years of land use/land cover maps were compared polygon by polygon. It has a total area of about 1474
km2. Post-classification comparison methods use classifications
of images acquired on different dates to produce “from - to” change maps (Jensen, 1996). Apart from change no change information, the classification comparison also resulted in a change matrix that provided “from - to” change information. The post-classification change detection is able to reveal not only the nature of change (e.g., from to changes) but also the amount of every possible type of change, even though the detected changes are subject to the accuracy at which each cover is mapped in the respective land cover maps (Gao, 2009). The results indicated that both land use/land cover conversion and land use/land cover modifications were significant between 2003 and 2013. The minimum level of interpretation accuracy in the identification of land use and land cover categories from
remote sensor data should be at least 85% (Rosenfield et al.,
1982). The two different year land use/land cover maps were integrated in GIS environment shows in Fig. (3.7). In 2003, dense trees cover, agriculture and water bodies dominated the
entire study area, covering a total of 1103.4 Km2 (74.85%). The
fourth largest land cover corresponds to Land without Scrub, which occupied 8.8% of the landscape followed by current fallow land (5.8%), sandy area (4.2%), Land with Scrub (3.4%), Barren land (1.5%) and built up land (1.4%). Interpretation of the 2013 satellite data revealed a significant landscape transformation compared to that of 2003. By that time, in 2013, land without scrub, built up land, dense trees cover, current fallow land, and barren land areas increased by
24.3% (71.6 km2), 7.8% (23 km2), 7.1% (20.7 km2), 5.4% (16
Km2) and 5.4% (15.9 Km2) compared to 2003. Water bodies
and agriculture land approximately 24% (70.6 km2) and 21.8%
(64.3 km2) decreased by totally 134.9 km2. Fallowing land
features like land with scrub, and sandy area decreased in 3.2%
(9.4 km2), 1% (2.9 Km2) in the study area. (Fig.6).
Conclusion
The taluks located in the southeastern parts of the Pudukkottai
District lies between North latitudes 100 10’ to 100 45’ East
longitudes 780 50’ to 790 15’ and falls in the Survey of India
toposheets Nos. 58 J/14, J/15, J/16, 58 N/2, N/3, and N/4 in
thescale of 1:50,000. The study area is bounded by two rivers
namely Vellar in the west and Agniar river found to in the northern parts. The general climate of the area is dry climate. The wind velocity is found to be highest in the southwest monsoon and where as lowest are exists in the northeast monsoon season.
The relative humidity varies during the monsoon periods and summer dry season. The period from April to June is generally hot and dry. In this paper an attempt is made to study the changes in land use and land cover in the study area 10 years period (2003-2013). The results of land use/land cover assessment based on digital image interpretation for the landsat ETM+ satellite data (2003) and landsat ETM+ satellite data (2013). There are two different years of land use/land cover maps were compared polygon by polygon. It has a total area of
about 1474 km2. Interpretation of the 2013 satellite data
revealed a significant landscape transformation compared to that of 2003. By that time, in 2013, land without scrub, built up land, dense trees cover, current fallow land, and barren land
areas increased by 24.3% (71.6 km2), 7.8% (23 km2), 7.1%
(20.7 km2), 5.4% (16 Km2) and 5.4% (15.9 Km2) compared to
2003. Water bodies and agriculture land approximately 24%
(70.6 km2) and 21.8% (64.3 km2) decreased by totally 134.9
km2. Fallowing land features like land with scrub, and sandy
area decreased in 3.2% (9.4 km2), 1% (2.9 Km2) in the study
area.
REFERENCES
Barrow, C.J. 1991. Land degradation. Development and Breakdown of Terrestrial Environments. Cambridge University Press. Cambridge, 295 p.
Bisht, B.S. and Kothyari, B.P. 2001. Land-cover change analysis of Garur Ganga watershed using GIS / Remote
sensing Technique. J. Indian soc. Remote Sensing, 29 (3).
pp. 165-174.
Chapin Jr. S.E. 1965. Urban landuse planning, University of sagar, pp.91-102.
Gao, J.(2009. Digital Analysis of Remotely Sensed Imagery: Chapter 13 –Multitemporal Image Analysis. McGraw-Hills, New York, 645 p.
Jensen, J. R. 1996 Introductory Digital Image Processing: A Remote Sensing Perspective, Prentice-Hall, Englewood Cliffs, NJ
Latham, M. and Denis, B. 1980. The study of land potential; an open- ended inquiry, in H.C. Brookfield (ed.), MAB Technical note No.13. UNESCO. 226 p.
Rosenfield, G., Fitzpatrick-Lins, K., and Ling, H., 1982. Sampling of thematic map accuracy testing, 1983. Photogrammetric Engineering and Remote Sensing 52 (2), 223 -227.
Young, A. 1998 Land Resources-Now and for the future. Cambridge University Press. United Kingdom, 319 p.