EVALUATION STUDY OF USING THREE D
RADIOTHERAPY TECHNIQUE FOR BREAST TUMORS
*,1
Ahmed, M. T.,
1Abdel-Hamid, M. I.
1
Mansoura University, Faculty of Science, Departm
2Delta University for Science and Technology, Facul
3Alexandria Clinical Oncology Center “
4
Mansoura General Hospital, Department of Me
ARTICLE INFO ABSTRACT
Our aim is to
superposition (FSUP), superposition (SUP), and convolution (CON)) in IMRT (intensity modulated radiotherapy) treatment planning technique for breast cancer patients.
breast cancer were selected for this study. D (PTV).
of 6 MV quality. CMS XiO planning.
2.33% in average conformity index (CI), and for OARs was 2.68% contralateral breast.
because the results between the three different algorithms show clear difference in some comparisons, considerable
algorithm selection could effect results.
Copyright © 2017, Ahmed et al. This is an open access distribution, and reproduction in any medium, provided
INTRODUCTION
Conformal radiotherapy (also known as three
conformal radiotherapy or 3D-CRT) is a method of delivering radiotherapy that uses computer planning and treatment systems to tailor the size and shape of the dose area to the ideal target volume, with maximum exclusion of the surrounding healthy tissue. However, it should be noted that there exists a more advanced form of 3D-CRT called IMRT. In IMRT, the intensity of radiotherapy beam can be varied during the treatment, usually by computer-controlled
multi leaf collimator (MLC) leaves. MLC is an automated device that is built into the head of the treatment machine. The main advantage of IMRT over conventional 3D
allows even greater conformity of dose to the target volume (Medical Services Advisory Committee, 2001).
paramount importance for the modern conformal radiotherapy technique to have accuracy in dose calculations in almost all relevant clinical situations (Garcia-Vicente et al.,
*Corresponding author: Ahmed, M. T.
Mansoura University, Faculty of Science, Department of Physics, Mansoura, Egypt.
ISSN: 0975-833X
Vol.
Article History: Received 19th August, 2017
Received in revised form 24th September, 2017
Accepted 10th October, 2017
Published online 30th November, 2017
Citation: Ahmed, M. T., Abdel-Hamid, M. I., Hegazy, E. A., Elnaggar, M. A. and Abdel algorithms in intensity modulated radiotherapy technique for breast tumors”
Key words: Algorithms, Breast Tumors, Radiotherapy
RESEARCH ARTICLE
VALUATION STUDY OF USING THREE DIFFERENT ALGORITHMS IN INTENSITY MODULATED
RADIOTHERAPY TECHNIQUE FOR BREAST TUMORS
Hamid, M. I.,
2Hegazy, E. A.,
3Elnaggar, M. A. and
Mansoura University, Faculty of Science, Department of Physics, Mansoura, Egypt
Delta University for Science and Technology, Faculty of Pharmacy, Dakahlia, Egypt
Alexandria Clinical Oncology Center “Ayadi-Almostakbal” (ACOCAA), Department of
Alexandria, Egypt
Mansoura General Hospital, Department of Medical Analysis, Mansoura, Egypt
ABSTRACT
Our aim is to evaluate and compare between three different dose calculations
superposition (FSUP), superposition (SUP), and convolution (CON)) in IMRT (intensity modulated radiotherapy) treatment planning technique for breast cancer patients.
breast cancer were selected for this study. Dose of 5000 cGy was prescribed to planning target volume (PTV). For each patient, IMRT plans were created with non-coplanar and non
of 6 MV quality. CMS XiO system of treatment planning (TPS) was the system for the process of planning. The percent of maximum variation observed between the three algorithms for PTV was 2.33% in average conformity index (CI), and for OARs was 2.68%
ntralateral breast. Significant variations between three algorithms were observed. Due to
because the results between the three different algorithms show clear difference in some comparisons, considerable precaution unavoidable in treatment plans evaluation, because
algorithm selection could effect on the process of treatment planning (TP) and also on results.
access article distributed under the Creative Commons Attribution License, the original work is properly cited.
Conformal radiotherapy (also known as three-dimensional CRT) is a method of delivering radiotherapy that uses computer planning and treatment systems to tailor the size and shape of the dose area to the ideal h maximum exclusion of the surrounding healthy tissue. However, it should be noted that there exists a CRT called IMRT. In IMRT, the intensity of radiotherapy beam can be varied during the controlled movement of the leaf collimator (MLC) leaves. MLC is an automated device that is built into the head of the treatment machine. The main advantage of IMRT over conventional 3D-CRT is that it allows even greater conformity of dose to the target volume , 2001). It is of paramount importance for the modern conformal radiotherapy technique to have accuracy in dose calculations in almost all
et al., 20013).
Mansoura University, Faculty of Science, Department of Physics,
The accuracy of dose calculation and the strict quality assurance program is essential in order to make sure that dose delivery to the tumor is 100% or cl
calculated dose. The dose calculations accuracy had been ameliorated by shifting from homogeneity corrections algorithms through algorithms of pencil beam arriving to kernel-dependent CON/SUP calculations algorithms (Vanderstraeten et al., 2006). The efficiency of the system of TPare extremely reclined on the dose calculation algorithm used in treads of the process of planning. The algorithm is an arithmetic progression of directives that run on a group of input information, changing that
consequences which are useful to the employer
2005). Both the CON algorithm of the XiO system and the SUP (Wiesmeyer and Miften,
dose in the patient through total energy convolving with Monte Carlo kernels, discussed via Mackie
selection of an algorithm is a significant regard while using “high-ended” planning ways and comparing between them (Beavis et al., 2005; Miften et al.,
present study is devoted to
International Journal of Current Research
Vol. 9, Issue, 11, pp.60948-60954, November, 2017
Hamid, M. I., Hegazy, E. A., Elnaggar, M. A. and Abdel-Muttalib E. O. 2017. “Evaluation study of using three different algorithms in intensity modulated radiotherapy technique for breast tumors”, International Journal of Current Research, 9, (11),
Available online at http://www.journalcra.com
z
IFFERENT ALGORITHMS IN INTENSITY MODULATED
RADIOTHERAPY TECHNIQUE FOR BREAST TUMORS
and
4Abdel-Muttalib E. O.
ent of Physics, Mansoura, Egypt
ty of Pharmacy, Dakahlia, Egypt
Almostakbal” (ACOCAA), Department of Radiotherapy,
dical Analysis, Mansoura, Egypt
evaluate and compare between three different dose calculations algorithms (fast superposition (FSUP), superposition (SUP), and convolution (CON)) in IMRT (intensity modulated radiotherapy) treatment planning technique for breast cancer patients. Ten patients with left-side ose of 5000 cGy was prescribed to planning target volume coplanar and non-opposing photon beams system of treatment planning (TPS) was the system for the process of The percent of maximum variation observed between the three algorithms for PTV was 2.33% in average conformity index (CI), and for OARs was 2.68% in average Dmean in case of
Significant variations between three algorithms were observed. Due to our study, because the results between the three different algorithms show clear difference in some comparisons, evaluation, because the dose calculation on the process of treatment planning (TP) and also on the end medical
License, which permits unrestricted use,
The accuracy of dose calculation and the strict quality assurance program is essential in order to make sure that dose delivery to the tumor is 100% or close to 100% of the calculated dose. The dose calculations accuracy had been ameliorated by shifting from homogeneity corrections algorithms through algorithms of pencil beam arriving to dependent CON/SUP calculations algorithms The efficiency of the system of TPare extremely reclined on the dose calculation algorithm used in treads of the process of planning. The algorithm is an progression of directives that run on a group of input information, changing that data into a group of output s which are useful to the employer (Animesh, Both the CON algorithm of the XiO system and the , 1999) algorithm calculate the total energy convolving with Monte Carlo kernels, discussed via Mackie et al. (1985). The selection of an algorithm is a significant regard while using ended” planning ways and comparing between them
et al., 2002; Jeraj et al., 2002). The
present study is devoted to evaluate and compare three
INTERNATIONAL JOURNAL OF CURRENT RESEARCH
different dose calculation algorithms (FSUP, SUP, and CON) in IMRT TP technique for breast cancer patients.
MATERIALS AND METHODS
Ten patients with diagnosis of left-side breast cancer were selected for this study. Dose of 5000 cGy was prescribed to PTV. The mean age of patients was 52 years. Ipsilateral lung, heart, and contra lateral breast were delineated as OARs in all patients. TP targets for PTV and OARs were presented in table (1). IMRT plans were done for each patient with seven non-coplanar and non-opposing photon beams having 6 MV energy using CON, SUP, and FSUP algorithms.CMS XiO TPS was the system for the process of planning. Siemens artiste linear accelerator (linac; ART L4) treatment system was used in this study, the machine head is provided with MLC has two opposing sets, having 160-leaf with leaf width of 0.5 cm. The radiation therapy oncology group (RTOG) was recommended to use the conformity indexRTOG in IMRT guidelines. The CI
had been reported to define the conformity of the prescription isodose to the tumor as shown in the following equation:
= ……….. (1)
Where,
VRI: Volume of the reference isodose (e.g. 95% isodose);
TV: Target volume (volume of the PTV; VPTV).
The RTOG guidelines defined a ratio is situated between 1.0 and 2.0, treatment is considered to comply with the treatment plan, with values nearest to one mean the better conformation (Shaw et al., 1993). The conventionally used homogeneity index (HI) is defined as the ratio of the maximum dose in PTV to reference isodose according to RTOG (Huchet et al., 2003;
Shaw et al., 2000), with values nearest to one mean the best
homogeneity. HI is given by:
= ……….. (2)
Where,
Dmax: Maximum isodose in the PTV;
RI: Reference isodose (e.g. 95% isodose).
For each plan, dose-volume histogram (DVH) was generated using CMS XiO TPS. Dmean, Dmax, and Dmin were recorded for
OARs and PTV. HI and CI were computed for PTV in all patients. Maximum variations of Dmin, Dmax and Dmean were
tabulated. The percent of maximum variations between the different algorithms were evaluated for OARs and PTV. To evaluate the doses to OARs, Dmax was used. All treatment
plans were evaluated with the evaluation parameters of the ICRU (International Commission on Radiation Units and Measurements) report 62 International Commission on Radiation Units and Measurements, 1999; Wu et al., 2004).
RESULTS AND DISCUSSION
Comparisons between CON, SUP and FSUP algorithms for PTV
Figure (1) shows dose-volume histograms (DVHs) for breast cancer patient number one with IMRT treatment planning technique using CON, SUP, and FSUP algorithms. Figure (2) shows treatment plans of patient number one with IMRT technique using three different algorithms. Figure (3) shows a comparison between CON, SUP and FSUP according to Dmax
as percent of prescription dose for PTV in ten patients. The RTOG constraints for Dmax for breast is that, Dmax ≤ 110% of
prescription dose. It is clear from Figure (3), that Dmax often
cases in three algorithms not exceed than 110%. This means that all the plans for ten patients in three different algorithms are accepted and satisfied the RTOG constraints for Dmax.
Figure (4) shows a comparison between three algorithms according to D95 as percent of prescription dose for PTV in ten
patients. The RTOG constraints for D95 in the plans of breast is
that, D95 ≥ 95% (> 90% accepted). It is clear that D95 of ten
patients in CON, SUP and FUP are more than 90%. This means that all the plans for ten patients in three algorithms are accepted and satisfied the RTOG constraints for D95.
Comparison between the three algorithms according
toDmean relative differences with prescribed dose
Figure (5) shows a comparison between CON, SUP and FSUP algorithms according to the average Dmean relative differences
with prescribed dose for PTV of breast cancer patients with IMRT TP technique. The percent of maximum variation between the three algorithms was 0.50%. FSUP algorithm gave the minimum value of average Dmean relative difference
with prescribed dose (0.04%). This means that, FSUP algorithm gives the minimum percent of deviation with the prescribed dose. So that, FSUP algorithm is better algorithm in IMRT technique for PTV of breast cancer patients when comparing the three algorithms according to the Dmean relative
difference with prescribed dose.
Comparison between the three algorithms according to the homogeneity index (HI)
[image:2.595.116.477.716.804.2]A comparison between CON, SUP and FSUP dose calculation algorithms according to the average homogeneity indexes for PTV of breast cancer patients with IMRT technique is shown in figure (6).SUP algorithm shows the minimum value of average HI (closer value to one). So that, SUP is better algorithm in IMRT treatment planning technique for PTV of breast cancer patients when comparing the three algorithms according to the homogeneity index. The difference between the SUP and FSUP algorithms is not large. Maximum percentage of variation between three algorithms for average HI values is 0.44%.
Table 1. Prescription of IMRT for PTV and OARs in breast cancer patients
Site IMRT Prescription Rank Objective Dose
(cGy)
Volume (%)
Weight Power
Structure Type
Breast PTV Target 1 Maximum 5100 0 100 3.3
Goal 5000 100 - 1.0
Minimum 4950 100 100 2.7
Ipsilateral Lung OAR 2 Maximum 1800 0 100 2.3
Dose Volume 1500 15 100 2.3
Heart OAR 3 Dose Volume 900 15 100 2.2
Contralateral Breast OAR 4 Maximum 500 0 100 2.0
(a) (b)
Figure 1. IMRT DVHs for breast cancer patient number one using (a) CON; (b) SUP; (c) FSUP algorithms
(a)
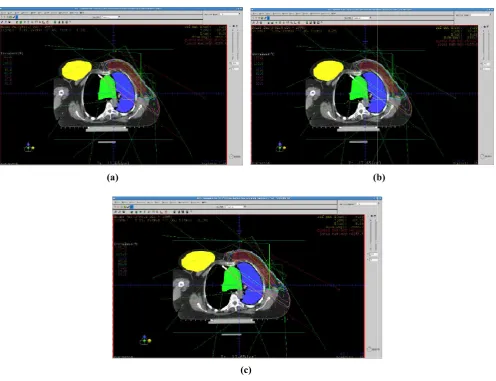
Figure 2. IMRT plans for breast cancer patient number one using (a) CO
60950 International Journal of Current Research,
(a) (b)
(c)
IMRT DVHs for breast cancer patient number one using (a) CON; (b) SUP; (c) FSUP algorithms
(b)
(c)
IMRT plans for breast cancer patient number one using (a) CON; (b) SUP; (c) FSUP algorithms
International Journal of Current Research, Vol. 9, Issue, 11, pp.60948-60954, November
(a) (b)
IMRT DVHs for breast cancer patient number one using (a) CON; (b) SUP; (c) FSUP algorithms
(b)
N; (b) SUP; (c) FSUP algorithms
[image:3.595.52.549.408.789.2]Figure 3. Comparison between three algorithms according to D for breast PTV with IMRT in ten patients
Figure 4. Comparison between three algorithms according to D for breast PTV with IMRT in ten patients
Figure 5. Comparison between three algorithms according to the average Dmean relative differences with prescribe
PTV with IMRT
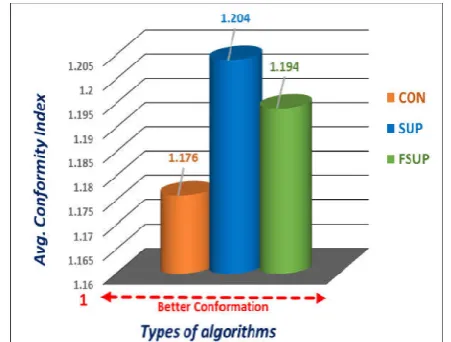
Comparison between the three algorithms according to conformity index (CI)
Figure (7) shows a comparison between three different algorithms according to the average conformity indexes for PTV of breast cancer patients with IMRT technique. algorithm shows the minimum value (1.176) of average CI.
60951 Ahmed et al. Evaluation study of using three d
Comparison between three algorithms according to Dmax
t PTV with IMRT in ten patients
Comparison between three algorithms according to D95
with IMRT in ten patients
Comparison between three algorithms according to the relative differences with prescribed dose for breast
Comparison between the three algorithms according to the
Figure (7) shows a comparison between three different algorithms according to the average conformity indexes for PTV of breast cancer patients with IMRT technique. CON algorithm shows the minimum value (1.176) of average CI.
Figure 6. Comparison between three algorithms according to the average homogeneity indexes for breast PTV with IMRT
When the value of CI is one, this means that the conformity of the prescription isodose to tumor volume (PTV) is 100%, and as the value of CI close to one this indicates a better conformation. So, CON algorithm is better algorithm in IMRT technique for PTV of breast cancer patients when comparing the three algorithms according to th
[image:4.595.47.278.268.451.2]maximum variation recorded between the three algorithms in average CI is 2.33%.
Figure 7. Comparison between three algorithms according to the average conformity indexes for breast PTV with IMRT
Comparisons between CON, SUP and OARs
Comparison between three algorithms in ipsilateral lung
A comparison between CON, SUP and FSUP algorithms according to D30 for ipsilateral
ten breast cancer patients is presented in figure (8). Figure (9) shows a comparison between three different algorithms according to average D30 for ipsilateral lung. The RTOG had
defined the dose constraints of ipsilateral lun risk in TP of breast as, D30 of ipsilateral lung
(which equal to 40% of the prescription dose; 5000 cGy). clear that all the values of D30
are under the RTOG constraints, and thus all the tre plans are accepted and satisfied the RTOG constraints due to the dose received by the ipsilateral lung.
comparison between three algorithms according to D ipsilateral lung in ten patients.
valuation study of using three different algorithms in intensity modulated radiotherapy technique for breast tumors
Comparison between three algorithms according to the ndexes for breast PTV with IMRT
When the value of CI is one, this means that the conformity of n isodose to tumor volume (PTV) is 100%, and as the value of CI close to one this indicates a better conformation. So, CON algorithm is better algorithm in IMRT technique for PTV of breast cancer patients when comparing the three algorithms according to the CI. The percent of maximum variation recorded between the three algorithms in
Comparison between three algorithms according to the ndexes for breast PTV with IMRT
Comparisons between CON, SUP and FSUP algorithms for
algorithms in ipsilateral lung
A comparison between CON, SUP and FSUP algorithms for ipsilateral lung with IMRT technique in ten breast cancer patients is presented in figure (8). Figure (9) shows a comparison between three different algorithms for ipsilateral lung. The RTOG had defined the dose constraints of ipsilateral lung as an organ at of ipsilateral lung ≤ 2000 cGy he prescription dose; 5000 cGy). It is
30 and average D30in ten patients
are under the RTOG constraints, and thus all the treatment plans are accepted and satisfied the RTOG constraints due to the dose received by the ipsilateral lung. Figure (10) shows a comparison between three algorithms according to Dmax for
[image:4.595.320.546.368.539.2] [image:4.595.48.280.490.672.2]Figure 9. Comparison between three algorithms according to average D30 for ipsilateral lung with IMRT
[image:5.595.52.279.263.439.2]Figure 8. Comparison between three algorithms according to D30for ipsilateral lung with IMRT in ten patients
Figure 10. Comparison between three algorithms Dmax for ipsilateral lung with IMRT in ten patients.
Figure (11) shows a comparison between three algorithms according to the average Dmax. It can be noticed that the
maximum value of average Dmax is with FSUP (83.85%) and
the minimum value is with CON (83.71%). This means that, ipsilateral lung gets the highest doses with FSUP and gets the lowest doses with CON algorithm. So that, CON is better algorithm in IMRT TPfor breast cancer patients when comparing the three algorithms according to the maximum dose received by the ipsilateral lung.
60952 International Journal of Current Research,
Comparison between three algorithms according to for ipsilateral lung with IMRT
Comparison between three algorithms according to MRT in ten patients
Comparison between three algorithms according to for ipsilateral lung with IMRT in ten patients.
Figure (11) shows a comparison between three algorithms . It can be noticed that the is with FSUP (83.85%) and the minimum value is with CON (83.71%). This means that, ipsilateral lung gets the highest doses with FSUP and gets the lowest doses with CON algorithm. So that, CON is better algorithm in IMRT TPfor breast cancer patients when omparing the three algorithms according to the maximum
[image:5.595.321.548.266.443.2]Figure (11): Comparison between three algorithms according to average Dmax for ipsilateral lung with IMRT.
Figure 12. Comparison between three algorithms for heart with IMRT in ten patients.
Figure 13. Comparison between three algorithms according to average D10 for heart with IMRT.
Comparison between three algorithms in heart
A comparison between CON, SUP and FSUP algorithms according to D10 for heart in ten patients is presented in figure
(12). Figure (13) shows a comparison between three algorithms according to average D
constraints of heart is D10 ≤ 2500 cGy (50% of the prescription
dose). All the plans are accepted and satisfied the RTOG constraints.
International Journal of Current Research, Vol. 9, Issue, 11, pp.60948-60954, November
Figure (11): Comparison between three algorithms according to for ipsilateral lung with IMRT.
Comparison between three algorithms according to D10
for heart with IMRT in ten patients.
Comparison between three algorithms according to for heart with IMRT.
Comparison between three algorithms in heart
A comparison between CON, SUP and FSUP algorithms for heart in ten patients is presented in figure (12). Figure (13) shows a comparison between three algorithms according to average D10. The RTOG dose
≤ 2500 cGy (50% of the prescription accepted and satisfied the RTOG
[image:5.595.51.277.478.658.2] [image:5.595.316.547.479.659.2]Figure 14. Comparison between three algorithms according to Dmax for heart with IMRT in ten patients
Figure 15. Comparison between three algorithms according to average Dmax for heart with IMRT
Figure (14) shows a comparison between three algorithms according to Dmax. Figure (15) shows a comparison between
three algorithms according to average Dmax
value of average Dmax is with SUP (77.55%) and the minimum
is with CON (77.39%). So, CON is better algorithm in IMRT TP for breast when comparing three algorithms according to the maximum dose received by heart. The difference between the FSUP and the SUP algorithms is not large.
Comparison between three algorithms in contralateral breast
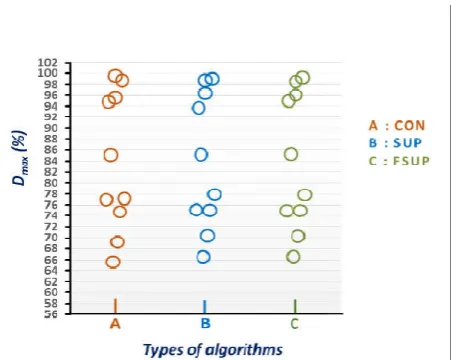
Figure (16) shows a comparison between three algorithms according to Dmax for contra lateral breast in ten patients.
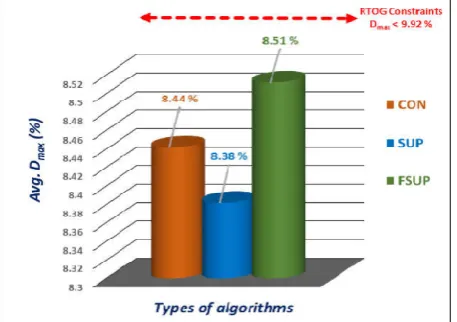
Figure (17) shows a comparison between three algorithms according to the average Dmax. The RTOG constraints of
lateral breast is Dmax ˂ 496 cGy (9.92 % of the prescription
dose; 5000 cGy).All the values of Dmax
constraints, and thus all the plans are accepted and satisfied the RTOG constraints. The maximum value of average D with FSUP (8.51%) and the minimum value is with SUP algorithm (8.38%). Thus, the contra lateral
highest doses with FSUP and gets the lowest doses with SUP algorithm. So that, SUP algorithm is better algorithm in IMRT TP for breast cancer patients.
60953 Ahmed et al. Evaluation study of using three d
Comparison between three algorithms according to heart with IMRT in ten patients
Comparison between three algorithms according to for heart with IMRT
Figure (14) shows a comparison between three algorithms . Figure (15) shows a comparison between
max. The maximum
is with SUP (77.55%) and the minimum ON is better algorithm in IMRT TP for breast when comparing three algorithms according to the maximum dose received by heart. The difference between the FSUP and the SUP algorithms is not large.
Comparison between three algorithms in contralateral
Figure (16) shows a comparison between three algorithms breast in ten patients. Figure (17) shows a comparison between three algorithms . The RTOG constraints of contra ˂ 496 cGy (9.92 % of the prescription are less than the constraints, and thus all the plans are accepted and satisfied the maximum value of average Dmax is
alue is with SUP contra lateral breast gets the highest doses with FSUP and gets the lowest doses with SUP algorithm. So that, SUP algorithm is better algorithm in IMRT
Summary of the results
Table (2) shows a summary of the percent differences between three algorithms for average D
and Dmin of PTV and OARs. The minimum value of maximum
percentage of difference between three algorithms is 0.45% in average Dmax in case of PTV
2.68% in average Dmean in case of
Significant variations between the three algorithms can be observed from the table.
Table 2. Summary of maximum differences (%) between three algorithms in average Dmin, Dmax
Organ
PTV Maximum % of difference in avg. D Maximum % of difference in avg. D Maximum % of difference in avg. D Minimum avg. Dmean relative difference is with
Maximum Avg. Dmax is in
Minimum Avg. Dmax is in
OAR 1
Maximum % of difference in avg. D Minimum avg. Dmean is with
Maximum Avg. Dmax is in
Minimum Avg. Dmax is in OAR 2
Maximum % of difference in avg. D Minimum avg. Dmean is with
Maximum Avg. Dmax is in
Minimum Avg. Dmax is in OAR 3
Maximum % of difference in avg. D Minimum avg. Dmean is with
Maximum Avg. Dmax is in
Minimum Avg. Dmax is in
Table 3. Summary of algorithmssuitability to the breast and the IMRT technique according to the minimum average D
OARs
Site OAR
Breast Ipsilateral Lung Heart ContralateralBreast
Table 4. Summary of algorithms suitability to the breast and the IMRT treatment planning technique according to the PTV
Comparisons
Dmean relative difference with prescription dose
CI HI
Table (3) shows a summary of minimum average D OARs. The organs get the lowest doses with the algorithms shown in the table. So, these algorithms is the most suitable with respect to the breast and IMRT due to the minimum D Table (3): Summary of algorithms suitability to the breast and the IMRT technique according to the minimum average D for OARs. Table (4) shows a summary of the algorithms suitability to the breast and IMRT. The algorithms in the table showed the minimum values of average D
difference with the prescription dose and the minimum values of CI and HI. So that, these algorithms are the most suitable and the better than the other algorithms.
valuation study of using three different algorithms in intensity modulated radiotherapy technique for breast tumors
ble (2) shows a summary of the percent of maximum differences between three algorithms for average Dmean, Dmax,
of PTV and OARs. The minimum value of maximum percentage of difference between three algorithms is 0.45% in in case of PTV, while the maximum value is in case of contra lateral breast. Significant variations between the three algorithms can be
Summary of maximum differences (%) between three
max, and Dmean of PTV and OARs
Breast IMRT Maximum % of difference in avg. Dmean 0.50
Maximum % of difference in avg. Dmax 0.45
Maximum % of difference in avg. Dmin 1.00
relative difference is with FSUP
is in CON
is in SUP
Ipsilateral Lung Maximum % of difference in avg. Dmean 2.42
is with SUP
is in FSUP
Minimum Avg. Dmax is in CON
Heart Maximum % of difference in avg. Dmean 0.72
is with FSUP
is in SUP
Minimum Avg. Dmax is in CON
Contralate ral Breast Maximum % of difference in avg. Dmean 2.68
is with SUP
is in FSUP
Minimum Avg. Dmax is in SUP
Summary of algorithmssuitability to the breast and the IMRT technique according to the minimum average Dmax for
OARs
Technique Algorithm
IMRT CON
CON
ContralateralBreast SUP
Summary of algorithms suitability to the breast and the technique according to the PTV
Technique Site
Breast relative difference with prescription dose IMRT FSUP CON
SUP
Table (3) shows a summary of minimum average Dmax for
OARs. The organs get the lowest doses with the algorithms shown in the table. So, these algorithms is the most suitable with respect to the breast and IMRT due to the minimum Dmax.
Table (3): Summary of algorithms suitability to the breast and the IMRT technique according to the minimum average Dmax
Table (4) shows a summary of the algorithms suitability to the breast and IMRT. The algorithms in the table nimum values of average Dmean relative
difference with the prescription dose and the minimum values of CI and HI. So that, these algorithms are the most suitable and the better than the other algorithms.
Figure 16. Comparison between three algorithms according
to Dmax for contralateral breast with IMRT in ten patients
Figure 17. Comparison between three algorithms according
to average Dmax for contralateral breast with IMRT
Conclusion
The percent of maximum variation observed between the three algorithms involved in our study for the PTV was 2.33% in average CI, and for the OARs was 2.68% in average Dmean in case of contra lateral
Significant variations between the three algorithms were observed according to the dosimetric results obtained from this study.
Due to our study, because the results of the three different algorithms show clear difference in some comparisons, considerable precaution unavoidable in treatment plans evaluation, because the dose calculation algorithm selection could effect on the process of TP and also on the end medical results.
We recommend to use the CON algorithm with IMRT technique in treatment planning of the left side breast. This recommendation is based on the better conformation of the prescription isodose to the tumor volume and the sparing of OARs which were achieved by this algorithm.
60954 International Journal of Current Research,
Comparison between three algorithms according reast with IMRT in ten patients
Comparison between three algorithms according contralateral breast with IMRT
The percent of maximum variation observed between the three algorithms involved in our study for the PTV was 2.33% in average CI, and for the OARs was 2.68%
contra lateral breast.
Significant variations between the three algorithms were observed according to the dosimetric results
Due to our study, because the results of the three different algorithms show clear difference in some precaution unavoidable in treatment plans evaluation, because the dose calculation algorithm selection could effect on the process of TP
We recommend to use the CON algorithm with IMRT the left side breast. This recommendation is based on the better conformation of the prescription isodose to the tumor volume and the sparing of OARs which were achieved
REFERENCES
Animesh, 2005. Advantages of multiple algorith
treatment planning system for external beam dose calculations. J. Cancer Res. Ther
Beavis AW, Abdel-Hamid A, Upadhyay S.
of lung tumor using a simple intensity modulated radiotherapy approach. Br. J. Radiol
Garcia-Vicente F, Minambres A, Jerez I, Modocell I, Perez L, Torres JJ. 2003. Experimental validation tests of fast Fourier transform convolution and multigrid superposition algorithm for dose calculation in low density media
Radiother. Oncol., 67:
239-Huchet A, Caudry M, Belkacemi Y, and radiotherapy part two: Volume tissue. Cancer Radiother., 7: 353
International Commission on Radiation Units and Measurements. "Prescribing, Recording
Photon Beam Therapy (Supplement to ICRU Report 50) J. ICRU, ICRU Report 62, Washington DC: ICRU, 1999. Jeraj R, Keall PJ, Siebers JV.
calculation accuracy on inverse treatment planning
Phys. Med. Biol., 47: 391-407.
Mackie TR, Scrimger JW, Battista JJ. method of calculating dose for 15 MV x
Phys., 12: 188-196.
Medical Services Advisory Committee.
radiotherapy. MSAC application 1038:
gov.au, 2001.
Mhtml:file://IN:\RadiationOncology
books, open books for an open world, 2013. Miften MM, Beavis AW, Marks LB.
the dose calculation model on treatment plan evaluation in conformal therapy: A three case study
51-57.
Shaw E, Scott C, Souhami L,
radiosurgical treatment of recurrent previously irradiated primary brain tumors and brain metastases: Final report of RTOG protocol 90-05. Int. J. Radiat. Oncol. Biol. Phys
47: 291-298.
Shaw, E. et al. 1993. Radiation Therapy Oncology Group: radiosurgery quality assurance guidelines
Oncol. Biol. Phys., 27: 1231
Vanderstraeten B, Reynaert N, Paelinck L, Madani I, De Wagter C, De Gersem W, et al
dose calculation for lung IMRT: A comparison of Monte Carlo, convolution/superposition, and pencil beam computations. J. Med. Phys
Wiesmeyer MD, Miften MM.
accelerating three-dimensional photon dose calculation
Med. Phys., 26: 1149.
Wu VW, Sham JS, Kwong DL.
three-dimensional conformal and intensity modulated radiotherapy of mid-thoracic esophageal cancer
Radiol., 77: 568-572.
*******
International Journal of Current Research, Vol. 9, Issue, 11, pp.60948-60954, November
Advantages of multiple algorithms support in treatment planning system for external beam dose
J. Cancer Res. Ther., 1(1): 12-20.
Hamid A, Upadhyay S. 2005. Re-treatment of lung tumor using a simple intensity modulated
Br. J. Radiol., 78: 358-361.
Vicente F, Minambres A, Jerez I, Modocell I, Perez L, Experimental validation tests of fast-Fourier transform convolution and multigrid superposition algorithm for dose calculation in low density media. J.
-249.
Huchet A, Caudry M, Belkacemi Y, et al. 2003. Volume-effect and radiotherapy part two: Volume-effect and normal
7: 353-362.
International Commission on Radiation Units and Prescribing, Recording and Reporting Photon Beam Therapy (Supplement to ICRU Report 50)". J. ICRU, ICRU Report 62, Washington DC: ICRU, 1999. Jeraj R, Keall PJ, Siebers JV. 2002. The effect of dose
calculation accuracy on inverse treatment planning. J.
407.
Mackie TR, Scrimger JW, Battista JJ. 1985. A convolution method of calculating dose for 15 MV x-rays. J. Med.
Medical Services Advisory Committee. Conformal
. MSAC application 1038: http://www.msac.
RadiationOncology-Toxicity-RTOG – Wiki books, open books for an open world, 2013.
Miften MM, Beavis AW, Marks LB. 2002. The influence of the dose calculation model on treatment plan evaluation in conformal therapy: A three case study. J. Med. Dosim., 27:
Shaw E, Scott C, Souhami L, et al. 2000. Single dose radiosurgical treatment of recurrent previously irradiated primary brain tumors and brain metastases: Final report of
Int. J. Radiat. Oncol. Biol. Phys.,
Radiation Therapy Oncology Group: radiosurgery quality assurance guidelines. Int. J. Radiat.
27: 1231-1239.
Vanderstraeten B, Reynaert N, Paelinck L, Madani I, De
et al. 2006. Accuracy of patient
dose calculation for lung IMRT: A comparison of Monte Carlo, convolution/superposition, and pencil beam
J. Med. Phys., 33: 3149.
Wiesmeyer MD, Miften MM. 1999. A multigrid approach for dimensional photon dose calculation. J.
Wu VW, Sham JS, Kwong DL. 2004. Inverse planning in dimensional conformal and intensity modulated thoracic esophageal cancer. Br. J.
[image:7.595.51.280.258.419.2]