Scientific Communities Found Based on the Path Structure
of Citation Network
Xiao Xiao1,2, Song Cao1,2, Lan Huang1,2*, Yutian Tang1,2
1
College of Computer Science and Technology, Jilin University, Changchun, China 2
Key Laboratory of Symbolic Computation and Knowledge Engineering of Ministry of Education, Jilin University, Changchun, China
Email: *[email protected]
Received November 12, 2011; revised December 5, 2011; December 15,2011
ABSTRACT
Based on the structure of citation network, the citation paths among papers, and the association strength such as cou-pling, co-citation and etc. between two papers are defined in this article. We give formulas to quantify the association strength in order to establish citation network model based on the citation path structure. Then, the OPTICS algorithm is brought into the scientific communities found model since it can solve the parameter’s setting problem. This method combines various kinds of path structures together and thus it contains more complete citation network information. Experiments and analysis reveal the reliability and validity of this method.
Keywords: Citation Network; Scientific Communities Found; OPTICS Algorithm; Citation Path
1. Introduction
Many researchers have been studying and mining scienti- fic communities using citation network and analysis of the citation network has also become an important tool for their research. Xiaoming Liu employed the analysis me- thod of social network into the co-author network to detect condition variations of the digital libraries and constr- ucted weighted directed citation network to mine the in- ner scientific communities [1]. R. Ichise designed a user- interacted community mining system, in which the val- ues of co-author network parameter can be constructed variably in different needs of users’ purposes. On that basis, they added the author-keyword schema and make a good attempt at clarifying research interests of different scientific communities [2].
A large amount of previous research has been done on citation analysis method, however, these studies and ex-periments are all one-sided, doing survey on certain as-pects of the research, instead of a comprehensive vision. Shortcomings are listed as follows: First of all, the com-parison criterion between relational model is inconsistent. Although the citation path provides association relation-ship between papers, there’s no uniform criterion to quan- tify this relationship. Secondly, there’s no documental multiple correlation. The majority of previous scientific community found are doing survey in a certain aspect of citation path, co-author, coupling, co-citation, and thus it is incomprehensive. Thirdly, the results of the mining groups are impracticality.
This article defines the association strength between authors and the association strength between papers. The formulas of those definitions innovatively combine cou-pling, co-citation, co-author and other structure to make the system more comprehensive. Besides, the proposed OP- TICS algorithm is not sensitive to parameter setting, and it can use heuristic algorithm to estimate the parameter and get good mining results of a large dataset.
2. Build of Citation Network Based on the
Citation Path Structure
Three common types of citation network structures are coupling, co-citation, co-author. This article uses weight- ed directed graphic method to build the network model of citation network. Here are some hypotheses: Firstly, as-suming there’s no fault reference or repeated reference issues between papers. Secondly, association relations between papers can be measured numerically and the tightness of association relations can also be compared by numeric size.
In citation network, a paper is always regarded as a vertex and a relation as an edge, and thus a mesh struc- ture is formed. Then a citation network model based on the citation path can be built according to the below defi- nitions. The first four definitions below can be found in reference [3].
Definition 4) RL (Reference Length) Definition 5) RPR (Reference Path Relation)
RPR is described by reference length between two pa- pers.
1 1 , , n i j i jRPR P P
PRL P P
(1)where there are n citation paths from paper Pi to paper
j
P , and the length of each path is j . The
longer RL is, the less RPR is. The more RP is, the more RPR is. Thus, we use cumulative method.
Pi,
RL P
Definition 6) BCR (Bibliographic Coupling Relation) BCR is described by the reference path from the coup- ling relation papers to the co-citation paper.
1 1 , , , n i j i jBCR P P
RL P P RL P P
(2)where n is the number of co-citation papers by Pi and j
P , P represents the-th paper they co-citation,
P Pi,
RL , RL P P
j,
is separately used to representthe reference length form Pi and Pj to P . As is
shown in the Figure 1,
B, C
1 2
BCR P P , BCR P PB, D 13.
D
P refers A indirectly, so the coupling association
strength between P
D
P and PB is less tight than that of
and
C
P PB.
Definition 7) CCR (Co-citation Relation)
CCR is described by the reference paths from the co- citation paper to the two papers respectively.
1 1 , , , n i j i jCCR P P
RL P P RL P P
(3)where n is the number of co-citation papers of Pi and j
P , P represents the th paper they co-citation,
P Pi,
RL , RL P P
j,
is separately used to represent the reference length formPiandPj to P.Definition 8) PR (Paper Relation)
i, j
1 2 3PR P P RPR BCRCCR (4)
PR is accumulated by weighted RPR, BCR and CCR. These three association strengths present the association relations between two papers from different aspects, thus, their weighted value 1, 2, 3 should be different. In order to discuss the issue, here we set 1 231.0.
Figure 1. Bibliographic coupling relation.
Definition 9) TR (Together write Relation)
If two authors write a paper together, namely co-au- thor, it demonstrates that they share some interrelated research direction. TR is used to represent this kind of association strength.
1 2 , n i j t tTR a a
M
(5)where n is the number of paper co-authored by ai and j
a , Mt represents the number of the authors who
co-author the t-th paper, the PR of each paper is 2Mt,
the overall TR is accumulated by TR of each co-authored paper.
Definition 10) AR (Author Relation)
1 0 0 2 , , , , m n i j i jPR P P PR P P
AR a a
Year P Year P
TR a a
(6)
where m is the total number of the papers author i has
published, n is the total number of the papers author a
j
a has published, P is the th paper author i has
published,
a P is the v-th paper the author aj has
pub-lished, Year P
and Year P
separately represent the year of the published paper P and P . If
PYear P Year , then we set
1Year P Year P .
IfP and P is the same paper, in other words, it is co-authored, then we set
, ,
0
PR P P PR P P
Year P Year P
.
we can use TR a a
i, j
P
to represent their association strength. If andP is not the same paper, then
,
TR a ai j 0, we can also use to represent their association strength. Considering the two parts rep-resent the different association strength, we accumulate them by weights. In order to discuss this issue, here we set
i, jTR a a
1 2 1.0
.
3. Scientific Communities Found Method
Based on Citation Path
3.1. OPTICS Clustering Algorithm
clusterings contain high-density clusterings, as shown in the Figure 2 where 1 is the distance parameter of clus-tering C, 2 is the distance parameter from cluster- ing C1 to C2, and 1 2
npts
Mi
, clustering C includes cluster- ing C1 and clustering C2 completely.
OPTICS algorithm is the extension of the DBSCAN algorithm [5]. Unlike DBSCAN algorithm which gener-ates clustering result after distributing the objects into different clusters [6], OPTICS algorithm stores a cluster order when each object is being clustered [7].Through the order we can get some basic clustering information such as the center of the cluster and inner cluster struc-ture in the object set of the database. As for each object, these information is made up of two parts: core distance and reachable distance.
Definition 11) Core Distance (CD)
In the object se of the database O, the core distance of object p is defined as: if object p is the core object,
, then the distance from object p to its Minpts nearest surrounding object is called the core distance of object p, written as core-distance (p), if object p is not the core object, then the core object of p is UN-DEFINED. In fact core-distance (p) is the minimum
p
Card N
to make object p become a core object, or else core- dis-tance (p) is UNDEFINED.Definition 12) Reachable Distance (RD)
[image:3.595.362.481.84.173.2]In the object se of the database O, reachable distance of object p to object q is the larger one of core-distance (q) and the distance from object p and object q, written as reachable-distance (p,q). If q is not the core object, then reachability-distance (p,q) is UNDEFINED. In fact, rea- chable-distance (p,q) is the minimum direct-density rea- chable distance from object p to object q. Thus, this rea- chable distance cannot be smaller than the core-distance (q), or else there’s no direct density-reachable object to object q. The reachable distance of object p to core object is related to the core distance of the core object. The abo- ve two definitions are as shown as Figure 3.
Figure 2. Global distance and local distance.
Minpts = 4
Figure 3. Core distance of object q and reachable distance of object q to object p.
Given the setting parameters Minpts and the initial distance , the procedure of OPTICS clustering algori- thm can be described as follows:
Step1: Select an unclustered object p from the object set O of the database, and mark this object as clustered.
Step2: According to the parameter, get the object p’s neighbor object set, and set core-distance (p) and reachable- distance (q) according to the neighbor set.
Step3: If core-distance (p) is UNDEFINED, namely this object is the core object, then add neighbors of object p into the priority queue.
Step4: If the priority queue is empty, then go on to the Step 5, or else select the minimum reachability-distance object q in the queue, get the neighbor set of object q, set the core-distance (q) and reachable-distance (q) accord- ing to the neighbor set. If object q is the core object, then add the neighbors of object q into the priority queue, re- peat Step 4.
Step 5: If all the objects in object set O have been mar- ked as clustered, then go to the Step 6, or else to Step 1.
Step 6: Output the sorting result and clustering result according to the core distance and reachable distance of each object, then end this algorithm.
The major advantage of OPTICS algorithms is: it’s not sensitive to the parameters Minpts and , that is, Minpts and do not influence the distribution of the reachable distance, the parameters can be selected randomly at a large scale without affecting the distribution of reachable distance and the inner clustering structure of object set. [8].Unlike DBSCAN algorithm, OPTICS algorithm can employ heuristic to estimate parameter and Minpts ac- cording to experience [9].
3.2. Design of Scientific Communities Found System
[image:3.595.82.258.555.717.2]4. Experiment and Analysis
In the experiment, SMARTY + PHP + MYSQL scheme is used to construct the model, in which SMARTY templa- te is used for visualization display, PHP is used for proc-essing data and controlling the procedure, and MYSQL is used for data storage.
Initial input data of the experiment come from the pa-per set of Wanfang Date (http://www.Wanfangdata.com. cn/). These initial data is acquired in HTML source code format, and processed by PHD program, to extract title, abstract keyword, author, references, publish date and other information of each paper. These information are stored in the MYSQL database.
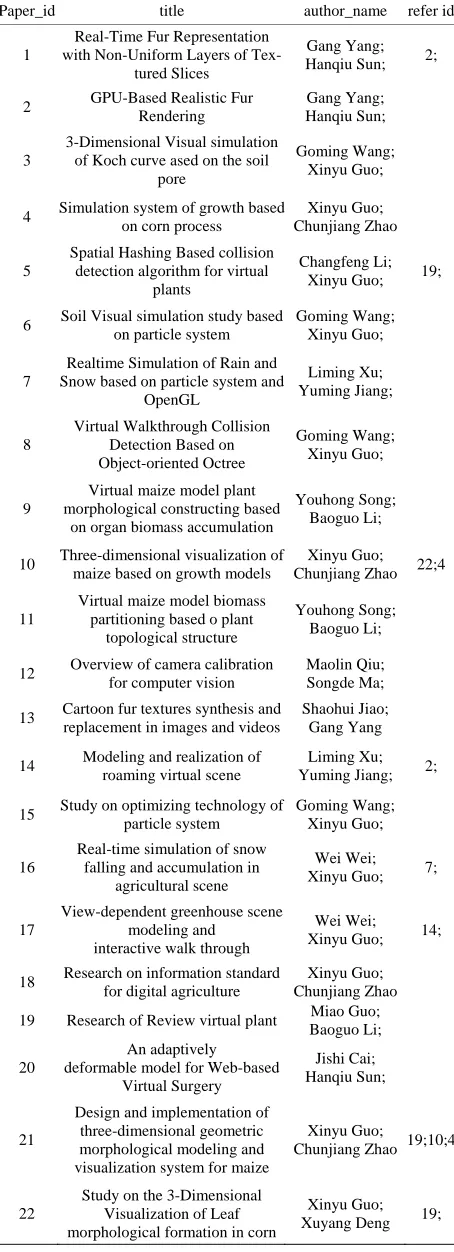
Here, information of 22 papers and 31 authors is ex- tracted from the original database, as shown as Table 1
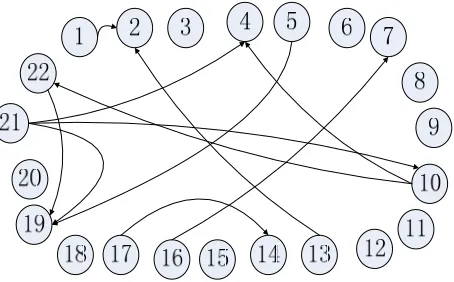
and Table 2. We can construct the citation network, in which each vertex represents each paper, named by the paper_id, and each edge represents the citation relation- ship between two papers.
Based on the citation network structure shown in Fig- ure 5, we use Formular (1) to compute RPR between any two papers and get the RPR matrix of citation network. Similarly, we use Formulas (2) and (3) to compute the BCR matrix and CCR matrix [10]. Then according the Formula (4), we can get PR matrix. Furthermore, we can get AR matrix according Formula (5) and Formula (6), as shown as Figure 6. After computing the AR matrix. we can get the distance between any two authors and cluster the author objects.
[image:4.595.310.537.114.740.2]In the experiment, we set = 5, Minpts = 4, the au- thor object cluster order after data clustering is: 1, 2, 28, 29, 3, 24, 25, 4, 5, 6, 12, 7, 13, 26, 27, 9, 8, 20, 19, 11, 15, 14, 16, 10, 30, 31, 17, 18, 21, 22, 23, in which the numbers is id of the author object in the database). When we Set = 3.0, 2, 28, 29 belong to one cluster; 24, 25 belong to one cluster; 6, 12, 7, 13, 26, 27, 9, 8, 20, 19, 11, 15, 14, 16, 10, 30, 31, 17, 18 belong to an-other cluster; the an-others are noise. That means that au-thor 2, 28, and 29 form a scientific community; auau-thor 24 and 25 form another community; 6, 12, 7, 13, 26, 27, 9, 8, 20, 19, 11, 15,
[image:4.595.57.286.586.720.2]Figure 4. Scientific communities found system.
Table 1. Papers’ information extracted from the original da- tabase.
Paper_id title author_name refer id
1
Real-Time Fur Representation with Non-Uniform Layers of
Tex-tured Slices
Gang Yang; Hanqiu Sun; 2;
2 GPU-Based Realistic Fur Rendering
Gang Yang; Hanqiu Sun;
3
3-Dimensional Visual simulation of Koch curve ased on the soil
pore
Goming Wang; Xinyu Guo;
4 Simulation system of growth based on corn process
Xinyu Guo; Chunjiang Zhao
5
Spatial Hashing Based collision detection algorithm for virtual
plants
Changfeng Li; Xinyu Guo; 19;
6 Soil Visual simulation study based on particle system Goming Wang;Xinyu Guo;
7
Realtime Simulation of Rain and Snow based on particle system and
OpenGL
Liming Xu; Yuming Jiang;
8
Virtual Walkthrough Collision Detection Based on Object-oriented Octree
Goming Wang; Xinyu Guo;
9
Virtual maize model plant morphological constructing based
on organ biomass accumulation
Youhong Song; Baoguo Li;
10 Three-dimensional visualization of maize based on growth models
Xinyu Guo; Chunjiang Zhao 22;4
11
Virtual maize model biomass partitioning based o plant
topological structure
Youhong Song; Baoguo Li;
12 Overview of camera calibration for computer vision
Maolin Qiu; Songde Ma;
13 Cartoon fur textures synthesis and replacement in images and videos
Shaohui Jiao; Gang Yang
14 Modeling and realization of roaming virtual scene
Liming Xu; Yuming Jiang; 2;
15 Study on optimizing technology of particle system Goming Wang;Xinyu Guo;
16
Real-time simulation of snow falling and accumulation in
agricultural scene
Wei Wei; Xinyu Guo; 7;
17
View-dependent greenhouse scene modeling and interactive walk through
Wei Wei; Xinyu Guo; 14;
18 Research on information standard for digital agriculture
Xinyu Guo; Chunjiang Zhao
19 Research of Review virtual plant Miao Guo; Baoguo Li;
20
An adaptively deformable model for Web-based
Virtual Surgery
Jishi Cai; Hanqiu Sun;
21
Design and implementation of three-dimensional geometric morphological modeling and visualization system for maize
Xinyu Guo;
Chunjiang Zhao 19;10;4
22
Study on the 3-Dimensional Visualization of Leaf morphological formation in corn
Table 2. Part authors’ information extracted from the da- tabase.
author_id author_name paper_id list
1 Gang Yang 1; 2; 13;
2 Qiuhan Sun 1; 2; 20;
3 Wencheng Wang 1; 2;
4 Enhua Wu 1; 2; 13;
5 Gongming Wang 3; 6; 8; 15;
6 Xinyu Guo 3; 4; 6; 8; 10; 15; 16; 17; 18; 21; 22;
7 Chunjiang Zhao 3; 4; 6; 8; 10; 15; 16; 17; 18; 21; 22;
8 Jihua Wang 4; 6; 8; 15; 21; 22;
9 Changfeng Li 5;
10 Shenglian Lu 5; 6; 17;
11 Yueying Yang 5;
12 Liming Xu 7; 14;
13 Yuming Jiang 7; 14;
14 Yonghong Song 9; 11;
[image:5.595.56.539.105.734.2]15 Miao Guo 9; 11; 19;
Figure 5. Citation network structure.
14, 16, 10, 30, 31, 17, 18 can form a large scientific community; the other authors are scatter points.
5. Conclusions
This article researched on the structure of the citation network based on the citation path [11], defined the asso- ciation relations between papers to transfer the scientific communities found model in the database to a clustering issue of points in the space. Besides, by using OPTICS algorithm, there’s no need for users to concern about the selection of the parameters and clusters of any shape can be found effectively in a more practical way [12].
In order to test and analyze conveniently, the number of selected papers is not large and all of them are in Chi- nese. This article hypothesis there’s no fault reference or repeated reference, while in fact, these problems are qui- te likely to happen. So our future work is to improve the model, doing research on how to deal with those issues and filter the citation path accurately.
6. Acknowledgements
This article is supported by (1) the National Natural Sci- ence Foundation of China under Grant No. 60873146, 60973092, 60903097; (2) the science and technology development key project of Jilin province under Grant No. 20110354; (3) the Key Laboratory for Symbol Com- putation and Knowledge Engineering of the National Edu- cation Ministry of China.
REFERENCES
[1] X. M. Liu, J. Bollen and M. Nelson, “Co-Authorship Networks in the Digital Library Research Community,”
Information Processing and Management, Vol. 41, No. 5, 2005, pp. 1462-1480.doi:10.1016/j.ipm.2005.03.012 [2] R. Ichise, H. Takeda and T. Muraki, “Research
Commu-nity Mining with Topic Identification,” Proceedings of the Information Visualization, London, 2006, pp. 276- 281.
[3] H. X. Lin, “Scientific Group Mining Based on the Cita-tion Network,” Master DissertaCita-tion, Fudan University, Shanghai, 2009.
[4] N. Ma and J. C. Guan, “Survey on the Mining Algorithm
Based on the Network Structure,” Informatics Disciple, Vol, 13, No. 1, 2008, pp. 3-14.
[5] K. Börner, L. Dall’Asta, W. Ke and A. VeSPignani, “Studying the Emerging Global Brain: Analyzing and Visualizing the Impact of Co-Authorship teams,” Com-plexity, Vol. 10, No. 4, 2005, pp. 57-67.
doi:10.1002/cplx.20078
[6] M. J. Bommarito, D. M. Katz, J. L. Zelner and J. H. Fowler,” Distance Measures for Dynamic Citation Net-works,” Elsevier, Amsterdam, Vol. 289, No. 19, 2010, pp. 4201-4208.
[7] Y. Takeda and Y. Kajikawa, “Tracking Modularity in Citation Networks,” Scientometrics, Vol. 82, No. 3, 2010, pp. 783-792.doi:10.1007/s11192-010-0158-z
[8] G. Z. Wang and G. L. Wang, “Improved Quick DBSCAN Algorithm,” Journal of Computer Applications, Vol. 26, No. 15, 2009, pp. 2364-2373.
[9] S. K. Zhou, A. Y. Zhou and J. Cao, “DBSCAN Algorithm Based on Data Partition,” Journal of Computer Research and Development, Vol. 2, No. 2, 2000, pp. 169-194.
[10] H.-P. Kriege and M. Pfeifle, “Density-Based Clustering of Uncertain Data,” Proceedings of the 11th ACM SIGKDD International Conference on Knowledge Dis-covery in Data Mining, New York, 2005.
doi:10.1145/1081870.1081955
[11] J. Liu and X. S. Ma, “Improved DBSCAN Clustering Algorithm’s Study and Application,” Communication and Computer, China, 2008.