A Report on the 2017 Native Language Identification Shared Task
Shervin Malmasi1,2, Keelan Evanini3, Aoife Cahill3, Joel Tetreault4 Robert Pugh5, Christopher Hamill3, Diane Napolitano3 and Yao Qian5
1Harvard Medical School, Boston, MA, USA 2Macquarie University, Sydney, Australia 3Educational Testing Service, Princeton, NJ, USA
4Grammarly, New York, NY, USA
5Educational Testing Service, San Francisco, CA, USA
[email protected], {kevanini,acahill}@ets.org, [email protected]
Abstract
Native Language Identification (NLI) is the task of automatically identifying the native language (L1) of an individual based on their language production in a learned language. It is typically framed as a classification task where the set of L1s is known a priori. Two previous shared tasks on NLI have been organized where the aim was to identify the L1 of learners of English based on essays (2013) and spoken responses (2016) they pro-vided during a standardized assessment of academic English proficiency. The 2017 shared task combines the inputs from the two prior tasks for the first time. There are three tracks: NLI on the essay only, NLI on the spoken response only (based on a transcription of the response and i-vector acoustic features), and NLI using both re-sponses. We believe this makes for a more interesting shared task while building on the methods and results from the previous two shared tasks. In this paper, we report the results of the shared task. A total of 19 teams competed across the three dif-ferent sub-tasks. The fusion track showed that combining the written and spoken responses provides a large boost in pre-diction accuracy. Multiple classifier sys-tems (e.g.ensembles and meta-classifiers) were the most effective in all tasks, with most based on traditional classifiers (e.g.
SVMs) with lexical/syntactic features.
Visit the website for more info about the task:
https://sites.google.com/site/nlisharedtask/
1 Introduction
Native Language Identification (NLI) is the task of automatically identifying the native language (L1) of an individual based on their writing or speech in another language (L2). NLI works by identify-ing language use patterns that are common to cer-tain groups of speakers that share the same native language. This process is underpinned by the pre-supposition that an author’s linguistic background will dispose them towards particular language pro-duction patterns in their learned languages, as in-fluenced by their mother tongue.
Predicting the native language of a writer has applications in different fields. It can be used for authorship identification (Estival et al.,2007), forensic analysis (Gibbons, 2003), tracing lin-guistic influence in potentially multi-author texts (Malmasi et al., 2017), and naturally to support Second Language Acquisition research (Malmasi and Dras,2014). It can also be used in educational applications such as developing grammatical er-ror correction systems which can personalize their feedback and model performance to the native lan-guage of the user (Rozovskaya and Roth,2011).
Most work in NLI focused on predicting the na-tive language of an ESL (English as a Second Lan-guage) writer based on a sample essay, although NLI has also been shown to work on other lan-guages (Malmasi and Dras,2015). Work by Kop-pel et al.(2005),Tsur and Rappoport(2007)Wong and Dras (2009), and Tetreault et al. (2012) set the stage for much of the recent research efforts. However, it was the 2013 Native Language Iden-tification Shared Task (Tetreault et al., 2013) that led to an explosion of interest in this area by mak-ing public a large dataset developed specifically
for this task called the TOEFL11 (Blanchard et al.,
2013). In that shared task, 29 teams participated, making it one of the largest NLP competitions that year alone.
In addition to analyzing the written responses, a recent trend in NLP research has been the use of speech transcripts (generated manually or via Au-tomatic Speech Recognition) and audio features for dialect identification (Malmasi et al.,2016), a task that involves identifying specific dialects of pluricentric languages, such as Spanish or Ara-bic.1 The combination of transcripts and acoustic features has also provided good results for dialect identification (Zampieri et al., 2017b), demon-strating that it is possible to improve performance by combining this information.
While there has been growing interest in using such features, the use of speech transcripts for NLI is not entirely new. In fact, the very first NLI study by Tomokiyo and Jones (2001) was based on applying a Naive Bayes classifier to transcrip-tions of speech from native and non-native speak-ers, albeit using limited data. However, this strand of NLI research has not received much attention, most likely due to the costly and laborious nature of collecting and transcribing non-native speech. Following this trend, the 2016 Computational Par-alinguistics Challenge (Schuller et al.,2016) also included an NLI task based on the spoken response using the raw audio.
The NLI Shared Task 2017 attempts to combine these approaches by including a written response (essay) and a spoken response (speech transcript and i-vector acoustic features) for each candidate. The competition also allows for the fusion of all features, a novel task that has not been previously tried. Another motivation for this task was the rapid growth of deep learning methods for natu-ral language processing tasks (Manning,2015). In prior shared tasks, there were several barriers to using deep learning for NLP. However, deep learn-ing has now had a positive impact on many tasks across NLP and it is an area of investigation on whether the same successes can be found in NLI.
In the following section, we provide a summary of the prior work in Native Language Identifica-tion, for both text and speech based tracks. Next, in§3, we describe the data used for training, de-1NLI could also be framed as a dialect identification task if we assume that each L1 group has their own interlan-guage/dialect which is influenced by their L1.
velopment, and testing in this shared task. In §4
we describe the results of each sub-task, with a short description of each team’s submission. Then in§5, we discuss the commonalities and trends in and across the three sub-tasks, and present an en-semble analysis of all submissions. Finally, in§6, we offer conclusions and ideas for avenues of re-search in this growing field.
2 Related Work
NLI is most commonly framed as a supervised classification task, where features are extracted from a linguistic response produced by non-native speakers, and used to train a classification model. NLI is a recent, but rapidly growing, area of re-search. While some early research was conducted in the early 2000s, most work has only appeared in the last few years.
2.1 Text-based NLI
Most NLI research has focused on English texts where both lexical and syntactic features (often based on n-gram frequency profiles) have been used. Popular lexical features include character, word and lemma n-grams, while syntactic fea-tures are based on constituent parse trees, depen-dency parse features and part-of-speech tags. Sup-port Vector Machine (SVM) models have been the most prevalent classification approach. Re-searchers have mainly focused on experimenting with different features and methods of combining them. While a detailed analysis of previous work is beyond the scope of this report, a comprehen-sive exposition of NLI research from 2001-2015, including all of the systems from the first shared task, can be found inMalmasi(2016, Section 2.3). The winning entry for the 2013 shared task was that ofJarvis et al. (2013), achieving 83.6% in terms of accuracy (the official metric). The features used in the system include n-grams of words, parts-of-speech, and lemmas. A log-entropy weighting schema was used to normalize the frequencies. An L2-regularized SVM classi-fier was used to create a single-model system.
84.82% on this data. Ionescu et al. (2014) used string kernels to perform NLI. They create several string kernels which are then combined through multiple kernel learning. They report an accuracy of 85.3% on the 2013 Test set, 1.7% higher than the winning shared task system. More recently,
Malmasi and Dras(2017) presented a thorough ex-amination of meta-classification models for NLI, achieving state-of-the-art results on three datasets from different languages, including an accuracy of 87.1% on the 2013 data.
2.2 Speech-based NLI
The task of speech-based NLI is closely related to the tasks of language identification and dialect identification, for which substantially more re-search has been conducted. For those tasks, the two main types of approach are based on acous-tic features (Dehak et al., 2011) and phonotac-tic features (Zissman, 1996). For further details we refer the reader toRao and Nandi (2015) and
Etman and Beex (2015) which provide compre-hensive overviews of the different approaches that have been taken for speech-based language and di-alect identification.
The 2016 Computational Paralinguistic Chal-lenge on NLI was designed to explore the related task of speech-based NLI in more detail. The data set for that task contained 64 hours of speech from 5,132 non-native speakers of English (ap-proximately 45 seconds per speaker) representing the same 11 L1 backgrounds as the 2013 NLI Shared Task corpus. Each language was repre-sented by recordings ranging from 458 to 485 dif-ferent speakers representing a range of English speaking proficiencies. The best performing sys-tem in the challenge was that ofAbad et al.(2011): their system used i-vector features that were based on Phone Log-Likelihood Ratios and achieved a performance of 81.3% (in terms of Unweighted Average Recall, which was the evaluation metric for the challenge) on the test set.
3 Task Description and Data
There were three tracks in the NLI Shared Task 2017: essay-only, speech-only, and fusion. The corpus consists of both written essays and ortho-graphic transcriptions of spoken responses. These were provided by test takers in the context of a standardized assessment of a non-native speaker’s ability to use and understand English for academic
purposes at the university level, TOEFLR iBT. There were 11,000 test takers included in the train-ing data (1,000 per L1) and 1,100 each for devel-opment and test (100 per L1). The 11 L1 back-grounds included in the NLI Shared Task 2017 were identical to the 2013 and 2016 shared tasks: Arabic, Chinese, French, German, Hindi, Italian, Japanese, Korean, Spanish, Telugu, and Turkish. These L1s and their language families are shown in Figure1.
The test takers’ essays and spoken responses were elicited by test questions (hereafter referred to as prompts) asking about an opinion (e.g., which of two choices the test taker would pre-fer) or a personal experience. A total of 8 essay prompts were included in the training and devel-opment partitions and 7 of these were represented in the test partition; a total of 9 different speaking prompts were included in the training and devel-opment partitions and 7 of these were represented in the test partition. Prompt IDs for both the es-says and the spoken responses were provided with the corpus. We tried to ensure the the data was as balanced as possible by prompt (in addition to by L1), though we did not always have enough data for all L1s for some prompts.
In the essay-onlytrack, the task was to predict the L1 of a candidate based only on an essay writ-ten in English. The essay training data consisted of the training plus development data used in the NLI Shared Task 2013, while the development es-say data consisted of the test data from the 2013 task. The test data for this track was new, previ-ously unreleased data. The average length of the essays across all three partitions was 316.2 words (SD: 77.6, Min.: 2, Max.: 796).
Dravidian
Telugu Afro-Asiatic
Arabic Sino-Tibetan
Chinese Altaic
Turkish Korean
Japanese Indo-European
Indo-Iranian
Hindi Germanic
German Romance
Spanish Italian
French
Figure 6. Language families in corpus
[image:4.595.76.531.68.142.2]16
Figure 1: Language families in the task. The languages were selected to represent different families, but to also have several from within the same families. Diagram reproduced fromBlanchard et al.(2013).
the speech signal (Dehak et al., 2011; Martınez et al.,2011). The dimensions of the i-vectors (800) and number of Gaussian components (1024) were tuned on the development set by using the Kaldi toolkit.2 In order to be able to distinguish the ef-fects of new features or approaches, participants were encouraged to clearly describe the relative contribution of their features on the task both with and without the i-vector features.
In the fusiontrack, the task was to predict the L1 of a candidate using the combination of their written essay and spoken response.
The training and development data were re-leased in two phases. The first phase consisted of only the essays, while the second phase con-sisted of the spoken transcriptions and optionally i-vectors. Simple baseline scripts that used uni-gram features and an SVM learner were also pro-vided for each track.
There were both open and closed competitions for each track. In the closed competition, only the data provided could be used for training (though
features based on external data sources such as language models or parsers could be included). In the open competition, additional NLI training data could be used to help improve predictions. There were no submissions to the open competition.
The test period for each track lasted 3 days, and teams could submit up to 12 systems per track. The essay-only and speech-only test phases ran concurrently. The IDs for the essay data and tran-scription data were generated by separate random processes for this test period. For the fusion test period, an updated package providing linked IDs between the essay and spoken transcription data was released.
2http://kaldi-asr.org
3.1 Evaluation and Ranking
The majority of NLI research to date has reported results using accuracy as the main metric. For this task, however, we decided to use the macro-averaged F1-score as the official evaluation met-ric. The macro-averaged F1-score is calculated by first computing the F1-score for each class, and then taking the average across all classes (Yang and Liu, 1999). This metric favors more consis-tent performance across classes rather than simply measuring global performance across all samples. Accuracy was still reported for completeness.
We also used statistical significance testing for ranking purposes. McNemar’s test3(with an alpha value of 0.05) was applied to the ordered results to identify groups of teams where the highest and lowest results were not significantly different, and they were therefore assigned the same rank.
For comparison, we compare to two types of baselines: a random baseline and one that use a linear SVM classifier. There were three random baselines, one for each task, and five simple SVM baselines in total across the three tasks. For the essay-only task there was one baseline based on raw unigram frequencies from the essay texts. For the speech-only task there were two baselines: one an SVM based on raw unigram frequencies from the orthographic transcriptions alone, and a sec-ond SVM that combined the unigram features with the i-vectors using horizontal concatenation. For the fusion task there were two baselines: one, an SVM combining the unigrams from the essays and the transcriptions, and a second SVM combining the unigrams from the essays and the transcrip-tions with the i-vectors.
4 Results
A total of 19 teams participated in the task, 17 of which submitted system description papers. Participation across the three tracks varied, with 17 participants in the essay-only track, 9 in the speech-only track, and 10 in the fusion track. The results for each track are described in the follow-ing sections. For every track we briefly outline each team’s best system. Interested readers can refer to the team’s paper for more details.
4.1 Essay-only Track
The best essay-only submission for each team, along with rankings and other details, are listed in Table 4.1. Each team’s best system is briefly described below, ordered by rankings.
ItaliaNLP Lab (Cimino and Dell’Orletta,2017) utilize a novel classifier stacking approach based on a sentence-level classifier whose predictions are used by a second document-level classifier. The sentence classifier is based on a Logistic Re-gression model trained on standard lexical, stylis-tic, and syntactic NLI features. The document-classifier is an SVM, trained using the same fea-tures, as well as the sentence prediction labels. Their experiments indicate that inclusion of the sentence prediction features provides a small in-crease in performance.
CIC-FBK (Markov et al., 2017) build an SVM with multiple lexical and syntactic features. They introduce two new feature types – typed charac-ter n-grams and syntactic n-grams – and combine them with word, lemma, and POSn-grams, func-tion words, and spelling error charactern-grams. Features are weighted using log-entropy.
Groningen (Kulmizev et al.,2017) achieve their best results using a very simple system based on character 1-9 grams. Features are counted in a bi-nary fashion and normalized via tf-idf. They also conducted experiments omitting data from some prompts during training and observe that perfor-mance can drop considerably, depending on which prompt is left out.
NRC (Goutte and L´eger,2017) explored various ways of building ensemble models to make the final prediction. Relatively simple features were used (character, word, and POSn-grams). Their best run for this track was a voting ensemble with 10 SVM models.
tubasfs (Rama and C¸¨oltekin, 2017) used a sin-gle SVM classifier trained on word bigrams and character 7-grams. They tried a variety of n-gram combinations and found this to work best on the development data.
UnibucKernel (Ionescu and Popescu,2017) use different types of character-level string kernels which are combined with multiple kernel learning. WLZ (Li and Zou, 2017) build an ensemble of single-feature SVMs fed into a multi-layer percep-tron (MLP), which is a meta-classifier trained on the outputs of the base SVM classifiers. The sgle features are based on lexical and syntactic in-formation and the best submission includes char-acter, word, stem, and function wordn-grams as well as syntactic dependencies.
Uvic-NLP (Chan et al., 2017) trained a single SVM model on wordn-grams (1–3) and character
n-grams (4-5). They also conducted several post-evaluation experiments, improving their results to 0.8730using an LDA meta-classifier trained on in-dividual SVM classifiers.
ETRI-SLP (Oh et al., 2017) designed a system that was based on word n-gram features (with n
ranging from 1 to 3) and character n-gram fea-tures (withnranging from 4 to 6). The normalized count vectors based on these features were used to extract LSA features, which were then reduced us-ing LDA. The count and LSA-LDA features were used to train SVM and DNN classifiers whose out-puts were subsequently combined via late fusion in a DNN-based ensemble classifier.
Rank Team F1 Acc. Approach
1 ItaliaNLP Lab 0.8818 0.8818 Stacked classifier w/ lexical and syntactic features
1 CIC-FBK 0.8808 0.8809 SVM with log-entropy weightedn-gram and syntactic features 1 Groningen 0.8756 0.8755 Linear SVM with charactern-grams (1-9)
1 NRC 0.8740 0.8736 Voting ensemble w/ SVM models using lexical/syntactic features 1 tubasfs 0.8716 0.8718 SVM trained on word bigrams and char 7-grams
1 UnibucKernel 0.8695 0.8691 Character-level string kernels combined w/ multiple kernel learning 1 WLZ 0.8654 0.8655 MLP meta-classifier trained on SVMs w/ lexical/syntactic features 2 Uvic-NLP 0.8633 0.8636 SVM trained on word and charactern-grams
2 ETRI-SLP 0.8601 0.8600 Ensemble of SVMs & DNNs using LSA-LDA features 2 CEMI 0.8536 0.8536 LogReg meta-classifier trained on word/char/POS base models 3 RUG-SU 0.8323 0.8318 Ensemble of resnets, LSTM and document embeddings 3 NLI-ISU 0.8264 0.8264 Logistic Regression model with wordn-grams (1-3) 3 IUCL 0.8262 0.8264 Phonetic features combined in an SVM
3 GadjahMada 0.8107 0.8110 Char embeddings w/ a feed-forward NN classifier 4 superliuxz 0.7896 0.7900 No paper submitted.
4 ltl 0.7676 0.7673 No paper submitted.
5 ut.dsp 0.7609 0.7636 n-gram language models over characters (3-4) and words (1-2)
Word Unigram Baseline 0.7104 0.7109 Linear SVM trained on word unigrams
Random Baseline 0.0910 0.0910 Randomly select an L1
Table 1: Official results in the essay-only track. The official metric is the macro-averaged F1-score. Accuracy (Acc.) is also reported. Rankings are determined by statistical significance testing (see§3.1).
NLI-ISU (Vajjala and Banerjee,2017) explored the use of n-grams and embeddings in their sub-missions. Their best run was a Logistic Regres-sion model trained on word 1-3 grams. They also report that spell checking features, as well as word and document embeddings did not work well on the development data.
IUCL (Smiley and K¨ubler, 2017) investigated the use of phonetic features for the essay classi-fication task based on the hypothesis that speak-ers from different L1 backgrounds may tend to use English words that match sounds in their own L1 more frequently than speakers from other L1 backgrounds. They explored three sets of phonetic features based on algorithms for fuzzy text match-ing (Soundex, Double Metaphone, and NYSIIS) as well as a set of features based on representa-tions of the words using the CMU Pronouncing Dictionary. While none of these feature sets indi-vidually outperformed a system based on charac-tern-grams, the addition of the Double Metaphone features to the charactern-gram features led to a small performance improvement.
GadjahMada (Sari et al.,2017) apply a charac-ter embedding model with a feed-forward neural network classifier in the essay track. This is based on the relatively high performance of charactern -grams in previous research. An embedding size of 25 was used withn-grams of length 2–5.
ut.dsp (Mohammadi et al.,2017) utilizen-gram language models over words and characters. For each L1, a language model over character 3- and 4-grams as well as word unigrams and bigrams is calculated and smoothing is applied. For each text in the test set, the probably of the whole text for all language models in each class is calculated and the class with the maximum probability is chosen as the predicted label. This approach does not in-volve any supervised learning.
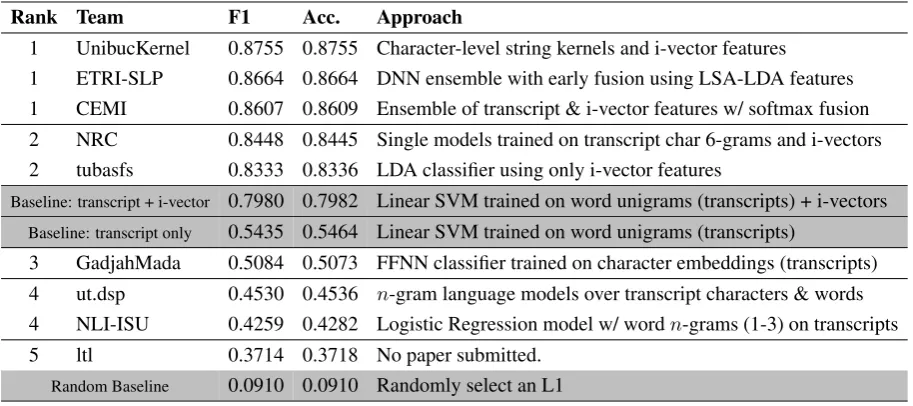
4.2 Speech-only Track
[image:6.595.76.535.66.370.2]Rank Team F1 Acc. Approach
1 UnibucKernel 0.8755 0.8755 Character-level string kernels and i-vector features
1 ETRI-SLP 0.8664 0.8664 DNN ensemble with early fusion using LSA-LDA features 1 CEMI 0.8607 0.8609 Ensemble of transcript & i-vector features w/ softmax fusion 2 NRC 0.8448 0.8445 Single models trained on transcript char 6-grams and i-vectors 2 tubasfs 0.8333 0.8336 LDA classifier using only i-vector features
Baseline: transcript + i-vector 0.7980 0.7982 Linear SVM trained on word unigrams (transcripts) + i-vectors Baseline: transcript only 0.5435 0.5464 Linear SVM trained on word unigrams (transcripts)
3 GadjahMada 0.5084 0.5073 FFNN classifier trained on character embeddings (transcripts) 4 ut.dsp 0.4530 0.4536 n-gram language models over transcript characters & words 4 NLI-ISU 0.4259 0.4282 Logistic Regression model w/ wordn-grams (1-3) on transcripts 5 ltl 0.3714 0.3718 No paper submitted.
Random Baseline 0.0910 0.0910 Randomly select an L1
Table 2: Official results in the speech-only track. The official metric is the macro-averaged F1-score. Accuracy (Acc.) is also reported. Rankings are determined by statistical significance testing (see§3.1).
UnibucKernel (Ionescu and Popescu,2017) ex-tend their essay-only system based on character-level string kernels to include the transcription data, as well as an additional kernel for the i-vector features. The various models are combined using multiple kernel learning.
ETRI-SLP (Oh et al., 2017) submitted a sys-tem for the Speech task that was similar to their submission for the Essay task, although the SVM classifiers and one of the DNN classifiers were not used in the ensemble classifier. They exper-imented with both late fusion and early fusion for combining the text-based features with the i-vectors and obtained the best results with an early-fusion ensemble classifier.
CEMI (Ircing et al.,2017) attained their best re-sult with an ensemble consisting of a SGD classi-fier trained on transcript word features and a feed-forward neural network trained on the i-vector fea-tures. The final prediction is selected via softmax combination.
NRC (Goutte and L´eger, 2017) use a single classifier trained on transcript character 6-grams and the i-vector features to achieve their best speech-only results.
tubasfs (Rama and C¸¨oltekin, 2017) used an LDA classifier using only the i-vector features, a simple approach that yielded good results.
GadjahMada (Sari et al.,2017) did not use the i-vector features for the speech track, applying their character embedding model from the essay track to the transcripts.
ut.dsp (Mohammadi et al.,2017) apply theirn -gram language model from the essay-only track to the transcripts.
NLI-ISU (Vajjala and Banerjee,2017) did not use the i-vector features for the speech track, in-stead applying theirn-gram based model from the essay track. They report that the essay features do not work very well for transcripts, hypothesizing that this may be due to the shorter texts.
4.3 Fusion Track
The best fusion submission for each team, along with rankings and other details, are listed in Ta-ble 4.3. Each team’s best system is briefly de-scribed below, ordered by rankings.
[image:7.595.74.531.62.265.2]Rank Team F1 Acc. Approach
1 UnibucKernel 0.9319 0.9318 Character-level string kernels and i-vector features 1 CEMI 0.9257 0.9255 NN meta-classifier over lexical/syntactic/i-vector features 1 ETRI-SLP 0.9220 0.9218 DNN ensemble with early fusion using LSA-LDA features 1 NRC 0.9193 0.9191 Voting ensemble w/ half sampling to choose the SVM models 2 tubasfs 0.9175 0.9173 Ensemble w/ word/charn-grams (essay/transcript) & i-vectors 3 GadjahMada 0.8414 0.8409 FFNN trained on essay character embeddings and i-vectors 3 L2F 0.8377 0.8391 BPEn-grams, NN fusion, i-vector post-processing
3 ZCD 0.8358 0.8355 Ensemble of word/char.n-gram and i-vector SVM classifiers
Baseline: essay/transcript/i-vector 0.7901 0.7909 SVM trained on word unigrams (essay/transcript) + i-vectors Baseline: Essay + Transcript 0.7786 0.7791 Linear SVM trained on word unigrams (essays + transcripts)
4 ut.dsp 0.7748 0.7764 n-gram language models over chars/words (essay+transcript) 5 ltl 0.7346 0.7345 No paper submitted.
Random Baseline 0.0910 0.0910 Randomly select an L1
Table 3: Official results in the fusion track. The official metric is the macro-averaged F1-score. Accuracy (Acc.) is also reported. Team rankings are determined by statistical significance testing (see§3.1).
ETRI-SLP (Oh et al.,2017) submitted a system for the Fusion task that was similar to their sub-missions for the Essay and Speech tasks, although the SVM and DNN classifiers were not used in the ensemble classifier; their ensemble classifier for the fusion task only combined the LSA-LDA fea-tures and the i-vectors. As with the Speech task, they experimented with both late fusion and early fusion for combining the text-based features with the i-vectors and obtained the best results with an early-fusion ensemble classifier.
NRC (Goutte and L´eger,2017) explored various ways of building ensemble models to make the final prediction. Relatively simple features were used (character, word, and POSn-grams). For the fusion track, their best submission usedhalf sam-plingwhich uses one half of the data to estimate the best number of models to include in the fi-nal voting ensemble, and the other half to estimate which models to include.
tubasfs (Rama and C¸¨oltekin,2017) obtain their best result with an ensemble model based on mean probability combination. The ensemble includes individual SVM models trained on word and char-actern-grams from essays and transcripts, and an LDA classifier trained on the i-vector features. GadjahMada (Sari et al., 2017) extended their essay-based character embedding model to in-clude i-vectors for the fusion track. They did not use the speech transcript data.
L2F (Kepler et al.,2017) designed a system that combined three types of text-based classifiers (an RNN with a bidirectional GRU layer, a Naive Bayes classifier with byte n-grams, and a Naive Bayes classifier withn-grams based on representa-tions of the words using Byte Pair Encoding) with versions of the i-vector features that were post-processed using centering and whitening in an at-tempt to reduce channel variability. These classi-fiers were combined together in a Neural Network fusion approach and the authors demonstrated that the i-vector features were the main driver of per-formance.
ZCD (Zampieri et al.,2017a) used an approach based on ensembles of multiple SVM classifiers. Separate SVM classifiers were trained using char-actern-grams (with n ranging from 1 to 10) and word n-grams (with n ranging from 1 to 2). In-dividual classifiers with cross-validation perfor-mance lower than 0.8 were retained in the ensem-ble; the classifiers that were retained were based on charactern-grams with n in6,7,8. Thesen -gram-based classifiers were then combined into an ensemble with a classifier based on the i-vector features and the majority vote from the ensemble was taken as the final prediction.
[image:8.595.73.531.62.277.2]5 Discussion and Analysis
In this section we synthesize the overarching find-ings from this edition of the NLI shared task.
5.1 Primary Trends
Multiple Classifier Systems are very effective. Almost all of the top ranked teams employed some type of multiple classifier system, including meta-classifiers (classifier stacking), ensemble combi-nation methods (voting and probability based fu-sion), and multiple kernel learning. Their use has become much more prevalent compared to the pre-vious shared task.
Lexical n-grams are the best single feature type. Surface form features such as word and character
n-grams continue to be the powerhouse feature for the text classification tasks. Evidence from vari-ous participants suggests that high-order character
n-grams (as high asn= 10) are extremely useful for this task. This is likely because when extracted across word boundaries, these features capture not only sub-word (e.g. morphological) information, but also dependencies between words. However, it should also be noted that the top systems in all tracks made use of syntactic features which can give them a slight performance boost. This is not surprising as it has been shown that lexical and syntactic features each capture diverse types of in-formation that are complementary (Malmasi and Cahill,2015).
Feature weighting schemes are important. Similar to past results, many of the top teams ap-ply a form of feature weighting (such as TF-IDF or log-entropy) to their data.
Acoustic features are highly informative for speech-based NLI. Using only text-based fea-tures over the transcripts did not work well, and teams that did not utilize the i-vector features per-formed much worse in the speech-only track. The top-ranked teams combined the transcripts and i-vectors.
Speech transcript features did not perform well. Teams that used only the transcript features did not fare well in the speech track. This could be due to the different types of linguistic phenomena that are present in spontaneous speech, which may be less informative than those found in the essays.
Various teams also hypothesize that this may po-tentially be due to their relatively shorter lengths compared to the essays (see§3for stats).
Fusion of writing and speech features provides the best results. The substantial performance in-crease between the essay/speech tracks and the fu-sion track indicates that the acoustic features are complementary and lead to much more reliable re-sults.
Traditional classifier models continue to domi-nate text classification tasks. It has been noted that traditional supervised learning models out-perform newer deep learning approaches on high-dimensional text classification tasks (Malmasi et al.,2016,§6.2). The results from this NLI task do not provide any evidence to suggest otherwise; almost all of the top teams in the essay-only track used an SVM or similar linear model. Uvic-NLP (Chan et al., 2017) compared SVMs and neural network models, finding that SVM models achieve better results with shorter training times.
Average performance is much higher than 2013. Although much of the training data remains the same, the submissions were much more com-petitive than the first NLI shared tasks. This is likely due to NLI being a much more estab-lished task, as well as the aforementioned preva-lence of more sophisticated models such as meta-classifiers.
A number of open questions remain. For ex-ample, it is not clear if any one approach is dom-inant across all tracks as most of the top-ranked teams in the essay track did not participate in the other tracks. It is hard to say how well their sys-tems would have done in the other tracks, but the trends from the teams who did participate in all tracks suggest that their approaches could have done well.
2013 2017
Essay Speech Fusion
# Systems 29 17 9 10
Shared Task Best 0.8359 0.8818 0.8755 0.9319
Oracle 0.9791 0.9628 0.9572 0.9809
Accuracy@3 0.9555 0.9592 0.9508 0.9764
Accuracy@2 0.9218 0.9501 0.9290 0.9700
[image:10.595.176.421.61.191.2]Plurality Vote 0.8425 0.8793 0.8508 0.9319
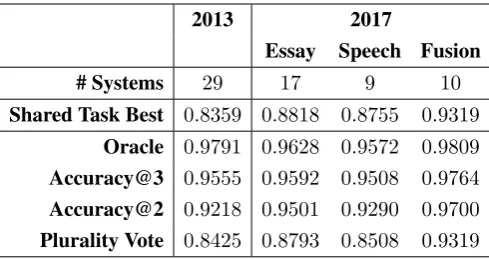
Table 4: Oracle results on the NLI 2013 and 2017 shared task systems. The ensemble includes each team’s best system in each track. Results are reported as the macro-averaged F1-score.
5.2 Ensemble Analysis
One interesting research question is to measure the upper-bound on accuracy for this year’s task. This can be measured by treating each team’s best sub-mission as an independent system, and combining the results using ensemble methods such as a plu-rality vote or an oracle. This type of analysis has previously been applied to the NLI 2013 task and shown to be helpful in other work (Malmasi et al.,
2015). Following the approach ofMalmasi et al.
(2015), we apply the following combination meth-ods to the 2017 data.
Plurality Voting: This is the standard combina-tion strategy that selects the label with the highest number of votes, regardless of the overall percent-age of votes it received (Polikar,2006). This dif-fers from amajority vote combiner where a label must obtain over50%of the votes.
Oracle: An oracle is a type of fusion method that assigns the correct class label for an instance if
anyof the classifiers in the ensemble produces the correct label for that data point. This method has previously been used to analyze the limits of ma-jority vote classifier combination (Kuncheva et al.,
2001). It can help quantify the potential upper limit of an ensemble’s performance on the given data and how this performance varies with differ-ent ensemble configurations and combinations. Accuracy@N: To account for the possibility that a classifier may randomly predict the correct la-bel (with a probability determined by the random baseline) and thus exaggerate the oracle score, an Accuracy@N combiner has been proposed ( Mal-masi et al.,2015). This method is inspired by the “Precision atk” metric from Information Retrieval (Manning et al.,2008) which measures precision at fixed low levels of results (e.g. the top10
re-sults). Here, it is an extension of the Plurality vote combiner where instead of selecting the label with the highest votes, the labels are ranked by their vote counts and a sample is correctly classified if the true label is in the topN ranked candidates.4 Another way to view it is as a more restricted ver-sion of the Oracle combiner that is limited to the topN ranked candidates in order to minimize the influence of a single classifier having chosen the correct label by chance. In this study we experi-ment withN = 2and3. We also note that setting
N = 1is the same as the Plurality voting method. We applied the above combiners to all three tracks in the NLI 2017 task. The results are pre-sented in Table4. The results for each track are compared against the best system in the shared task. The equivalent results from the NLI 2013 shared task are also included for comparison.
We note that the 2017 oracle performance is similar to that of 2013, despite having fewer sys-tems. The Accuracy@2 results are also substan-tially higher. Another difference in 2017 is that the voting ensemble did not outperform the single best system in any track, which was the case in 2013. Taken together, these trends seem to suggest that the 2017 entries were more accurate, rather than the test set being easier to classify (in which case we would have expected higher oracle results).
Results from the Accuracy@2 combiner show that a great majority of the texts are close to be-ing correctly classified: this value is significantly higher than the plurality combiner and not much lower than the oracle itself. This shows that the correct label receives a significant portion of the votes, and when not the winning label, it is often the runner-up.
0.880 0.890 0.900 0.910 0.920 0.930 0.940 0.950 0.960 0.970
Oracle
Voting Ensemble
0 2 4 6 8 10 12 14 16 18
Number of Systems in Ensemble
0.880 0.885 0.890
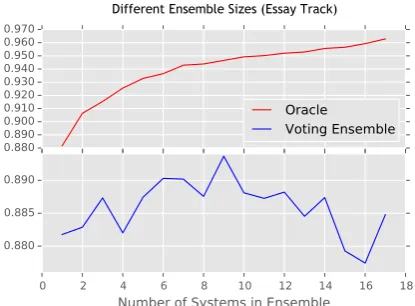
[image:11.595.76.284.61.214.2]Different Ensemble Sizes (Essay Track)
Figure 2: Results (macro-F1) for ensembles of dif-ferent sizes using each team’s best system in the Essay track. Systems are added according to their absolute rank. Oracle combination (top) and plu-rality voting (bottom) are shown.
0.930 0.940 0.950 0.960 0.970 0.980 0.990
Oracle
Voting Ensemble
1 2 3 4 5 6 7 8 9 10
Number of Systems in Ensemble
0.926 0.927 0.928 0.929 0.930 0.931 0.932 0.933
[image:11.595.77.285.298.451.2]Different Ensemble Sizes (Fusion Track)
Figure 3: Results (macro-F1) for creating ensem-bles of different sizes using each team’s best sub-mission in the Fusion track. Systems are added according to their absolute rank. Oracle combina-tion (top) and plurality voting (bottom) are shown.
0.820 0.840 0.860 0.880 0.900 0.920 0.940 0.960 0.980
Oracle
Voting Ensemble
0 5 10 15 20 25 30
Number of Systems in Ensemble
0.835 0.840 0.845 0.850 0.855
Different Ensemble Sizes (NLI 2013 Test Set)
Figure 4: Results (macro-F1) for ensembles of different sizes using each team’s best system in the NLI Shared Task 2013 (test set). Systems are added in order of their rank. Oracle combination (top) and plurality voting (bottom) are shown.
It is also evident that the results for the fusion track are much higher, again highlighting the util-ity of combining multiple modalities for NLI.
In addition to using each team’s best system, We also experimented with creating ensembles of dif-ferent sizes. For each track we createdN ensem-blesE1. . . EN, withN being the number of
sys-tems in that track. Each ensembleEncontains the
topn systems in the given track, so that the first ensemble contains only the top system, the second contains the top two systems, and so on, with the final ensemble containing every team’s system.
This analysis enables us to assess the ensemble performance as more predictions are added. The results for the Oracle and Plurality Vote ensem-bles in the essay and fusion tracks are shown in Figure2and Figure3. For comparison we also in-clude the ensemble combinations generated from the 2013 test set, as shown in Figure4.
For both tracks we observe that oracle accuracy increases as more systems are added, which is to be expected. For voting combination, performance increases as the top systems are added, but then begins to drop off as errors are introduced from the less accurate systems. This suggests that it might be possible to develop a system that per-forms slightly better than the top-ranked system.
On balance, the analysis presented in this sec-tion suggests that it will be challenging to de-velop NLI systems that attain statistically signif-icant gains on this data.
6 Conclusion and Future Work
We presented the results of the NLI Shared Task 2017. This edition of the task introduced the use of transcriptions and i-vector features for speech-based NLI, as well the as the fusion task which jointly uses the spoken and written responses.
[image:11.595.78.285.542.695.2]new insights for this task, and serve as a building block for future work. The results obtained here will also provide an important benchmark for as-sessing future results.
There are a number of avenues for future NLI research. Although we were not able to include the raw audio data in this task, its inclusion in the speech and fusion tasks could be an interesting ad-dition. The expansion of the L1 classes to include a larger number of linguistically diverse languages can also be insightful. Most NLI research to date has been limited to approximately a dozen lan-guages, so it is not clear how these systems will fare as the number of classes increases.
The relatively low performance of transcription-based features also merits further investigation. A first step would be to assess whether the primary issue is related to the shorter lengths of the texts. This hypothesis can be tested by obtaining tran-scripts of longer spoken responses, or even arti-ficially creating longer texts by concatenating the existing data.
Finally, the essay-based NLI results obtained on English L2 data have been replicated on a range of other languages (Malmasi and Dras,2015). It would be interesting to see to what degree the speech-based NLI methodologies would work on other languages. The paucity of spoken responses from learners of languages other than English makes this a challenging research question.
References
Alberto Abad, Eug´enio Ribeiro, F´abio Kepler, Ramon Astudillo, and Isabel Trancoso. 2011. Exploiting phone log-likelihood ratio features for the detection of the native language of non-native english speak-ers. InProceedings of Interspeech. San Francisco, USA, pages 2413–2417.
Johannes Bjerva, Gintar˙e Grigonyt˙e, Robert ¨Ostling, and Barbara Plank. 2017. Neural Networks and Spelling Features for Native Language Identifica-tion. InProceedings of the 12th Workshop on Build-ing Educational Applications UsBuild-ing NLP. Associ-ation for ComputAssoci-ational Linguistics, Copenhagen, Denmark.
Daniel Blanchard, Joel Tetreault, Derrick Hig-gins, Aoife Cahill, and Martin Chodorow. 2013. TOEFL11: A Corpus of Non-Native English. Tech-nical report, Educational Testing Service.
Serhiy Bykh and Detmar Meurers. 2014. Exploring Syntactic Features for Native Language Identifica-tion: A Variationist Perspective on Feature Encod-ing and Ensemble Optimization. In Proceedings of COLING 2014, the 25th International Confer-ence on Computational Linguistics: Technical Pa-pers. Dublin, Ireland, pages 1962–1973.
Sophia Chan, Maryam Honari Jahromi, Benjamin Benetti, Aazim Lakhani, and Alona Fyshe. 2017. Ensemble Methods for Native Language Identifica-tion. InProceedings of the 12th Workshop on Build-ing Educational Applications UsBuild-ing NLP. Associ-ation for ComputAssoci-ational Linguistics, Copenhagen, Denmark.
Andrea Cimino and Felice Dell’Orletta. 2017. Stacked Sentence-Document Classifier Approach for Im-proving Native Language Identification. In Pro-ceedings of the 12th Workshop on Building Edu-cational Applications Using NLP. Association for Computational Linguistics, Copenhagen, Denmark.
Najim Dehak, Pedro A Torres-Carrasquillo, Douglas Reynolds, and Reda Dehak. 2011. Language recog-nition via i-vectors and dimensionality reduction. In Twelfth Annual Conference of the International Speech Communication Association.
Dominique Estival, Tanja Gaustad, Son Bao Pham, Will Radford, and Ben Hutchinson. 2007. Author profiling for English emails. InProceedings of the 10th Conference of the Pacific Association for Com-putational Linguistics. Melbourne, Australia, pages 263–272.
Asmaa Etman and A. A. Louis Beex. 2015. Language and Dialect Identification: A survey. InSAI Intelli-gent Systems Conference. London, UK, pages 220– 231.
J. Gibbons. 2003. Forensic Linguistics: An Introduc-tion to Language in the Justice System..
Cyril Goutte and Serge L´eger. 2017. Exploring Op-timal Voting in Native Language Identification. In Proceedings of the 12th Workshop on Building Ed-ucational Applications Using NLP. Association for Computational Linguistics, Copenhagen, Denmark.
Radu Tudor Ionescu and Marius Popescu. 2017. Can string kernels pass the test of time in Native Lan-guage Identification? In Proceedings of the 12th Workshop on Building Educational Applications Us-ing NLP. Association for Computational Linguis-tics, Copenhagen, Denmark.
Pavel Ircing, Jan ˇSvec, Zbynˇek Zaj´ıc, Barbora Hladk´a, and Martin Holub. 2017. Combining Textual and Speech Features in the NLI Task Using State-of-the-Art Machine Learning Techniques. In Proceed-ings of the 12th Workshop on Building Educational Applications Using NLP. Association for Computa-tional Linguistics, Copenhagen, Denmark.
Scott Jarvis, Yves Bestgen, and Steve Pepper. 2013. Maximizing Classification Accuracy in Native Lan-guage Identification. InProceedings of the Eighth Workshop on Innovative Use of NLP for Building Educational Applications. Association for Compu-tational Linguistics, Atlanta, Georgia, pages 111– 118.
Fabio N. Kepler, Ramon F. Astudillo, and Alberto Abad. 2017. Fusion of Simple Models for Native Language Identification. InProceedings of the 12th Workshop on Building Educational Applications Us-ing NLP. Association for Computational Linguis-tics, Copenhagen, Denmark.
Moshe Koppel, Jonathan Schler, and Kfir Zigdon. 2005. Automatically determining an anonymous au-thor’s native language. Intelligence and Security In-formaticspages 41–76.
Artur Kulmizev, Bo Blankers, Johannes Bjerva, Malv-ina Nissim, Gertjan van Noord, Barbara Plank, and Martijn Wieling. 2017. The Power of Character N-grams in Native Language Identification. In Pro-ceedings of the 12th Workshop on Building Edu-cational Applications Using NLP. Association for Computational Linguistics, Copenhagen, Denmark. Ludmila I Kuncheva, James C Bezdek, and Robert PW
Duin. 2001. Decision templates for multiple clas-sifier fusion: an experimental comparison. Pattern Recognition34(2):299–314.
Wen Li and Liang Zou. 2017. Classifier Stacking for Native Language Identification. InProceedings of the 12th Workshop on Building Educational Appli-cations Using NLP. Association for Computational Linguistics, Copenhagen, Denmark.
Shervin Malmasi. 2016. Native Language Identifica-tion: Explorations and Applications. Ph.D. thesis. http://hdl.handle.net/1959.14/1110919.
Shervin Malmasi and Aoife Cahill. 2015. Measur-ing Feature Diversity in Native Language Iden-tification. In Proceedings of the Tenth Work-shop on Innovative Use of NLP for Building Ed-ucational Applications. Association for Computa-tional Linguistics, Denver, Colorado, pages 49–55. http://aclweb.org/anthology/W15-0606.
Shervin Malmasi and Mark Dras. 2014. Lan-guage Transfer Hypotheses with Linear SVM Weights. In Proceedings of the 2014 Confer-ence on Empirical Methods in Natural Language Processing (EMNLP). Association for Computa-tional Linguistics, Doha, Qatar, pages 1385–1390. http://aclweb.org/anthology/D14-1144.
Shervin Malmasi and Mark Dras. 2015. Multilingual Native Language Identification. In Natural Lan-guage Engineering.
Shervin Malmasi and Mark Dras. 2017. Native Lan-guage Identification using Stacked Generalization. arXiv preprint arXiv:1703.06541.
Shervin Malmasi, Mark Dras, Mark Johnson, Lan Du, and Magdalena Wolska. 2017. Unsupervised Text Segmentation Based on Native Language Character-istics. InProceedings of the 55th Annual Meeting of the Association for Computational Linguistics (ACL 2017). Vancouver, Canada.
Shervin Malmasi, Joel Tetreault, and Mark Dras. 2015. Oracle and Human Baselines for Native Language Identification. In Proceedings of the 10th BEA workshop. pages 172–178.
Shervin Malmasi, Marcos Zampieri, Nikola Ljubeˇsi´c, Preslav Nakov, Ahmed Ali, and J¨org Tiedemann. 2016. Discriminating between Similar Languages and Arabic Dialect Identification: A Report on the Third DSL Shared Task. InProceedings of the Var-Dial Workshop. Osaka, Japan.
Christopher D Manning. 2015. Computational linguis-tics and deep learning. Computational Linguistics 41(4):701–707.
Christopher D Manning, Prabhakar Raghavan, and Hinrich Sch¨utze. 2008. Evaluation in information retrieval. In Introduction to Information Retrieval, Cambridge university press Cambridge, pages 151– 175.
Ilia Markov, Lingzhen Chen, Carlo Strapparava, and Grigori Sidorov. 2017. CIC-FBK Approach to Na-tive Language Identification. In Proceedings of the 12th Workshop on Building Educational Appli-cations Using NLP. Association for Computational Linguistics, Copenhagen, Denmark.
David Martınez, Oldrich Plchot, Luk´as Burget, On-drej Glembek, and Pavel Matejka. 2011. Language recognition in ivectors space. InProceedings of In-terspeech. Firenze, Italy, pages 861–864.
Elham Mohammadi, Hadi Veisi, and Hessam Amini. 2017. Native Language Identification Using a Mix-ture of Character and Word N-grams. In Proceed-ings of the 12th Workshop on Building Educational Applications Using NLP. Association for Computa-tional Linguistics, Copenhagen, Denmark.
Robi Polikar. 2006. Ensemble based systems in deci-sion making. Circuits and systems magazine, IEEE 6(3):21–45.
Taraka Rama and C¸a˘grı C¸¨oltekin. 2017. Fewer features perform well at Native Language Identification task. In Proceedings of the 12th Workshop on Building Educational Applications Using NLP. Association for Computational Linguistics, Copenhagen, Den-mark.
K. Sreenivasa Rao and Dipanjan Nandi. 2015. Lan-guage identificationa brief review. In Wim Kouwen-hoven, editor,Language Identification Using Excita-tion Source Features, Springe, chapter 2, pages 11– 30.
Alla Rozovskaya and Dan Roth. 2011. Algorithm se-lection and model adaptation for esl correction tasks. In Proceedings of the 49th Annual Meeting of the Association for Computational Linguistics: Human Language Technologies. Association for Computa-tional Linguistics, Portland, Oregon, USA, pages 924–933. http://www.aclweb.org/anthology/P11-1093.
Yunita Sari, Muhammad Rifqi Fatchurrahman, and Meisyarah Dwiastuti. 2017. A Shallow Neural Net-work for Native Language Identification with Char-acter N-grams. InProceedings of the 12th Workshop on Building Educational Applications Using NLP. Association for Computational Linguistics, Copen-hagen, Denmark.
Bj¨orn Schuller, Stefan Steidl, Anton Batliner, Ju-lia Hirschberg, Judee K. Burgoon, Alice Baird, Aaron Elkins, Yue Zhang, Eduardo Coutinho, and Keelan Evanini. 2016. The INTER-SPEECH 2016 Computational Paralinguistics Challenge: Deception, Sincerity & Native Lan-guage. In Interspeech 2016. pages 2001–2005. https://doi.org/10.21437/Interspeech.2016-129.
Charese Smiley and Sandra K¨ubler. 2017. Native Lan-guage Identification using Phonetic Algorithms. In Proceedings of the 12th Workshop on Building Ed-ucational Applications Using NLP. Association for Computational Linguistics, Copenhagen, Denmark.
Joel Tetreault, Daniel Blanchard, and Aoife Cahill. 2013. A report on the first native language identi-fication shared task. InProceedings of the Eighth Workshop on Innovative Use of NLP for Building Educational Applications. Association for Compu-tational Linguistics, Atlanta, GA, USA.
Joel Tetreault, Daniel Blanchard, Aoife Cahill, and Martin Chodorow. 2012. Native tongues, lost and found: Resources and empirical evaluations in native language identification. In Proceedings of COLING 2012. The COLING 2012 Organiz-ing Committee, Mumbai, India, pages 2585–2602. http://www.aclweb.org/anthology/C12-1158.
Laura Mayfield Tomokiyo and Rosie Jones. 2001. You’re not from ’Round here, are you?: Naive Bayes detection of Non-native utterance text. In Proceed-ings of the second meeting of the North American Chapter of the ACL (NAACL). Association for Com-putational Linguistics, Pittsburgh, PA.
Oren Tsur and Ari Rappoport. 2007. Using Clas-sifier Features for Studying the Effect of Native Language on the Choice of Written Second Lan-guage Words. In Proceedings of the Workshop on Cognitive Aspects of Computational Language Acquisition. Association for Computational Lin-guistics, Prague, Czech Republic, pages 9–16. http://www.aclweb.org/anthology/W/W07/W07-0602.
Sowmya Vajjala and Sagnik Banerjee. 2017. A study of N-gram and Embedding Representations for Na-tive Language Identification. In Proceedings of the 12th Workshop on Building Educational Appli-cations Using NLP. Association for Computational Linguistics, Copenhagen, Denmark.
Sze-Meng Jojo Wong and Mark Dras. 2009. Contrastive Analysis and Native Language Identification. In Proceedings of the Aus-tralasian Language Technology Association Workshop 2009. Sydney, Australia, pages 53–61. http://www.aclweb.org/anthology/U09-1008. Yiming Yang and Xin Liu. 1999. A re-examination
of text categorization methods. In Proceedings of the 22nd annual international ACM SIGIR confer-ence on Research and development in information retrieval. ACM, pages 42–49.
Marcos Zampieri, Alina Maria Ciobanu, and Liviu P. Dinu. 2017a. Native Language Identification on Text and Speech. InProceedings of the 12th Work-shop on Building Educational Applications Using NLP. Association for Computational Linguistics, Copenhagen, Denmark.
Marcos Zampieri, Shervin Malmasi, Nikola Ljubeˇsi´c, Preslav Nakov, Ahmed Ali, J¨org Tiedemann, Yves Scherrer, and No¨emi Aepli. 2017b. Findings of the VarDial Evaluation Campaign 2017. InProceedings of the Fourth Workshop on NLP for Similar Lan-guages, Varieties and Dialects (VarDial). Valencia, Spain, pages 1–15.