University of Warwick institutional repository:
http://go.warwick.ac.uk/wrap
This paper is made available online in accordance with
publisher policies. Please scroll down to view the document
itself. Please refer to the repository record for this item and our
policy information available from the repository home page for
further information.
To see the final version of this paper please visit the publisher’s website.
Access to the published version may require a subscription.
Author(s): Hazra, Sumit, Williams, David, Roy, Rajat, Aylmore, R. and
Smith, A.
Article Title: Effect of material and process variability on the
formability of aluminium alloys
Year of publication: 2011
Link to published article:
http://dx.doi.org/10.1016/j.jmatprotec.2011.04.001
Publisher statement:
NOTICE: this is the author’s version of a work that
was accepted for publication in Journal of Materials Processing
Technology. Changes resulting from the publishing process, peer-
review, editing, corrections, structural formatting, and other quality
control mechanisms may not be reflected in this document. Changes
may have been made to this work since it was submitted for
Effect of Material and Process Variability on the Formability of
Aluminium Alloys
S. Hazraa,*, D. Williamsa, R. Roya, R. Aylmoreb and A. Smithc
a
Warwick Manufacturing Group, University of Warwick, Gibbett Hill Road, Coventry CV8 2PS UK b
Land Rover, Banbury Rd, Gaydon, Warwick, CV35 0RR, UK c
Jaguar Cars Limited, Abbey Road, Whitley, Coventry, CV3 4LF, UK
*
Corresponding author.
E-mail address: [email protected] Telephone: +44(0)2476575409
Abstract
Automotive parts are increasingly being manufactured to be lighter and stronger to minimise
the environmental impact and to improve the crash performance of automobiles. The
materials that are being used to achieve these aims tend to have lower formabilities compared
to the traditionally used mild steel. This is particularly true for cold forming operations. As a
consequence of the smaller forming window that is available, there is a greater need to
understand the safety margins that are applied when manufacturing parts made from these
materials. These safety margins are determined by estimations of the impact of material and
process variabilities on formability as well as the attitude that is adopted towards risk. This
study looked at the impact of material and process variabilities on the cold formability of two
aluminium grades: AA6111-T4 and AA5754-O. The forming factors studied included
changes to overall material properties, tool surface roughness, quantity of lubricant, tooling
temperature and gauge. Because of the complexity of the forming process, the problem was
reduced to a study of formability under plane strain stretch conditions. Particular emphasis
was placed in quantifying the temperature of tooling during cold forming and understanding
its effect on formability. It was found that the safety factor applied to AA5754-O can be
lower than that used for AA6111-T4.
1 1. Introduction
Sheet metal forming is a cold forming process where material deformation and tool-material
interactions take place under changing conditions that may arise, for example, through
increasing tooling temperature. Although the process is complex, formability of parts may be
predicted using finite element models that account for tool geometry, blank material
properties and friction conditions. The parameters used to describe these models are usually
specified deterministically so that a perfectly repeatable process is assumed. In reality, the
parameters of the stamping process vary. For example, Blumel et al. (1988) measured the
mechanical properties of every 400th blank during serial production and showed that the
variability in properties, which was quantified in terms of standard deviation, depended on
the grade of steel used. To ensure a robust process, such variability is accounted for within
safety margins that may be applied to the forming limit curve. Components, however, are
increasingly being manufactured using higher strength and lighter materials that are relatively
less formable. At the same time, cost pressures mean that parts have increasingly complex
geometries to serve multiple purposes to reduce part count. In this context, parts that are
overly ‘safe’ can limit these competing requirements. Consequently, there is a need to better
understand the impact of variability in the stamping process so that an appropriate level of
safety margins may be used in the design of parts.
This investigation looked into the effect of the variability of material and process
parameters on formability, particularly that of tooling temperature. The materials studied
were two aluminium grades, AA5754-O and AA6111-T4, which are used in automotive
applications. The objective of this study was to understand the sensitivity of the two grades
with respect to changes to parameters that influence their formability and to infer the relative
safety margins that may be used in the design of parts using these materials. The magnitude
2 the material and process parameters that were identified as having the most influence on the
formability of AA6111-T4 and AA5754-O, tooling temperature during the cold forming
process has been studied the least. An initial investigation was therefore carried out to
determine the extent of the temperature rise that occurs in typical aluminium parts during
serial production. The effect of the variability of the identified parameters was then tested in
plane strain using the Limiting Dome Height (LDH) test. The test programme was carried out
according to a design of experiments method so that the variability in the measured data
could be quantified statistically. The relative safety factor for the two grades was then
inferred from the statistical analysis.
2. Variability in the forming process
Col (2003) summarises a comprehensive list of parameters that influence formability, which
were divided into the categories of ‘material’, ‘process’, ‘tooling’ and ‘unpredictable causes’.
Variability in the output may be minimised by ensuring that these parameters are kept the
same between pressings and batches. However, this is difficult to enforce due to the inherent
variability to the inputs of the process, such as gauge of the received material, as shown by
Blumel et al. (1988) for several batches of material, or an increase to the temperature of the
tooling as production progresses. Excessive variability can affect a part’s formability (Wang
and Hancock, 1997) or dimensional stability (Zhou and Cao, 1994).
There is clearly a need to control variability to sensitive processes but this depends on
how the performance of the processes is assessed. Wang and Hancock (1997) and Zhou and
Cao (1994) looked at the industrial manufacture of door inner panels and came to different
conclusions as to what should be controlled. Wang and Hancock (1997) concluded that to
prevent splitting in their process, blankholder load, quantity of lubricant that is applied to the
blanks and the surface roughness of the steel blanks were parameters that had to be
3 important in ensuring dimensional stability. In calculations of springback, de Souza and Rolfe
(2008) found that, for their simple geometry, material properties such as yield strength and
the strain hardening index (n-value) are important in controlling dimensional stability. The
results of the above studies were based on the Design of Experiment (DoE) method.
Ayres et al. (1979) examined the occurrences of stretch failure in a press shop for five
parts over a period of two years. In parts where failure occurred, the strain path was generally
found to be in plane strain and correlated well to LDH tests that were carried out on the
received batches of material. This was due to two reasons. Firstly, the LDH test is designed to
replicate the plane strain path and secondly, it was sensitive to the variability in the
mechanical properties of the materials that were used. The study illustrated the importance of
the plane strain path and the effect of material variability in this strain path.
Thompson (1993) proposed an LDH test standard and felt that the ‘consensus among
stamping engineers is that approximately 85% of all fractures in automotive panels occur in
plane strain’. The plane strain path is an important one because limit strains are a minimum
along this path and this causes parts to be susceptible to failure through variability. Several
material properties influence this limit but calculations based on load instability analysis
(Hosford and Caddell, 1990) and the Marciniak-Kucynski failure model (Graf and Hosford,
1990) show that in plane strain, the hardening behaviour of a material, whether it is strain or
strain-rate hardening, is particularly important. Variability of these properties can therefore
affect the formability of the part.
Material parameters are not alone in influencing formability. A blank is shaped through
contact with a set of tooling and its formability is also affected by friction that is generated
through the contact. Friction is usually beneficial in blankholders, where it controls the rate of
flow of material into a die, but it can be detrimental if it leads to strain concentrations
4 to variable formability. However, materials with high n-values can counteract this tendency
to form strain concentrations by spreading the concentration over a wider volume and
reducing variability.
Haar (1996) and Schey (1983) summarised the factors that influence the frictional forces
in the contact region and the level of the friction coefficient, μ. These include the pressure
within the contact, the quantity of lubricant used, the type of lubricant, the surface roughness
that acts to preserve the lubricant within the contact region and the local temperature. The
friction mechanism is regarded as complex because of the number of factors that affect it and
their interactions (Haar, 1996). As a result, its effect on formability is generally better
understood in simple shapes such as the LDH test, where a hemispherical punch is used to
deform material in plane strain. Fischer and Schey (1992) described how an effective
lubricant and suitable punch surface roughness are able to increase formability by allowing a
greater volume of material to deform in LDH tests. The effect is similar to that of a material
possessing a high n-value. Ayres (1983) found that changing the frictional contact condition
can also change the strain path of the test, which may affect the material’s formability.
2.1 Choice of parameters
The objective of this study was to understand the effect of variability on the press
formability of AA6111-T4 and AA5754-O. Recognising the complexity of the press forming
process, the problem was simplified to a study of the plane strain path, which accounts for the
majority of failures in industry. To quantify the effect of variability, a series of LDH tests
were conducted according to the DoE method that allowed a statistical analysis of the data
and hence a discussion of the relative safety margins to be used for the two grades of
material. Various aspects of the test method have been widely studied and its response to
material properties and process parameters have been analysed and quantified. Ghosh (1975)
5 suggestion that the material should be clamped to prevent draw-in made the test repeatable
and robust. Ayres et al. (1979) used the LDH test in an industrial environment and found that
LDH results correlated well to press formability in an industrial environment. Graf and
Izworski (1993) and Izworski and Graf (1991) built on this work and discussed aspects of the
test that were important to control in order to ensure ‘stability’ in an industrial environment.
They investigated the effects of temperature, tool cleanliness, lubrication and material
properties on industrial LDH results. As a result of these investigations, the LDH test is
regarded as a robust and repeatable test for the plane strain path.
Of the parameters that were chosen for this study, particular emphasis was placed on the
effect of temperature because the temperature rise during serial production and its effect on
formability is not well understood. Temperature increases during forming because plastic and
frictional work is dissipated as heat. Newby (1981) estimated the temperature rise when
pressing low carbon steels can be as high as 200°C but Blumel et al. (1988) measured only a
2°C temperature rise during the serial production of a steel part using a thermocouple
embedded within their tooling. Blumel et al. (1988) concluded that such a small rise could be
ignored but the obvious criticism of measuring temperature with a thermocouple is that it
records local temperatures, which may not be representative of the temperature in other areas
of the tool. Graf and Izworski (1993) studied the effect of temperature on the LDH test and
found that if the punch temperature varied from 40°C and 75°C, LDH measurements varied
by up to 10% in their experiments. Izworski and Graf (1991) found a similar response and
showed that the fracture point in their samples shifted towards the pole or the highest point of
the sample. Graf and Izworski (1993) and Izworski and Graf (1991) speculated that
temperature impacts formability by altering the viscosity of the lubricant and material
6 Groche et al. (2008) attempted to explain the temperature rise in a strip draw test that
involved a strip being pulled, under tension, through a set of tooling and around a 90° bend.
They created a model that consisted of the relevant forces acting on the strip as well as the
heat generation and conduction mechanisms thought to act between the strip and tooling.
Heat was assumed to be generated through frictional contact with tooling and through plastic
deformation during the bending-unbending sequence as it flowed around the 90° bend. Using
their two dimensional model, the authors showed that the location of greatest tool wear
corresponded to a local temperature peak. They speculated that increased tool temperature
accentuates wear. Pereira et al. (2010) modelled a channel forming tool using a finite element
model to calculate the potential temperature rise in the tool when forming parts out of
advanced high strength steels and its effects. They found that for some grades, tool
temperature can rise to around 130°C and this tended to coincide with areas of high contact
pressure and wear between the blank and the die. The generated heat was found to quickly
conduct into the bulk of the tool material when contact was relieved.
The studies of Groche et al. (2008) and Pereira et al. (2010) illustrate particularly the
influence of geometry and contact pressure on tooling temperature during a single operation.
However, during serial production, repeated processing of material by the tooling will result
in a periodic input of heat into the tools. To our knowledge, it is not known how this
successive addition of heat affects the temperature of the tooling and its formability and wear.
The other parameters that were investigated in this study were on the basis that they
significantly influenced the forming process, they were of interest to industry and that it was
possible to vary them in a controlled manner so that their effect could be measured. These
were overall material properties, punch surface roughness, quantity of lubricant and gauge.
The effect of overall material properties was tested rather than individual properties because
7 properties. Material properties were changed using simple heat treatment schemes that
mimicked the potential variabilities in the rolling process that is used to manufacture the
sheet material. The effect of punch surface roughness was investigated because the surface
condition of industrial tooling may be specified and can change over time through wear.
Likewise, the quantity of lubricant was investigated because it can be controlled within a
press-shop. Finally, gauge was investigated because of its effect on forming limits (Hosford
and Caddell, 1997).
3.1 Materials tested
The investigation was carried out for two automotive grade aluminium alloys: AA6111-T4
and AA5754-O. AA6111-T4 is a solution heat treated grade that was tested with the MP404
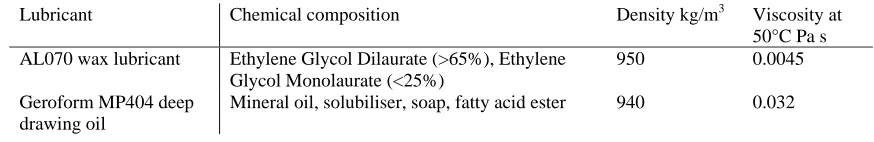
mineral oil lubricant, while AA5754-O was tested with the ALO70 wax lubricant. The
chemical composition of the grades and the lubricants are given in the table below.
Grade Si Fe Cu Mn Mg Cr Zn Ti
AA5754-O Max 0.4 Max 0.4 Max 0.1 Max 0.5 2.6-3.6 Max 0.3 Max 0.2 Max 0.15 AA6111-T4 0.6-1.1 Max 0.4 0.5-0.9 0.1-0.45 0.5-1.0 Max 0.1 Max 0.15 Max 0.1
Table 1 Chemical composition (% weight) of the alloying components of the grades tested
Lubricant Chemical composition Density kg/m3 Viscosity at 50°C Pa s AL070 wax lubricant Ethylene Glycol Dilaurate (>65%), Ethylene
Glycol Monolaurate (<25%)
950 0.0045
Geroform MP404 deep drawing oil
[image:10.612.84.521.475.546.2]Mineral oil, solubiliser, soap, fatty acid ester 940 0.032
Table 2 Chemical composition of the lubricants used in the tests
The shear viscosity of AL070 and MP404 was measured with a cone and plate apparatus and
the nature of this test is described by Barnes (2000). The apparatus was mounted on a
Kinexus Ultra rheometer and the lubricants were tested over a range of temperatures. The
viscosity of AL070 could not be tested below 40°C as it gradually solidifies from 47°C to
8 (Fig.1). The first is that, at 50°C, AL070 has a viscosity that is an order of magnitude lower
than that of MP404 and the second is that the viscosity of MP404 increases from 0.032 Pa s
to 0.21Pa s as temperature is reduced from 50°C to 20°C.
Fig.1 Variation of shear viscosity with temperature for MP404 and AL070
3.2 Measuring formability with the Limiting Dome Height Test
Formability was measured using the LDH test and a schematic diagram of the test
arrangement is shown in Fig.2. Three tools make up the apparatus: a punch, die and
blankholder. The blankholder incorporates locking beads to prevent material draw-in so that
deformation occurs solely in stretch. The punch is 100mm in diameter and the limiting dome
height was taken as the point where the load peaked. To ensure that the samples deformed in
plane strain, sample widths were varied until measured strains indicated plane strain
9 Fig.2 Schematic diagram of the LDH apparatus
In the experiments carried out in this study, the die and blankholder were placed on the base
of an Instron 5800 tensile tester (Fig.3) while the punch was attached to the end of a loadcell
which was securely attached to the Instron’s crosshead. The loadcell capacity was 100kN
(manufacturer’s stated measurement error ±0.128kN), which was sufficiently high to test the
two grades to failure. The crosshead was screw-driven and its displacement, velocity and
termination were controlled using Instron’s Bluehill software. Test samples were
mechanically clamped between the blankholders with six bolts that were tightened using a
torque wrench to ensure sufficient and even distribution of force around the blankholder.
Fig.3 Experimental setup showing LDH tooling installed on an Instron
Blankholder Punch
Die
10 Load-displacement plots were recorded on a PC during the tests and final strains in the
sample were measured with the circle grid analysis method. Prior to the tests, the samples
were marked with a fine pattern of uniformly-spaced dots using an electrochemical etch
method. Strains were estimated by measuring the displacement of the dots after the test using
the GOM Argus photogrammetry system, which provided a full field view of strains in the
samples. The total error of the measurement was estimated from the analysis of 17 samples in
the unstrained state. This was found to be ±0.017 true strain.
3.3 Measuring the Temperature of Pressed Parts
To ascertain the extent of temperature rise during serial production, an industrial trial was
carried out along an automotive stamping line, which was based in Birmingham, United
Kingdom, and equipped with a 2000 ton hydraulic draw press. The trial consisted of
measuring the temperature of three part geometries just after the drawing phase.
Measurements were carried out using an infrared camera because it is a non-contact
technique that provides a full-field view of part temperature (Beattie, 1971). Thus, the
measurements did not interfere with production.
Barber (1978) pointed out that a disadvantage of the method is that it is susceptible to
stray, reflected radiation. In general, an infrared camera measures the radiation from three
sources: the emission from the object of interest, reflected emissions from surrounding
sources and emissions from the atmosphere (Nelkon and Parker, 1982). Reflected emission is
radiation from surrounding sources that reflect off the object and emissions from the
atmosphere is radiation that is dissipated as a result of ambient temperature. These two
effects were minimised to measure part temperature accurately.
Atmospheric radiation was relatively simple to account for within the camera that was
11 because of the numerous sources of radiation in the environment such as strong lighting and
motors that operate the press and feed robots. The problem is compounded by the low
emissivity of metals, which accentuates the effect of reflected emissions and results in
overestimated temperature readings. For this reason, the temperature of the draw tooling
could not be measured reliably because its polished surface was highly reflective and it was
in close proximity to lighting and motors. Instead, temperature measurements were taken of
the underside of parts immediately after the draw process.
Through a process of trial and error, it was found that the underside of the parts was well
shielded from reflected emissions (Fig.4). At the point when the measurements were taken,
the parts were held suspended about 500mm above a 300mm thick floor, which was in
thermal equilibrium with the surrounding air (18°C). To estimate the temperature of the
tooling, it was assumed that negligible heat was lost from the time the part was removed from
the tooling to the time at which the measurement was taken. Parts were removed from the
tooling using a transfer robot and the time delay from the opening of the tooling to the point
when the temperature of the part was recorded was a few seconds. For this reason, it was
assumed that the measured temperatures reflected the state of the tooling.
The measurements were carried out with FLIR’s ThermaCAM SC3000, which was
equipped with a gallium arsenide detector. The detector was designed to detect radiation
within the narrow wavelength range of 8-9µm, which maximised the signal-to-noise ratio of
the detector between 20°C and 100°C (measurement uncertainty = ±1%). The following
considerations were made to ensure measurement accuracy:
1. The ‘emissivity’ of the two grades of material was determined separately
2. The radiation lost through absorption by atmospheric water vapour and the radiation
emitted by the temperature of the surrounding atmosphere was accounted for within
12 3. Radiation interference from surrounding sources, such as motors and lighting were
minimised as far as possible.
The emissivity of the two grades were determined prior to the press shop measurements
according to the manufacturer’s instructions, (FLIR, 2003). As expected, the emissivities
were low because of their reflective surfaces and were found to vary little between 30°C to
80°C.
Fig.4 Camera position during the measurement of part temperature. The process flow is into the page.
The temperatures of three parts were measured. Parts A and B were front and rear fender
outer panels made from 0.9mm gauge AA6111-T4 (Figs 5 and 6) and Part C was a structural
floor cross-member made from 1.5mm gauge AA5754-O (Fig. 7). MP404 lubricant was used
for Parts A and B while AL070 lubricant was used for Part C. Approximately 240 stampings
were carried out per hour. The draw depths were about 215mm for Part A, 180mm for Part B
and 100mm for Part C. Temperatures were measured on the wall of the drawn shell where the
strain was expected to be in plane strain. The intention was to start measuring when the tools
were cold and to monitor the parts through a production run. However, the uncertainty of Hydraulic Press
Lighting
Part
Floor Camera
Start of response to Reviewer #1
13 production scheduling meant that most measurements commenced mid-run. This had two
effects. The first was that the quantity of data varied. The measurements for Part B were
taken over a relatively shorter time compared to Parts A and C. The second was that it was
not possible to measure the temperature profile of the tools as they warmed up at the start of
production. However, the measurements of part A (Fig.5) commenced following a change of
shift and the temperature of the first part was observed to be higher than 45°C. No evidence
was found of a transient temperature response after production re-started.
The temperature of the parts depended on the part being manufactured. The
temperature for parts A and B were found to increase with time while the temperature of part
C was relatively constant. At the end of the measurement session, part A and C were about
55°C while part B, which was measured over a shorter period, was observed to be 32°C.
(Fig.5-7). All parts were above room temperature and this was likely to be due to material
deformation and friction. From the data, it was not possible to separate the contributions
made by these two factors. However, the gradual temperature increase seen in parts A and B
suggests that, in some processes, heat accumulates in the tools as production progresses.
The data in Figs.5-7 indicates that the highest absolute temperature recorded in the
parts was 55°C, although there was scatter in the data (for example, Fig.5). It was decided
that formability should be tested with the LDH tooling at an upper temperature limit of 50°C
because this was approximately the upper bound temperature that was observed in the
14
(a)Temperature data of Part A and a picture of the finished part
(b)Location where the measurement was made
Fig.5 Temperature of Part A during serial production. This part was made from AA6111-T4
(c) Temperature data of Part B and a picture of the finished part
(d) Location where the measurement was made
Fig.6 Temperature of Part B during serial production. This part was made from AA6111-T4
(e) Temperature data of Part C and a picture of the finished part
(f) Location where the measurement was made
Fig.7 Temperature of Part C during serial production. This part was made from AA5754-O 20 25 30 35 40 45 50 55 60
0 1000 2000 3000 4000 5000
Time s T e m p e rat u re cel ci u s 20 22 24 26 28 30 32 34 36
0 50 100 150 200 250 300 350 400
Time s T e m p c e lc iu s 0 10 20 30 40 50 60 70
0 1000 2000 3000 4000 5000
15 3.4 LDH Test programme
The test programme was based on the DoE method (Funkenbusch, 2005) so that the LDH
response could be quantified statistically. The forming response was assessed at two
parameter levels and these were chosen, as far as possible, to reflect the range of values that
occur within a press shop.
Material properties were altered using simple heat treatment schemes that
approximate variations in the rolling process. For AA6111-T4, the final phase of the rolling
process, as described by Burger et al. (1995), involves solution heat treating the material at
around 500°C before it is quenched. The test samples of AA6111-T4 were therefore altered
by heating the material at 200°C for 5mins to simulate a condition where the quenching was
delayed. It was expected that this promoted the age-hardening response through the
precipitation of solute particles, as described qualitatively by Burger et al. (1995) for 6000
series alloys. The effect of the precipitation in the grain structure is to hinder the motion of
dislocations plastic deformation and Polmear (1995) describes two ways, ‘cutting’ and
‘bypassing’, in which dislocations may be hindered. Macroscopically, this leads to a higher
strength, but lower formability material. For AA5754-O, the material was further annealed at
350°C for 45mins to relieve residual stresses due to the tension leveller in the rolling process.
The temperature and time settings were based on experimental data that was used by Go et
al. (2003) to model the recrystallisation process of AA5754-O.
For AA6111-T4, heat treatment was carried out by heating as-received samples in an
oven pre-set to 200°C for 5 minutes (Burger et al., 1995). Two repeat comparisons showed
that yield stress increased from 143MPa to156MPa, while strain hardening dropped (Fig.8a).
When the hardening was approximated by a power law, , where σ is stress, ε is
strain and K is a constant, the hardening exponent, n, reduced from 0.26 to 0.23 over the
16 AA5754-O that were induced by the tension leveler during cold rolling were recovered to
reduce its σy by 112.3MPa to 104.3MPa and increase its n-value by 0.25 to 0.26 (Fig.8b).
These levels reflect the variation seen in material property data that is received at press shops.
Fig.8a True stress-strain curves for as-received and heat treated AA6111-T4
Fig.8b True stress-strain curves for as-received and heat treated AA5754-O
17 surface roughness: 0.13μm and 0.3μm. Thompson (1993) recommends a punch surface
roughness of 0.13μm for a standard LDH test while the rougher 0.3μm finish was chosen
because production tooling at press shops are generally finished with relatively coarse grit
paper. The finish on the tooling was applied with lapping paste and the average surface
roughness was verified with a Taylor Hobson Surtronic 25 surface texture measurement
device.
The effect of the quantity of lubricant was tested at 1g/m2 and 2g/m2 to reflect the quantity of
lubricant that is applied in production. For these experiments, the lubricant was applied to the
LDH samples using a brush. The quantity and uniformity of the applied lubricant was
checked for each sample with a Phund paint film gauge. This is a mechanical gauge that
measures the thickness of a film. The lubricant weight was calculated using the density of the
lubricants in Table 2.
The effect of die temperature on formability was based on the results presented in Fig.5-7 and
was measured at two temperatures, 20°C and 50°C. For tests carried out at 50°C, the punch
was soaked in an oven for two hours and replaced on the rig just before the test. The
uniformity of the temperature along the surface of the punch was checked at three points with
a thermocouple. At 50ºC, the material was not expected to have undergone a noticeable
change since mechanical properties such as yield strength, elongation and strain hardening of
both grades were shown by Li and Ghosh (2003) to change by about 10% from 20° to 200°C.
4.1 Results for Limiting Dome Height Tests of AA6111-T4
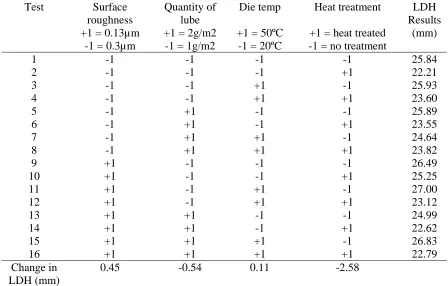
The LDH tests for AA6111-T4 were carried out according to a full factorial DoE. The
estimated mean LDH response for AA6111-T4 was 24.66mm and the estimated standard
18 various parameter combinations. Table 4 presents the results for the analysis of variance to
identify the significance of the parameters on the LDH. This was carried out using the
Statistical toolbox in Matlab v.2009. Interactions between parameters were found to be
statistically insignificant and were therefore used in the estimate of the error in the
experiments.
Test Surface roughness
Quantity of lube
Die temp Heat treatment LDH Results +1 = 0.13µm +1 = 2g/m2 +1 = 50ºC +1 = heat treated (mm)
-1 = 0.3µm -1 = 1g/m2 -1 = 20ºC -1 = no treatment
1 -1 -1 -1 -1 25.84
2 -1 -1 -1 +1 22.21
3 -1 -1 +1 -1 25.93
4 -1 -1 +1 +1 23.60
5 -1 +1 -1 -1 25.89
6 -1 +1 -1 +1 23.55
7 -1 +1 +1 -1 24.64
8 -1 +1 +1 +1 23.82
9 +1 -1 -1 -1 26.49
10 +1 -1 -1 +1 25.25
11 +1 -1 +1 -1 27.00
12 +1 -1 +1 +1 23.12
13 +1 +1 -1 -1 24.99
14 +1 +1 -1 +1 22.62
15 +1 +1 +1 -1 26.83
16 +1 +1 +1 +1 22.79
Change in LDH (mm)
[image:21.612.87.535.211.497.2]0.45 -0.54 0.11 -2.58
Table 3 Test data for the LDH tests carried out on AA6111
Parameter
Sum of Squares
Degree of
freedom Mean Squares F-ratio p
Surface
Roughness 0.811301022 1 0.811301 1.000219 0.33875
Qty of Lube 1.157953547 1 1.157954 1.427592 0.257284
Tool Temp 0.048764785 1 0.048765 0.06012 0.810821
Heat Treatment 26.61886663 1 26.61887 32.81728 0.000132
Error 8.922357737 11 0.811123
Total 37.55924372 15 Std dev = 1.58
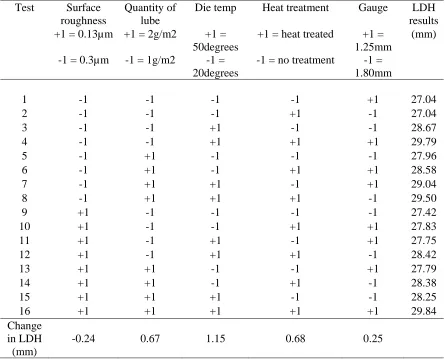
[image:21.612.91.513.551.682.2]19 4.2 Results for Limiting Dome Height Tests for AA5754-O
For the AA5754-O tests, gauge size was introduced as an additional factor and assuming no
interaction effects, a fractional design was adopted. The mean LDH response of AA5754-O
was 28.33mm and the standard deviation was 0.88mm. Table 5 presents the raw data for the
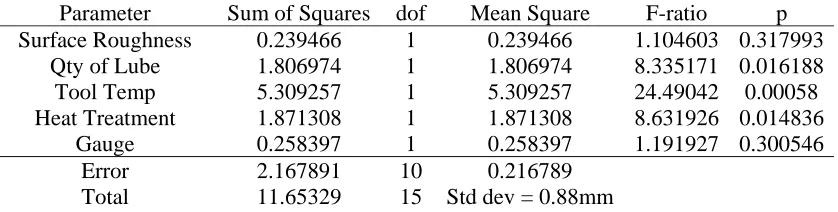
LDH measurements for the various parameter combinations and Table 6 presents the analysis
of variance to identify the significance of the parameters on the LDH.
Test Surface roughness
Quantity of lube
Die temp Heat treatment Gauge LDH results +1 = 0.13µm +1 = 2g/m2 +1 =
50degrees
+1 = heat treated +1 = 1.25mm
(mm)
-1 = 0.3µm -1 = 1g/m2 -1 = 20degrees
-1 = no treatment -1 = 1.80mm
1 -1 -1 -1 -1 +1 27.04
2 -1 -1 -1 +1 -1 27.04
3 -1 -1 +1 -1 -1 28.67
4 -1 -1 +1 +1 +1 29.79
5 -1 +1 -1 -1 -1 27.96
6 -1 +1 -1 +1 +1 28.58
7 -1 +1 +1 -1 +1 29.04
8 -1 +1 +1 +1 -1 29.50
9 +1 -1 -1 -1 -1 27.42
10 +1 -1 -1 +1 +1 27.83
11 +1 -1 +1 -1 +1 27.75
12 +1 -1 +1 +1 -1 28.42
13 +1 +1 -1 -1 +1 27.79
14 +1 +1 -1 +1 -1 28.38
15 +1 +1 +1 -1 -1 28.25
16 +1 +1 +1 +1 +1 29.84
Change in LDH (mm)
[image:22.612.84.529.229.588.2]-0.24 0.67 1.15 0.68 0.25
20
Parameter Sum of Squares dof Mean Square F-ratio p
Surface Roughness 0.239466 1 0.239466 1.104603 0.317993
Qty of Lube 1.806974 1 1.806974 8.335171 0.016188
Tool Temp 5.309257 1 5.309257 24.49042 0.00058
Heat Treatment 1.871308 1 1.871308 8.631926 0.014836
Gauge 0.258397 1 0.258397 1.191927 0.300546
Error 2.167891 10 0.216789
[image:23.612.98.517.81.187.2]Total 11.65329 15 Std dev = 0.88mm
Table 6 Analysis of variance for the parameters that were tested on AA5754-O. Only main factor effects were considered.
5. Discussion
The analysis of variance for AA6111-T4 (Table 4) shows that the only effect on
formability (LDH) is due to material property changes while for AA5754-O (Table 6), the
significant effects were due to tool temperature, quantity of lubricant used in the tests and
changing material properties. The mean squares data in Table 6 suggests that AA5754-O was
most sensitive to changes to tooling temperature, followed by material changes brought about
by the heat treatment and then by the quantity of lubricant.
5.1 Material property
The response of AA6111-T4 and AA5754-O to changes in material properties reflects
findings in the literature that formability is particularly influenced by the strain hardening
properties of a material (Section 2). For AA6111-T4, the reduction in the n-value through the
heat treatment resulted in lower formability, while for AA5754-O, the increase in the n-value
through heat treatment resulted in greater formability (Section 3.3). The extent of the effect
on AA6111-T4 was found to be greater than that for AA5754-O, based on the p-values of the
analysis of variances. This was probably because the change in the n-value for AA6111-T4
21 5.2 Quantity of lubricant
The quantity of lubricant had an effect on AA5754-O alone: increasing lubricant quantity
increased formability. Both materials were subjected to similar experimental conditions in
terms of strain rates, temperature, tool surface roughness and weight of lubricant during the
course of the experiments, and the effect may have been due to differences in the viscosities
of the lubricant, the surface roughness of the sample material or the normal pressure acting in
the contact region due to differences in the sample mechanical properties. To check if the
quantity of lubricant that was applied had any effect on the strain path of the samples, the
minor strain at the pole of the samples was examined. No effect was found and the change in
formability could not be explained as arising through a change in strain path. The effect of
the quantity of lubricant on formability was thus difficult to explain, especially since contact
forces depend on numerous factors which interact such as the load applied to the contact, the
evolving nature of the surfaces during plastic deformation and the evolving behaviour of the
lubricant in the contact.
5.3 Effect of temperature
Changing tool temperature had a significant effect on AA5754-O. From measurements of the
physical properties of AL070, it is known that the lubricant melts between 40°C to 47°C
(Accordis, 1999) and that its viscosity is an order of magnitude lower than that of MP404
(Table 2). It is postulated that the change in phase of the lubricant as well as its low viscosity
at 50°C altered the contact behaviour and thus the formability of AA5754-O. As a result,
formability increased significantly from 20°C to 50°C. It may thus be postulated that, the
pressing of the AA5754-O part in Fig.6 may have benefitted from the use of AL070 and may
22 allows a greater dissipation of heat into the tools.
Changing tool temperature did not have an effect on the formability of the AA6111-T4
samples. However, the strain distributions in the low temperature samples were qualitatively
different to those of the higher temperature samples. Strain profiles were compared along the
centre-line of the samples, as shown in Fig.9.
(a) (b)
Fig.9 (a) Shows the centreline of a sample of AA6111-T4 (b) Shows the strain distribution along the centreline of the sample
The strain distribution in the higher temperature samples were observed to contain strain
concentrations compared to the low temperature samples (Fig.10). The origin of these strain
concentrations is not known but may be due to a stick/slip mechanism. Such strain
23 Fig.10 Strain distribution for AA6111-T4 samples at two test temperatures. The circled region shows the difference in strain distribution typically seen between 20ºC and 50ºC
samples
5.4 Springback
The results from the LDH tests illustrate that material and process variations affect
formability. Strain analysis of the samples shows that the tests also affect the strain
distribution within the samples. Although springback is not the main focus of this work, it is
interesting to consider the effect of strain distribution on springback. Springback is the elastic
recovery of internal stresses after a part is formed and is a problem because it affects the
dimensional accuracy of a part. According to Asnafi (2001), springback is caused when
forming stresses are non-uniformly distributed and when the forming process induces
significant bending moments in the part.
An examination of strain profiles of the tested parts suggests that material and process
24 along the centreline were studied and the distance between peaks was measured to give an
indication of the strain distribution in the samples. An example of this measurement is shown
in Fig.11. Two difficulties caused uncertainty in locating the peaks accurately. The first was
the low density of points in the peaks associated with the physical crack, which made it
difficult to locate the peak accurately. The second was that, in some samples, the peak
associated with the un-cracked side rose very gradually, making it difficult to estimate the
location of its peak. As a result the data presented in this section is an indication rather than a
definitive account of the strain distribution in the samples.
Fig.11 Schematic diagram of the strain distribution along the centreline of a AA5754-O sample. The diagram shows how the distance between the peaks was measured.
Material and process influences were examined by carrying out an analysis of variance on the
distance between the peaks. Table 7 shows the results for AA6111-T4 while Table 8 shows
the results for AA5754-O.
Distance between peaks
25 Parameter Sum of Squares dof Mean Square F-ratio p
Surface Roughness 2.175625 1 2.175625 0.42147 0.529526
Quantity Lubricant 1.380625 1 1.380625 0.26746 0.61528
Tool Temperature 4.305625 1 4.305625 0.834102 0.380671
Heat Treatment 58.90563 1 58.90563 11.41142 0.006163
Error 56.78188 11 5.161989
[image:28.612.101.516.68.161.2]Total 123.5494 15
Table 7 Analysis of variance for the distance between peaks of AA6111-T4 samples. Only main factor effects were considered.
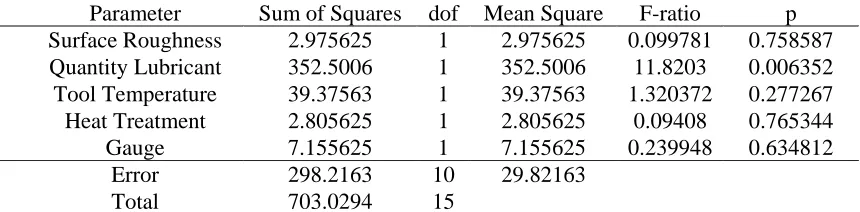
Parameter Sum of Squares dof Mean Square F-ratio p Surface Roughness 2.975625 1 2.975625 0.099781 0.758587 Quantity Lubricant 352.5006 1 352.5006 11.8203 0.006352 Tool Temperature 39.37563 1 39.37563 1.320372 0.277267
Heat Treatment 2.805625 1 2.805625 0.09408 0.765344
Gauge 7.155625 1 7.155625 0.239948 0.634812
Error 298.2163 10 29.82163
Total 703.0294 15
Table 8 Analysis of variance for the distance between peaks of AA5754-O samples. Only main factor effects were considered.
The analysis of variance for AA6111-T4 and AA5754-O indicates that significant changes to
strain distribution occurred during the LDH tests. For AA6111-T4, the strain distribution of
the samples was significantly affected by heat treating the samples alone while for
AA5754-O, the strain distribution was significantly affected by increasing the quantity of lubricant.
The change in strain distribution implies that varying material and process parameters could
have an impact on springback behaviour. However, a test that explicitly measures
dimensional accuracy, such as the stretch tests carried out by Asnafi (2001), will give a better
indication of springback behaviour.
5.5 Safety Factors
To understand the relative safety factors that may be employed on AA6111-T4 and
AA5754-O, the overall forming sensitivities of both grades was examined. The sensitivities may be
[image:28.612.92.522.215.321.2]26 Fig.12 Normal probability plot for the LDH data of AA6111-T4 and AA5754-O
Fig.12 shows that, excluding some outliers, the LDH data are linearly distributed on a normal
probability plot, indicating that the data is normally distributed. The slope of the AA5754-O
distribution is steeper than that of the AA6111-T4 distribution showing the relatively higher
dispersion in the AA6111-T4 data. This is reflected in the standard deviation of the grades,
which was 1.58mm for AA6111-T4 and 0.88mm for AA5754-O. A safety factor may be
estimated from the probability of failure of the two grades. If a lower than 5% probability of
failure is required, the threshold LDH value for AA6111-T4 will be 21.5mm and the
threshold LDH value for AA5754-O will be 27mm. If the safety factor is then defined as the
difference between the 5% probability of failure and the mean responses of the grades, the
normalised safety factors are 12.9% for AA6111-T4 and 4.6% for AA5754-O (based on
mean). This illustrates that the relative safety factor of AA5754-O can be lower than that used
27 not considered in this study. These factors include the forming response to other strain paths,
errors in tool position in a press (Col, 2003) and the attitude that is adopted towards risk.
6. Future work
This work shows that AA6111-T4 and AA5754-O are sensitive to material and process
parameters. However, a disadvantage of the DoE method is that it does not provide an
explanation of the underlying causes that bring about the changes in a response. One way of
explaining the LDH responses is to model the experiments using finite element models.
Material property inputs for the models will be for as-received and heat treated materials and
this will be used to define flow curves, yield criteria and forming limit curves. Coefficient of
friction values will be less easy to define but can be done in two ways. First, they can be
measured experimentally using a strip draw tests described by Schey (1983) for the different
surface roughness, lubricant quantity and temperature conditions. Second, if coefficient of
frictions values cannot be obtained through experimentation, the coefficient of friction in
models may be fitted to experimental load-displacement and strain data from the LDH tests.
The quality of the correlation to the experimental data could provide an insight into the
mechanisms underlying the LDH responses. Subsequent models may then be made more
sophisticated by incorporating the relevant heat transfer mechanisms.
7. Conclusions
This study set out to investigate the effect of material and process variations in the stamping
process of AA6111-T4 and AA5754-O, with particular emphasis on the effect of tooling
temperature. The temperature of parts that were manufactured in serial production was
measured and was found to be between 28°C and 55°C. The modest temperature rise is
unlikely to have resulted in changes to the properties of the material but may have altered the
28 overall material properties, tooling surface roughness, lubricant quantity and gauge. The
effects of the parameters were tested in plane strain using the LDH test. The mean response
of AA5754-O was found to be higher than for AA6111-T4, implying that it was more
formable than AA6111-T4. The standard deviation of the AA5754-O data was smaller than
that for AA6111-T4. The lower dispersion in the AA5754-O data suggested that a smaller
safety factor may be used in calculating the feasibility of parts that are made from it, since its
formability was less susceptible to material and process variations.
Material properties were found to have an effect on the formability of both materials. For
AA6111-T4, it was the only parameter that significantly affected its formability. AA5754-O
was also found, in particular, to be affected by the temperature of the tooling. This was
probably because the lubricant that was used, AL070, melts between 40°C and 47°C, thus
influencing its formability.
8. Acknowledgements
This work was carried out as part of the Premium Automotive Research and Development
Programme, which was part funded by Advantage West Midlands. The authors would like to
acknowledge the supply of material and tooling from Novelis and the helpful discussions and
suggestions made by Dr Alan Carr. The ThermaCAM SC3000 camera was loaned to us by
the Engineering and Physical Sciences Research Council Instrument Pool. The Kinexus Ultra
Rheometer was purchased by the Engineering School with financial assistance from
Advantage West Midlands and the European Regional Development Fund's Science City
Research Alliance and we were assisted in the viscosity measurements (Fig.1) by Dr. Roger
Thorpe of the Engineering School. We would also like to acknowledge the assistance of Mr.
Dominic Hollingdale, who provided us with some of the background data for the parts that
29 9. References
Accordis, 1999. Safety Data Sheet, Al070, Issue B, AL070europeA, Accordis Fine Chemicals Ltd, Registered Office PO Box 5, Station Road, Spondon, Derby DE21 7BP.
Asnafi, N., 2001. On springback of double-curved autobody panels. International Journal of Mechanical Sciences 43, 5-37.
Ayres, R., 1983. The Limiting Dome Height (LDH) Test and The Grid Analyzer, In: Wagoner, R. (Ed.), Novel Techniques in Metal Deformation Testing. TMS, Warrendale, PA, p. 47.
Ayres, R., Brazier, W., Sajewski, V., 1979. Evaluating the GMR-Limiting Dome Height Test as a New Measure of Press Formability Near Plane Strain. J. Applied Metalworking 1, 41-49.
Barber, R., 1978. Non-Contact Temperature Measurement of Metal Surfaces in the Open. Advances in Instrumentation 33, 417-434.
Barnes, H., 2000. A Handbook of Elementary Rheology. The University of Wales Institute of Non-Newtonian Fluid Mechanics, Aberyswyth.
Blumel, K., G, H., P, L., 1988. Variations of the Stamping Process, Controlling Sheet Metal Forming Processes. ASM, Dearborn, USA, pp. 9-16.
Burger, G., Gupta, A., PW, J., DJ, L., 1995. Microstructural Control of Aluminium Sheet Used in Automotive Applications. Materials Characterization 35, 23-39.
Col, A., 2003. Investigation on Press Forming Scatter Origin, Proceedings of the 6th International ESAFORM COnference on Material Forming, pp. 183-186.
de Souza, T., Rolfe, B., 2008. Multivariate modelling of Variability in Sheet Metal Forming. Journal of Materials Processing Technology 203, 1-12.
Fischer, R., Schey, J., 1992. Tribological Factors Affecting the LDH Test, Proc. Of the SAE Intl Congress and Expo, pp. 57-61.
FLIR, 2003. FLIR ThermaCAM SC300 Manual: Thermographic Measurement Techniques, pp. 87-126.
Ghosh, A., 1975. The Effect of Lateral Drawing-In on Stretch Formability. Metals Engineering Quarterly, 75.
Go, J., WJ, P., Militzer, MA, W., 2003. Modelling Recovery and Recrystallisation durng annealing of AA5754 Aluminium Alloy. Materials Science and Technology 19, 1361-1368.
Graf, A., Izworski, N., 1993. Industrial Implementation of Practices for LDH Stability, Proc. Of the SAE Intl Congress and Expo, pp. 990-995.
30 Haar, R.t., 1996. Friction in Sheet Metal Forming, The Influence of (Local) Contact Conditions and Deformation. University Twente.
Izworski, N., Graf, A., 1991. Obtaining LDH Stability, Proc. Of the SAE Intl Congress and Expo, pp. 41-45.
Li, D., Ghosh, A., 2003. Tensile Deformation Behaviour of Aluminium Alloys at Warm Temperatures. Materials Science and Engineering A352, 279-286.
Nelkon, M., Parker, P., 1982. Advanced Level Physics, 5th Edition ed. Hienemann Educational Books.
Newby, J., 1981. Temperature Changes Fromability of Sheet Metals, International Congress on Metal Engineering, Sheet Forming, Birmingham, UK, p. 14/11.
Pereira, M., Okonkwo, P., Yan, W., Rolfe, B., 2010. Deformation and Frictional Heating in Relation to Wear in Sheet Metal Stamping. Steel Research International 81, 713-716.
Polmear, I., 1995. Light Alloys, Metallurgy of the Light Metals. Arnold, a division of Hodder Headline plc.
Schey, J., 1983. Tribology in Metalworking. American Society for Metals.
Thompson, R., 1993. The LDH Test to Evaluate Sheet Metal Formability – Final Report of the LDH Committee of the North American Deep Drawing Research Group. SAE Technical Paper Series Paper No. 930815, 291-301.
Wang, C.-Y., Hancock, W., 1997. Minimizing Splits in the Automotive Stamping Process by Logistic Regression. Quality Engineering 9, 653-663.