University of Warwick institutional repository: http://go.warwick.ac.uk/wrap
This paper is made available online in accordance with publisher policies. Please scroll down to view the document itself. Please refer to the repository record for this item and our policy information available from the repository home page for further information.
To see the final version of this paper please visit the publisher’s website. Access to the published version may require a subscription.
Author(s): X Liu, Z Yue, Z Cai, D G Chetwynd and S T Smith Article Title: Quantifying touch–feel perception: tribological aspects Year of publication: 2008
Link to published article:
Quantifying touch–feel perception: tribological aspects
X. Liu1, Z. Yue1, Z. Cai1, D. G. Chetwynd1 and S. T. Smith2
1
School of Engineering, University of Warwick,COVENTRY CV4 7AL, UK 2
Cetre for Precision Metrology, UNCC, 9201 University City Blvd, Charlotte, NC 28223, USA
Abstract. We report a new investigation into how surface topography and friction affect human touch-feel perception. In contrast with previous work based on micro-scale mapping of surface mechanical and tribological properties, this investigation focuses on the direct measurement of the friction generated when a fingertip is stroked on a test specimen. A special friction apparatus was built for the in-situ testing, based on a linear flexure mechanism with both contact force and frictional force measured simultaneously. Ten specimens, already independently assessed in a ‘perception clinic’, with materials including natural wood, leather, engineered plastics and metal were tested and the results compared with the perceived rankings. Because surface geometrical features are suspected to play a significant role in perception, a second set of samples, all of one material were prepared and tested in order to minimise the influence of properties such as hardness and thermal conductivity. To minimise subjective effects, all specimens were also tested in a roller-on-block configuration based upon the same friction apparatus, with the roller materials being steel, brass and rubber. This paper reports the detailed design and instrumentation of the friction apparatus, the experimental set up and the friction test results. Attempts have been made to correlate the measured properties and the perceived feelings for both roughness and friction. The results show that the measured roughness and friction coefficient both have a strong correlation with the rough-smooth and grippy-slippery feelings.
Keywords: Measurement of Friction, Metrology and Characterisation for Materials Science, Intelligent Measurement and Instrumentation, Sense of Touch, Skin Tribology.
1. Introduction
There is a major trend for product development to move towards customer-oriented, affective design, which takes account of customers’ emotional feelings and preferences. As we come across products in our daily life, impressions of their qualities are created in our minds through a combination of sensation, perception and cognition. Touch-feel, one of the basic human senses essential for people’s everyday life, is not as simple as some may think. Unlike vision or hearing, touch-feel perception can only be stimulated when the human skin contacts or even strokes over object surfaces, and the interaction between the person and the perceived surface is determined both physiologically and psychologically. For many hand-held products such as mobile phones, notebooks and cosmetic packages and for car interiors, this subjective judgment has recently been recognized as a key factor in winning or losing customers. Hence there is growing interest in studying and quantifying touch-feel perception. Given the proper functionality, usability, reliability and safety, a product’s market share is often affected by surface touch perception.
Engineering, developed originally by Nagamachi [2]. In this type of research, test samples with different surface properties are produced and categorised, and adjective words for describing the surfaces collected. Multivariate analysis methods are then applied to find out the relationship between the subjective feeling results and the physical properties of the surfaces. This technology has recently been applied to industries such as automotive, cosmetic and other consumer-orientated product manufacturers [3]. The above-mentioned four modes are not equally weighted in touch-feel perception. Toyota Motor Corp [4] has claimed that soft-hard feel is dominated by hardness followed by frictional resistance, while roughness is not significant. However, Barnes et al [5] reported that surface finish does play an important role in the subjective feeling perceived when stroking a finger tip on glass surfaces for cosmetic packaging. Their results show that when a surface is less rough than a finger tip, it will generate desirable feelings, but when it is rougher than a finger tip it will generate undesirable feelings.
We have already attempted to quantify the touch feeling perceived on car interior components, by using our unique, in-house developed Tribological Probe Microscope (TPM) [6-9]. These results show a strongest, although still modest, correlation between the perceived feeling and the measured surface roughness, followed by hardness and lowest correlation with friction coefficient, although there are concerns about the relevance of some data, see Section 2. On the other hand, the perceived feel for moist-dry or slippery-grippy may not be dominated purely by the friction term. A previous testing clinic run at the Centre for Ford Product Development in Cologne has shown that the perceived response has a wider spread for friction than for roughness and hardness [10], indicating that the participants could not consistently assess this property. Therefore, we here explore an improved method to evaluate the friction between a human’s finger tip and a material surface, and report on a new friction test apparatus specially made for measuring directly the friction generated when a finger tip strokes against a test specimen. The experiments study mainly the set of ten samples used in an earlier Ford clinical survey test and evaluated by TPM. They cover a wide range of properties that is useful for generic screening but from which it is difficult to extract models having predictive value. As a first step towards this latter need, tests were also run on a set of specially made aluminium samples. This set offers minimal property variability, except for differences in geometrical topography.
2. Background of the Ford samples and their evaluation
The Ford sample set consists of visible interior materials used in passenger cars, not only for their fitness to perform their intended functions, but also for their aesthetic appearance and feel. Such materials as Polypropylene, Polycarbonate blends and Acrylonitrile/Butadiene/Styrene (ABS) are commonly used for passenger vehicle interior components. They can either be self-coloured by incorporation of pigmentation into the resin or be painted or otherwise coated to achieve the appearance required. Their visible surfaces are usually embossed with a grain pattern to improve the appearance and hide surface defects such as minor sink marks and flow lines that can occur as a result of the moulding process and part design. Thermoplastic elastomeric materials are also often used to cover control knobs and switches to improve their feel and to meet head and knee impact regulations if the parts protrude. They are also used to cover stowage areas to prevent items sliding and rattling during driving. In addition, the Ford set included polished black marble to complete the spectrum of materials with a range of tactile qualities.
assessment form for each of the 10 materials with 4 linear scales representing each of the range of tactile perceptions of smooth/rough, soft/hard, slippery/grippy and warm/cold. Participants were asked to place a mark on each scale at a position where they felt their perceptions fell in relation to the subjective extremes. The actual positions of each of the responses was then measured and expressed as a numerical value from 0 to 100 to enable statistical analysis to be carried out. Table 1 summarises the results for averaged perception response for smooth/rough, slippery/grippy and soft/hard that were obtained, further detailed results can be found in [9].
Table 1 Results of the averaged values for perception and corresponding TPM mappings of roughness, friction coefficient and hardness on materials used in the investigation.
Sample Material Smooth/Rough
Perceived Ra/m
Slippery/Grippy
Perceived
Soft/Hard
Perceived H
S1 Polished cherry wood 41.9 1.679 50.9 0.42 79.7 3.70
S2 Hard matt paint system on ABS substrate
24.7 0.629 50 0.45 68.7 0.68
S3 Soft-feel clear-coat paint system on ABS substrate
25.2 0.335 62.2 0.23 53 0.36
S4 ABS/polycarbonate blend 9.6 0.070 34.1 0.43 76.8 1.98
S5 Styrene/ethylene/butadiene/styre ne (SEBS) thermoplastic
31.3 0.356 82.6 0.50 39.8 0.21
S6 EPDM-modified polypropylene
with 20% talc filler
15.6 0.404 42.6 0.36 77.1 1.14
S7 Polished black marble 7 0.083 24.9 0.3 91.9 33.8
S8 Soft-feel top-coat paint system on an ABS substrate
36.2 0.722 55.8 0.46 67.1 0.29
S9 Ungrained natural leather 53.3 0.874 51.5 0.29 24.8 0.34
S10 “Brushed” aluminium 9 0.301 26.7 0.27 91.6 14.9
The same ten samples were then measured by the multi-function tribological probe microscope (TPM). This unique custom-built instrument provides micrometer-scale mappings, highly correlated in both space and time, of over topography, friction, hardness and elastic modulus. Details of TPM design and instrumentation can be found in reference [6]. The current measurements were made using a Berkovich diamond tip with a radius of 0.1 m, sampling on a square grid at 2.5 m over a scan area of 100100 m2
. Friction measurements were taken while moving between grid points and all others only when the scan was stopped and settled at each grid point. Topography and friction mappings were at a normal force of 50 N, while for the hardness and Young’s modulus the forces were ramped up to 0.5 mN for soft materials and to 2 mN for hard ones. For each sample, averaged values for friction coefficient, hardness and Young’s modulus were calculated across all the points in these mappings. The topography mappings were auto-levelled using a linear least-squares plane, but no other filtering applied over such small area scans. The arithmetic average amplitude was used as a summary statistic; strictly, this is the Sa parameter but for consistency with still-common practice we refer to it as Ra here.
Results for roughness (Ra), friction coefficient () and instrumentation hardness are also listed in
Table 1, for comparison.
Correlation analysis has been carried out for perceived and measured data, although it must be treated with care because there is an arbitrary numerical scale associated with the perception tests. The results show a strong correlation (for effective engineering) of 0.76 between smooth/rough perception and measured Ra value, followed by a coefficient of 0.59 for soft/hard
uncertainties associated with the qualitative testing mean that uncertainties from specific processing methods, filter selection, etc., on the instrument are of no practical concern to such comparative experiments.
It should be stressed that, while seeking insights into the materials properties that influence touch perception, a significant motivation for the above work was to investigate whether TPM-like instruments could become important tools for future touch research. Indeed, a modified instrument is currently under development [11]. The current TPM has a maximum scan size of 100100 m2
of the TPM, which is little more than a pin-point compared to a finger size. This scale mismatch is one likely reason for the low correlation between the perceived slippery/grippy and measured friction coefficient. There are hints of evidence that reported grippiness is relatively strongly influenced by roughness and the TPM cannot cover the full spatial bandwidth of the fingertip. Friction as measured by TPM is hardly influenced at all by typical roughness scales. More generally, statistical analysis shows that the perceived responses for slippery/grippy have very wide spread distributions, indicating that this property can not be consistently assessed by the participants (perhaps in part because of the interpretation of roughness within it). This has led us to develop a method in which the friction force is measured directly while a participant is making his/her touch-feel stroking movement, so giving an immediate link relating the measured friction to the perceived feel for slippery and grippy.
There are a number of reports on measuring the friction of human skin, mainly for cosmetic and clinical applications [12]. The friction devices reported are generally grouped into two types; a probe sliding over the skin and a probe rotating against the skin. In those devices, the body skin is in stationary while the probe is moving either in linear or reciprocating manners. For touch friction measurement, there are two recent reports [13, 14] which are particularly focused on the measurement of the friction produced by fingertips.
3. In-Situ Friction Test Apparatus
Fig. 1 Photograph of the new friction test apparatus
The load cell (ELFS-T3M) has a range of 10 N, but was calibrated for the range from 0 to 2 N with an amplification of 100 in the conditioning circuit giving a sensitivity of 1.46 V N-1. This range covers the normal pressures that people exert when trying to make touch-feel assessments. Other studies of the engineering tribology of skin have recommended that typical loads for friction tests should be from 0.3 to 3 N [14]. In our experience the loading force produced during finger stroking movements has rarely exceeded 1 N. The capacitive sensor used to measure the frictional force was calibrated against standard weights. During such calibration the test apparatus was mounted vertically in order to place the weight on the top of the side wall of the flexure, while monitoring the output of the capacitive sensor. Fig. 2 shows this calibration result. It is highly linear within the force range of interest, with a high sensitivity of around 1 V N-1. The flexure spring system was designed to have a moderately high stiffness in order to improve its dynamic response. This stiffness was close to 50 kN m-1, measured using a similar procedure to that just described but with the displacement under loading monitored independently by a stylus instrument (Form Talysurf). The resonant frequency of the apparatus is 75.5 Hz. The resolutions for the load cell and the friction sensor are 0.6 mN and 1.2 mN, respectively.
Fig. 2 Calibration of the friction sensor
Specimen
Load cell Capacitive sensor
[image:6.595.182.433.524.716.2]4. Measurement of touch friction
4.1 Measurement on Ford samples
The ten samples supplied by Ford were first tested on the new friction apparatus. Participants made a touch-feel stroke on a test material in a natural way, while both the loading force and the frictional force were measured simultaneously. The test material was mounted on the sample holder and the stroking direction was in line with that of the flexure deflection. We have tried the stroking movement under various loads from 0.3 to 1.5 N and found that the comfortable load is around 0.5 N. Each participant was asked to wash and dry his or her hands 15 minutes before the test. They were guided to attempt to keep the loading force at around 0.5 to 0.59 N by reference to a visual indicator. All experiments were conducted in a metrology laboratory with temperature and humidity controlled to 20 1ºC and 40 5% RH.
0 2 4 6 8 10
0 0.5 1
L
oad
0 2 4 6 8 10
-0.5 0 0.5
Fr
ic
ti
o
n
0 2 4 6 8 10
-1 0 1
Time (sec)
F
ri
c
ti
on C
o
e
[image:7.595.149.441.249.439.2]f
Fig. 3 A typical set of friction measurements from a fingertip. Load and friction are expressed in N.
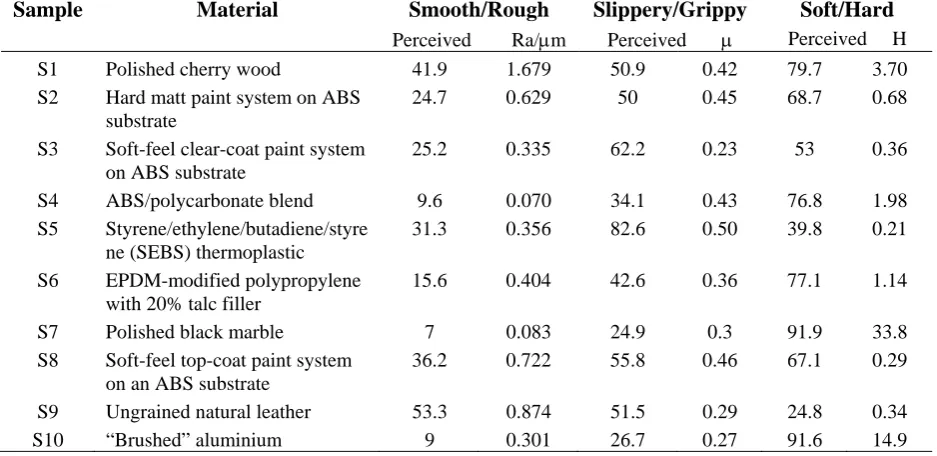
surface, the higher the friction produced. Fig. 4 indicates large discrepancies between the perceived rating and the measured results for some samples, while the trends are quite similar with others. The correlation between the perceived rankings and the measured finger friction coefficient is only 0.2. This reflects our earlier suggestion that the perceived feel for slippery-grippy may not be dominated by the friction term.
0.00 0.10 0.20 0.30 0.40 0.50 0.60 0.70 0.80 0.90
0 1 2 3 4 5 6 7 8 9 10
Sample No
Fr
ic
ti
on c
o
e
e
fic
ie
nt
[image:8.595.157.455.151.325.2]Friction rig TPM Ford
Fig. 4 Friction test results on the ten Ford samples, compared with the original average slippery-grippy ratings: the latter is scaled into 0-1 for convenience but is not a true ‘friction
coefficient’.
4.2. Measurements on aluminium samples
Specimen sets such as that measured above are representative of the ranges of materials and processes relevant to specific applications, but they therefore encompass many characteristics that combine in complex ways to provide the overall touch-feel perception. An alternative test strategy is to develop artificial specimens in which there is a deliberate attempt to hold constant all but one property of assumed relevance. Surface roughness is an interesting and important case. It tends to correlate only very weakly with coefficient of friction in typical engineering applications because contact is dominated by a small number of small contacts between relatively hard asperities on each surface. However, it appears as a likely major contributor to the deviation between measured and perceived friction, perhaps because the finger tip is compliant. So a new set of samples was prepared in one highly reproducible material and with surfaces generated by the same basic process but with different scales of actual roughness. All made of aluminium alloy, six flat surfaces were generated by milling (AM1, AM2, …, AM6) and six cylindrical ones by turning (AT1, AT2, …, AT6). The roughness of the aluminium samples was measured by conventional stylus profilometry, using a Taylor Hobson Form Talysurf instrument fitted with an interferometric pick-up giving a useful resolution of a few nm and a range more than ten times that needed here. A nominal 2 m stylus was used with a normal contact force of 0.7 mN and a traverse speed of 5 mm s-1. Traces were auto-leveled to a linear least squares straight line and then filtered with a standard 0.8 mm cut-off. All processing and parameterisations used the commercial software supplied with the instrument. The sets covered the range of Ra values (average amplitudes) from 0.3 to 13 m and spacing values were from a few tens to a few hundred micrometres.
the participant was asked to give his or her slippy-grippy ranking (1 to 6) of the specimen. Fig. 5 shows the measured friction coefficient for each sample, averaged from ten people; again, the error bars show the standard deviation. The perceived rankings are also plotted for comparison. Here, there is much better correlation between these two sets of data with a correlation of 0.79. Fig. 6 shows the averaged results for the smooth-rough feel and the profile roughness measured by the Form Talysurf. Here the correlation reached as high as 0.95 for roughness between the measured Ra and the perceived smooth-rough rankings. Comparing data in Figs 5 and 6, there is a general trend for the measured friction to reduce as the measured roughness increases for each manufacturing process, while the perceptions perhaps show a more sensitive correlation of the same general type. Other surface parameters were also compared with the perceived rakings. The averaged spacing values of these specimens have the similar trend to the roughness Ra so it has a
similar high correlation with the perceived rankings. Surface kurtosis showed a correlation of about -0.8, which may reflect that a finger tip will tend to bridge, and not detect, narrow large-amplitude features. There was no clear correlation between amplitude distribution skewness and the perceived rankings.
0.0 0.1 0.2 0.3 0.4 0.5 0.6 0.7 0.8 0.9
AM1 AM2 AM3 AM4 AM5 AM6 AT1 AT2 AT3 AT4 AT5 AT6
Samples F ri c ti o n co ef fi ci en t 0 1 2 3 4 5 6 P e rce ived ra n k in g Friction-rig perceived
Fig. 5 Measured values and perceived rankings of finger friction on aluminium samples.
0 2 4 6 8 10 12 14
AM1 AM2 AM3 AM4 AM5 AM6 AT1 AT2 AT3 AT4 AT5 AT6
Sam ples R oughne s s ( u m ) 0 1 2 3 4 5 6 7 P e rc e iv e d r a nk in g Measured Perceived
Fig. 6 Measured values and perceived rankings of roughness on aluminium samples.
[image:9.595.169.452.497.667.2]other factors were not controllable, such as variations of individual finger prints, skin moisture conditions, the angle of the index finger to the test specimen (some at about 45 but others almost parallel), etc. Sivamani et al. [12] have found that the skin friction appears to depend on age, anatomical site and skin hydration. Others have reported large friction coefficients (> 1) and large variations (> 100%) for human fingertips [13]. Therefore, in order to gain more insights into areas deserving further detailed study, we have also built another experimental system. Prompted by the possibility of important interactions between roughness and finger compliance, a roller-on-block friction test apparatus has directly compared the friction produced by other counter materials on both sets of specimens.
5. Ring-on-block friction test apparatus
To minimize uncertainties in the desired comparisons, the ring-on-block friction test apparatus is built from the same flexure sensing system described in Section 3, with the finger replaced by the edge of a rotating disc. It is convenient to control the contact force by pressing the sample against the fixed position of the roller, rather than vice versa. As shown in Fig. 7, a roller in contact with the test specimen is directly fixed to the spindle of a combination of a DC motor and a gear-box with a reduction ratio of 135:1. The roller has a radius of 15 mm and can be exchanged for testing different materials. The tests reported here used three rollers, made of steel, brass and silicone rubber. To accommodate test specimens of different thickness, the whole roller and motor assembly can be adjusted in height by a set of screws. The normal load between the roller and the specimens is provided passively by a ball-bearing supported lever carrying a sliding weight. Once the counterweight is clamped in position, it produces a nearly constant pre-set static contact force, as long as the lever remains roughly horizontal. As before, the load cell provides continuous monitoring of the actual normal load, while the high-sensitivity capacitive gauge measures the flexure displacement and hence the friction force. The counterface sliding speed is controlled by the motor voltage with a sensitivity of 2.35 mm/V. The apparatus is operated automatically by a PC and a data acquisition system, based on the LabVIEW® software package, to provide real-time measurements of the loading force, frictional force, and dynamic friction coefficient of the specimen under test.
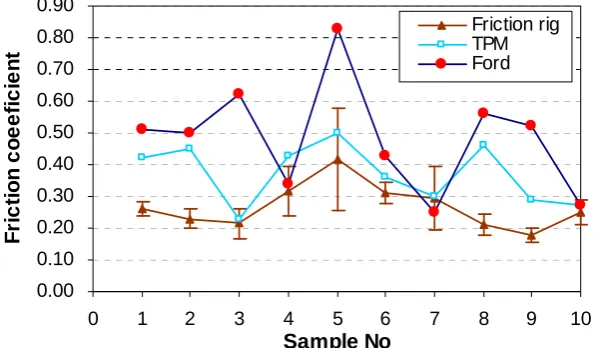
[image:10.595.164.446.489.662.2]As the specimen contacts the roller, the flexure will deflect away from its neutral position due to the static friction between the roller and the test specimen. Therefore, all tests were carried out in both rotation directions in order to avoid uncertainty in the friction measurement. Fig. 8 shows a typical friction measurement, actually obtained from sample 9 (natural leather) using the brass roller. For notational convenience only, the friction coefficient is allocated a sign to distinguish
Fig. 7 Photograph of the roller-on-block- friction apparatus Roller
Motor and Gearbox Height
adjustment
Counter weight
consistently the direction of motion. The mean friction coefficient is obtained by averaging the absolute values of these two. To simulate the fingertip touch feel movement, the contact load was set to 0.5 N and the sliding speed to 4.7 mms-1 for all friction measurements reported, except for those explicitly examining the effects of different speeds and contact loads.
0 2 4 6 8 10 12 14 16 18
-0.8 -0.6 -0.4 -0.2 0 0.2 0.4 0.6
Time (sec)
Fri
c
ti
on c
o
e
ffi
ci
ent
[image:11.595.162.430.142.281.2]- Rotation + Rotation Mean
Fig. 8 A typical set of friction measurement from a roller.
The effect of sliding speed on the friction coefficient between a test specimen and the roller exhibits a trend generally similar to that shown in Fig. 9. It is fairly constant at slow speeds and then tends to increase slowly towards a larger value depending on the nature of the specimen. Most of the Ford samples have a coating either hard or soft on the top of specimen surface and it is plausible that changes in this layer are affecting the friction coefficient.
0 2 4 6 8 10
-1 -0.5 0 0.5 1
Drive voltage (V)
F
ri
c
ti
o
n
c
o
e
ffi
c
ie
n
t
+ Rotation - Rotation Mean
[image:11.595.181.428.403.539.2]-0.4 -0.2 0.0 0.2 0.4 0.6 0.8
0.2 0.4 0.6 0.8 1 1.2 1.4 1.6 Loading force (N)
F
ri
c
ti
o
n
c
o
e
ffi
c
ie
n
t
+ Rotation - Rotation Mean
Fig. 10 Effect of loading force on the friction coefficient of sample 2 using a brass roller.
The effect of load on the friction coefficient is shown in Fig. 10. Again, the friction coefficient was measured in both rotation directions and the averaged value (mean of moduli) is also shown. Generally there is a slight decrease in friction coefficient as the load increases, although the reverse direction is anomalous at the first load of 0.35 N.
6. Measurements of roller-on-block friction
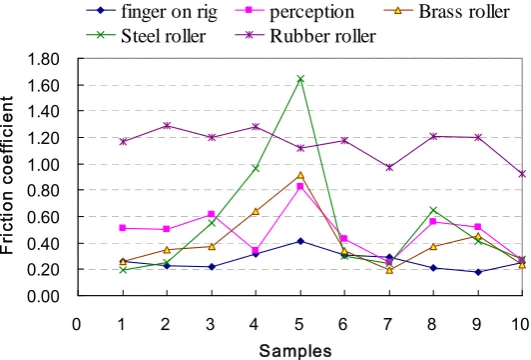
[image:12.595.187.422.82.243.2]The dynamic friction coefficients between both sets of samples and the three roller materials were measured on the roller-on-block friction apparatus over a period of 8 s at a sliding speed of 4.7 mm/s, a contact force of 0.5 N and a sampling rate of 1000 points/s. The mean and standard deviation (std) of the results for the Ford samples are given in Table 2, together with the results from fingertip loading. These results are plotted alongside the perceived ratings in Fig. 11. In general, both the brass and steel rollers show similar patterns on the friction curves, although the steel roller produced much higher friction on samples S3 to S5 and S8. The correlation between these two curves is as high as 0.96. These curve shapes also compare well with the friction curve produced by fingertips with a correlation coefficient of 0.68 between finger stroke and steel roller. The silicone rubber, however, showed large but fairly consistent friction coefficients over all samples, giving much lower correlations (< 0.5) with the other curves. Originally it was thought the silicone rubber might have similar properties to a fingertip but the results contradict this speculation.
0.00 0.20 0.40 0.60 0.80 1.00 1.20 1.40 1.60 1.80
0 1 2 3 4 5 6 7 8 9 10
Samples
F
ri
ct
ion
co
ef
fic
ien
t
finger on rig perception Brass roller Steel roller Rubber roller
[image:12.595.169.435.569.749.2]Table 2 Friction coefficients obtained from the roller-on-block apparatus and from fingertip testing.
Sample
Finger stroke Brass roller Steel roller Rubber roller Mean Std mean std mean std mean std
S1 0.26 0.02 0.26 0.01 0.20 0.02 1.17 0.06
S2 0.23 0.03 0.35 0.04 0.25 0.02 1.29 0.06
S3 0.22 0.05 0.37 0.06 0.55 0.36 1.20 0.14
S4 0.32 0.08 0.64 0.04 0.96 0.10 1.28 0.10
S5 0.42 0.16 0.92 0.05 1.64 0.08 1.12 0.04
S6 0.31 0.03 0.34 0.05 0.30 0.04 1.17 0.10
S7 0.30 0.10 0.19 0.02 0.24 0.02 0.97 0.09
S8 0.21 0.03 0.37 0.02 0.65 0.05 1.21 0.04
S9 0.18 0.02 0.45 0.01 0.42 0.03 1.20 0.08
S10 0.25 0.04 0.24 0.06 0.27 0.05 0.92 0.09
Some materials showed large standard deviations in their friction coefficients, e.g., with the steel roller on samples S3, S4 and the brass roller on S3. There were some similar cases on aluminium samples. This is believed to be caused by stick-slip vibration during the measurement process. The coatings on some samples may be affecting stick-slip behaviour. Stick-slip was also present on smooth surfaces such as the polished marble specimen (S7) when stroking a fingertip on them.
The objective measurements from the brass and steel rollers produced a pattern of friction coefficients over these ten samples showing the same trends as the subjective Ford perception ratings, with correlation about 0.65. Interestingly, the patterns match arguably better than those between the perceptions and actual friction from a fingertip. The results imply that friction related feel for some materials such as thermoplastic (S5), marble (S7), natural leather (S9) can be consistently assessed at a subjective level. The difficulty in assessment may be compounded by the design of the "clinic": there is very little guidance in the literature on how to set up such a clinic for tactile perception. There is no shortage of information on such "clinics" in the food and beverage industries but these may not be strictly applicable.
As expected, the results of roller-on-block friction tests on the aluminium specimens are fairly stable with coefficients around 0.20 to 0.25 for both brass and steel rollers, while the silicone rubber produced much higher friction coefficients between 1.2 and 1.7. The differences in surface roughness amplitude and spacing of these aluminium specimens had no significant effect on their friction coefficients for brass and steel rollers. However, with silicone rubber the friction coefficient tended to reduce as the roughness increased. This also happened with fingertip stroking on the same set of samples, which indicates that rubber may feel the difference in surface finish like our fingertip, as it deflects in contact with the asperities. The correlation between these friction sets is 0.46. Further work is in progress to examine whether grooving the surface of the silicone rubber roller to simulate a finger print, improves the correlation.
7. Conclusions
to accommodate a finger stroking movement. Measurements of finger friction were taken on a set of specimens of different materials, representative of those used in tactile applications, and already assessed subjectively by Ford. A second set of aluminium samples was used to examine the apparent conflation of roughness and friction in perception tests. The conventional friction coefficients for these specimens against various counterfaces were also tested using a roller-on-block configuration and the same measurement mechanism as for the in-situ friction apparatus. From this comprehensive study, we derive the following observations and conclusions:
Touch friction is complicated and it can be affected by many factors such as surface material, surface finish, skin conditions and test conditions. Stroking on very smooth surfaces (such as Ford samples S4 and S7) the fingertip can cause stick-slip vibration leading to large variations in the measurement. Touch friction is obviously affected by the contact area produced by a fingertip, so a better control of how a fingertip makes a contact with a test surface will be needed to reduce participant-related variability. Skin conditions are not controllable as there are so many variations in finger print, dryness, firmness and thickness. Using just one participant can minimize some uncertainties, but introduces obvious limitations.
Even with the same material, touching different surface finishes produces different perceptions of friction often inconsistent with actual friction forces and with typical behaviours in engineering tribology. Rougher surfaces were perceived to have lower friction coefficients, with some evidence of a trend for the actual friction also to reduce a little. However, tests using brass or steel roller tests reported more or less constant friction coefficients. It seems plausible that the compliance of a finger tip could be a major factor in the way roughness is interpreted within a slippery-grippy judgement, but, slightly counter-intuitively, a rubber roller showed friction behaviour unlike either metals or skin. The tests suggest that sensitivity to actual contact pressures and stroking speeds is low enough for touch perception testing under fairly natural conditions to be credible.
By the standards of perception testing, where high variabilities are the norm, there is a generally good correlation (0.68) between touch friction and the friction measured by brass or steel rollers over a wide range of materials. There is also a correlation of 0.65 between perceived ratings and measured friction from brass/steel rollers over the Ford samples. This indicates that touch friction is strongly affected by the material aspect.
Acknowledgments
The authors express gratitude to Mr. B. Hennessey of Ford’s Materials Technology Centre in UK and Dr T. Rübenach of Ford’s Global Craftsmanship Product Development in Germany for the supply of test samples and the clinical survey results. Thanks are given to technicians in the Metrology Laboratory of the School of Engineering, University of Warwick, and also to Mr. M. K. Lau who was involved in the earlier stage of this project.
References
[1] Krueger L. E. in Foulke W. Schiff, E. (Eds.) 1982: Tactual Perception: A Sourcebook, CUP, Cambridge.
[2] Nagamachi M. 1995: Kensei engineering – a new ergonomic consumer-orientated technology for product development,Int. J. Indus. Ergonomics,15 (1)3-11.
[3] Nagamachi M. 2002: Kansei engineering as a powerful consumer-oriented technology for product development, Applied Ergonomics, 33 289-294.
[4] Kenji Kawazu, Mika Kai, Kelji Koike, Makoto Imada and Kazumi Yasuda 2000: Study of favourable paint-quantifying the sense of touch for painted panels: SAE 2000 World Congress, Detroit, Michigan, March 6-9, 2000-01-1362.
[5] Barns C. J., Childs T. H. C., Henson B. and Southee C. H. 2004: Surface finish and touch- a case study in a new human factors tribology, Wear, 257 740-750.
[6] Liu X and Gao F 2004: A novel multi-function tribological probe microscope for mapping surface properties. Meas. Sci. Techn15 91-102.
[7] Liu X., Bell T., Chetwynd D. G. and Li X. Y. 2003: Characterisation of engineered surfaces by a novel four-in-one tribological probe microscope, Wear255 385-394.
[8] Liu X. and Piotter V. 2007: Mapping micro-mechanical properties of carbon filled polymer composites by TPM, Precision Engineering, 31 (2) 2-168.
[9] Liu X., Chan M. K., Hennessey B., Rübenach T. and Güray A. 2005: Quantifying touch-feel perception on automotive interiors by a multi-function tribological probe microscope,
Journal of Physics: Conference Series13 357-361.
[10] Hennessey B. 2006: The subjective tactile perception of passenger vehicle interior surfaces and their objective physical measurement,MSc Dissertation, Surrey University.
[11] Cai Z. and Liu X., Thermal property measurement: a new feature on the multi-functional tribological probe microscope, to be presented at 8th International conference and 10th Annual Meeting of EUSPEN (Europe Society for Precision Engineering and Nanotechnology), Kongresshaus Zurich, 18th-22nd May, 2008.
[12] Sivamani Raja K., Goodman Jack, Gitis Norm V. and Maibach Howard I. 2003: Coefficient of friction: tribological studies in man an overview, Skin Res. Technol. 9
227-234.
[13] Gee M. G., Tomlins P., Calver A., Darling R. H. and Rides M. 2005: A new friction measurement system for the frictional component of touch, Wear259 1437-1442.
[14] Childs T. H. C. and Benson B. 2007: Human tactile perception of screen-painted surfaces: self-report and contact mechanics experiments, Proc. I. Mech. E. Part J: J. Engineering Tribology, 221 (3) 427-441.