Performance Measurement System
Development in SMEs: Testing & Refining The
Circular Methodology
Author: E. F. Langwerden
University of Twente P.O. Box 217, 7500AE Enschede
The Netherlands
ABSTRACT:
One main obstacle for Performance Measurement Systems (PMS)
implementation in Small and Medium Enterprises (SMEs) are non-formalized
strategies, because the strategic rationalization loop, generally used in PMS
development, cannot be used to translate strategy into measurable performances.
Therefore, to overcome this obstacle, The Circular Methodological approach is
bottom-up, using the operational reality as a starting point. This article offers a
contribution to research on PMS development in SME’s by refining and
validating The Circular Methodology, using an action research approach, in a
small manufacturer operating in the food sector. The methodological nature was
found to have two main benefits. Firstly, the strategy formulation process as
well as the desired dashboard design process are positively affected by the
bottom-up approach, since the constrains and affordances of the operations were
understood and taken into account. Secondly, studying the emergent strategy
and operational reality created significant input during the strategy formulation
process.
Several methodology implementation obstacles as well as respective
improvements have been identified. Most obstacles found were easily overcome
and seem to be due to the methodology’s novelty. More severe obstacles are the
high amount of tacit knowledge and non-formalized practices, which limit the
ease of data gathering. The author identified ways to overcome this obstacle,
however future research should test the identified and alternative techniques.
Supervisors:
Dr.ir. J. Kraaijenbrink
Ir. B. Kijl
Keywords:
p
erformance measurement system implementation; performance measurement system
development; small and medium enterprises; balanced scorecard; emerging strategy;
bottom-up design
Permission to make digital or hard copies of all or part of this work for personal or classroom use is granted without fee provided that copies are not made or distributed for profit or commercial advantage and that copies bear this notice and the full citation on the first page. To copy otherwise, or republish, to post on servers or to redistribute to lists, requires prior specific permission and/or a fee.
5th IBA Bachelor Thesis Conference, July 2nd, 2015, Enschede, The Netherlands.
1. INTRODUCTION
One main obstacle for Performance Measurement Systems (PMS) implementation in Small and Medium Enterprises (SMEs) are non-formalized strategies, because the strategic rationalization loop, generally used in PMS development, cannot be used to translate strategy into measurable performances (Garengo & Biazzo, 2012). Formal and structured strategies have been classified as embedded into explicit management systems (Mangelsdorf, 1999). In addition it has been noted that one of the main barriers to organizational development in SMEs is the lack of a managerial systems and formalized management of the processes (Jennings and Beaver 1997; Marchini 1995; Martins & Salerno 1999). Garengo & Biazzo (2012) deal with this barrier by considering the cultural and structural particularities of SMEs and particularly take into account the non-formalized strategic processes of SMEs. Given that this methodology has only been validated in one case study there is a pressing need to substantiate the model through broader empirical evidence (Garengo & Biazzo, 2012). Garengo & Biazzo (2012) define the methodology as ‘circular’ to remark the contrast with the top-down logics. Therefore, this article refers to the methodology as ‘The Circular Methodology’. This article offers a contribution to research on PMS development in SME’s by refining and validating the Circular Methodology, in addition to producing general guidelines for using the
methodology. The research question is: How can small and medium sized enterprises overcome the obstacle of non-formalized strategic processes when developing performance management systems? This article presents the empirical findings using an action research approach reviewing, confirming, evaluating and validating the PMS methodology in a small manufacturer operating in the food sector, which does not have any formalized strategic processes but did show some willingness to formalize one. This article starts with a brief overview considering the current body of knowledge regarding PMS in SMEs. This overview includes a justification for choosing, refining and validating The Circular Methodology, together with a description of the model. Following is a justification and description of the action research method in addition to the research process in the light of the company. Lastly the results of the research process are presented, involving several guidelines and proposed improvements to The Circular Methodology.
2. LITERATURE REVIEW
Measuring organizational performance is necessary to monitor, measure and understand firm performance. As the rate of change accelerates and competition intensifies globally a company’s survival is dependent on how well it can position itself and how it optimizes its efforts (Pun & White, 2005; Sharma et al., 2005). Formal and structured strategies such as PMS help organizations position and optimize their efforts as results can be measured and assessed against predefined targets and directions, in order to make corrective actions (Pun & White, 2005; Olsen et al., 2005; Garengo, Biazzo & Bititci, 2005). PMS are balanced and dynamic systems that are able to support the decision-making process by gathering, elaborating and analyzing information (Neely et al. 2002).
In this article, SMEs are considered firms that fit the definition of being ‘‘Enterprises which employ fewer than 250 persons’’ (European Commission, 2015). PMS are particularly important in Small and Medium Enterprises (SME’s) for several reasons. Firstly, SMEs tend to have little formalized practices (Garengo et al., 2005) PMS address the need for more rationalization of management systems in order to deal with increasing complexity (Bernardi & Biazzo 2003; Marchini 1995; Martins
& Salerno 1999). Secondly, the evolution of the concept of quality and increased focus on continuous improvement, are addressed by PMS as results can be assessed against predefined targets in order to make corrective actions. Lastly, significant developments in information technology makes PMS require less manual labor and makes it easier to use (Garengo et al., 2005). However, even though the literature stresses the importance of PM in SME’s, few SME’s actually did implement a PMS. The main reason for the low levels of implementation is because a different approach to PMS in SMEs as compared to large firms is required (Garengo et al., 2005; Kraus et al., 2007; Hudson et al. 2001).
2.1. Characteristics of PMS within SMEs
Very little empirical and theoretical research hasbeen carried out on PMS in SMEs (Garengo & Biazzo, 2005). The following sections highlight the particularities of SMEs on itself and the practices found in relation to PMS as listed by Garengo & Biazzo (2005).
Managerial capacity. Managerial tools and techniques are often perceived as being of little benefit to the company (Garengo & Biazzo, 2005).
Limited capital resources. The impact of the resources needed to implement a PMS is proportionally more onerous in SMEs than in large companies (Barnes et al., 1998; Burns and Dewhurst 1996; Ghobadian and Gallear 1997; Hudson et al. 2000; Hvolby and Thorstenson 2000; Neely and Mills 1993; Noci 1995). There is a difficulty to involve SMEs in PMS projects because of the lack of time available for non-operational activities and the poor involvement of top management (Tenhunen et al. 2001). SMEs have limited resources for data analysis Data are gathered and analyzed in an imprecise way, and this non-formalized approach increases the ambiguity of the measurement objectives.
Reactive approach. SMEs are characterized by poor strategic planning and their decision- making processes are not formalized. The lack of explicit strategies andmethodologies to support the control process promotes both a short-term orientation and a reactive approach to managing the company’s activities (Brouthers et al. 1998; Marchini, 1995).
Tacit knowledge and little attention given to the formalization of processes. One of the main barriers to organizational development in SMEs is the lack of a managerial system and formalized management of the processes. Furthermore, since knowledge is mainly tacit and context-specific, the information required to implement and use a PMS is difficult to gather (Jennings and Beaver 1997; Marchini 1995; Martins and Salerno 1999). SME’s approach to PMS is informal, not planned and not based on a predefined model, therefore there is often a poor alignment between the strategy and measures (Addy et al.,1994; Chennell et al., 2000; CIMA 1993; Hudson et al. 1999).carefully understanding and analyzing the characteristics of the model and the company. This approach is incomplete and does not consider the specific needs of SMEs (CIMA 1993; Tenhunen et al. 2001). This means that when designing the PMS to the SME consequences of changes need to be carefully designed.
2.2. PMS Frameworks Developed for SMEs
Frameworks developed for organizations of any size have certain shortcomings that make it difficult to implement them in SMEs. The most important of these drawbacks is that they require substantial resources and a previously established level of organization that only large enterprises have. PMS
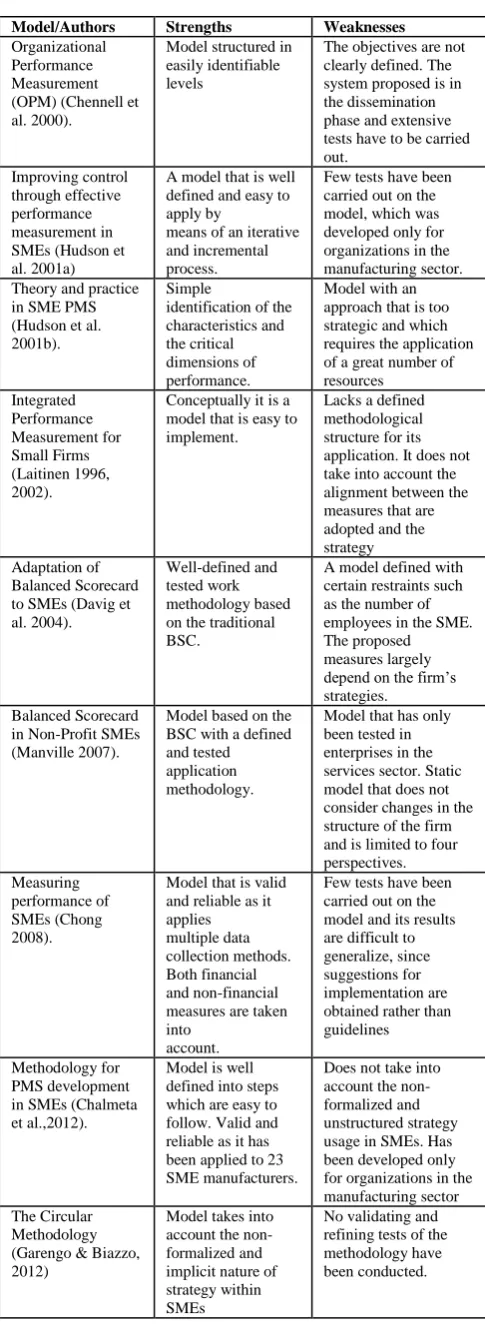
frameworks for SMEs attempt to overcome some of these weaknesses traditionally found in SMEs. The most important PMS frameworks and corresponding strengths and weaknesses for SMEs were listed by Taticchi et al. (2008), a more recent overview can found in Table 1.
Although these frameworks have been developed specifically for SMEs they are still few in number (Garengo et al. 2007; Cocca and Alberti 2009), all have certain limitations and in practice they have not proved to be completely satisfactory. Evidence of this can be seen in the gap that exists between theory and practice observed in SMEs by numerous authors (Hudson et al.2001b, Sousa et al. 2006). It can therefore be concluded that the development and implementation of PMS in SMEs is a complex affair that has still not been satisfactorily resolved by the approaches outlined above (Clameta et al, 2012). More specifically, the frameworks and methodologies based on SME particularities are still based on a hierarchical top-down approach (Lynch & Cross, 1991; Kaplan & Norton, 1992; Bititci, Carrie, & McDevitt, 1997; Ghalayini, Noble, & Crowe, 1997; Bourne, Mills, Wilcox, Neely, & Platts, 2000; Neely, Adams, & Kennerley, 2002). Meaning that the measures are identified by the mission and vision of the company and they are designed and tested in and for large companies. Contrarily SMEs often have a hard time rationalizing their operational practices and strategic processes, consider strategy as emerging and show little importance to formalizing their strategic choices (Garengo & Biazzo, 2012; Greatbanks and Boaden 1998). Therefore most of the developed methodologies are not designed to all the SME particularities, especially SMEs which have an non-formalized strategy and vision. Non-formalized strategies in SMEs are an obstacle for PMS adoption because the strategic rationalization loop cannot be used to translate strategy into measurable performances. Therefore it needs to reconstructed first(Garengo & Biazzo, 2012). In addition it has been mentioned that one of the main barriers to organizational development in SMEs is the lack of a managerial system and formalized management of the processes (Jennings and Beaver 1997; Marchini 1995; Martins and Salerno 1999).
Garengo & Biazzo’s (2012) Circular Methodology, is the only methodology that takes into account the non-formalized strategies that SMEs tend to have. The model uses a bottom-up approach, not starting with generic formulations of the vision but instead starts with the actual operational reality managed by individuals.
Model/Authors Strengths Weaknesses Organizational
Performance Measurement (OPM) (Chennell et al. 2000).
Model structured in easily identifiable levels
The objectives are not clearly defined. The system proposed is in the dissemination phase and extensive tests have to be carried out.
Improving control through effective performance measurement in SMEs (Hudson et al. 2001a)
A model that is well defined and easy to apply by
means of an iterative and incremental process.
Few tests have been carried out on the model, which was developed only for organizations in the manufacturing sector. Theory and practice
in SME PMS (Hudson et al. 2001b).
Simple
identification of the characteristics and the critical dimensions of performance.
Model with an approach that is too strategic and which requires the application of a great number of resources Integrated Performance Measurement for Small Firms (Laitinen 1996, 2002).
Conceptually it is a model that is easy to implement.
Lacks a defined methodological structure for its application. It does not take into account the alignment between the measures that are adopted and the strategy Adaptation of
Balanced Scorecard to SMEs (Davig et al. 2004).
Well-defined and tested work methodology based on the traditional BSC.
A model defined with certain restraints such as the number of employees in the SME. The proposed measures largely depend on the firm’s strategies.
Balanced Scorecard in Non-Profit SMEs (Manville 2007).
Model based on the BSC with a defined and tested application methodology.
Model that has only been tested in enterprises in the services sector. Static model that does not consider changes in the structure of the firm and is limited to four perspectives. Measuring
performance of SMEs (Chong 2008).
Model that is valid and reliable as it applies multiple data collection methods. Both financial and non-financial measures are taken into
account.
Few tests have been carried out on the model and its results are difficult to generalize, since suggestions for implementation are obtained rather than guidelines
Methodology for PMS development in SMEs (Chalmeta et al.,2012).
Model is well defined into steps which are easy to follow. Valid and reliable as it has been applied to 23 SME manufacturers.
Does not take into account the non-formalized and unstructured strategy usage in SMEs. Has been developed only for organizations in the manufacturing sector The Circular
Methodology (Garengo & Biazzo, 2012)
Model takes into account the non-formalized and implicit nature of strategy within SMEs
[image:3.595.304.547.64.732.2]No validating and refining tests of the methodology have been conducted.
2.3. Unveiling Strategy in SMEs: The
Circular Methodology
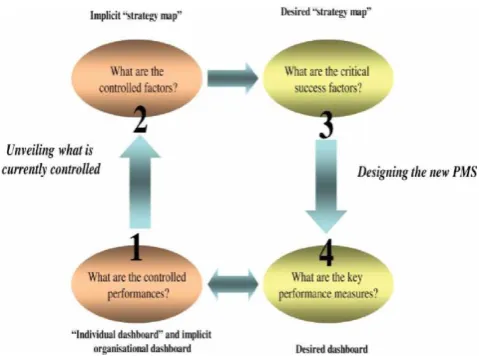
The circular methodology involves four stages through which SMEs can translate their individual dashboards performance measures, ultimately, to a desired dashboard with desired key performance indicators. The starting point does not feature the abstract and often generic formulations of strategic visions, because companies do not have them and have a hard time designing them. Contrarily, the starting point are the actual operations of single individuals, actually expressed in terms of performance measures that people use to manage their activities. In this methodology step 1 and 2 are about unveiling the what is regularly kept under control, and step 3 and 4 are about designing a desired or future strategy map and to translate that to measures and operations.
2.3.1. ‘‘Individual dashboard’’ and Implicit
organizational dashboard
This phase is about gathering performance information from individuals. The data gathering involves the results of the way things are being done now, thus the system currently used. The result are individual dashboards, which consists of all those performance measures that each person uses to assess the activities one is responsible for. After individual dashboards are gathered they can be combined into one implicit organizational dashboard, which is the synthesis of all individual dashboards.
2.3.2. Implicit ‘’strategy map’’
Here the organizational dashboard is used as the basis for the subsequent identification of the implicit strategy map. The idea is that from performances that are under control we can figure out what the Critical Success Factors (CSF), which hold up the currently pursued company strategy are. After the objectives or CSFs are identified the measured phenomena may be placed in the four classic perspectives of Balanced Scorecard (BSC): customer, internal processes, economic-financial and learning and growth perspectives. What emerges is the picture of the CSF that are kept under and control and that the company implicitly supports.
2.3.3. Desired ‘’strategy map’’
In this stage the future and desired strategy are designed from the implicit strategy map by eliminating non-strategic CSF and adding new strategy CSFs. Here the company can use the objectives as a starting point to create a new strategy. Management can more easily look at objectives to identify irrelevant and needed CSF than consider the total strategy. Here the facilitator should aggregate the measures at the
organizational level and shows them from each of the
perspective of the BSC in order to highlight the existing balance. The management here should work together to define all the desired strategic objectives necessary to synthesize the company’s competitive strategy.
2.3.4. Step 4. Desired Dashboard
[image:4.595.309.549.69.247.2]Here the company would translate the key performance indicators into measurements required to achieve the predefined objectives. The desired strategy map is the basis for the identification of performance measures that will make up the BSC. Each measure was documented as follows in order to create a dictionary of indicators: the reference perspective for each one was given; the objective translated; the formula used to calculate it; the frequency with which it was calculated; and if it was not already clear, the main meaning or implications of this measurement (Niven, 2002).
Figure 1. The Circular Methodology (Garengo & Biazzo, 2012).
This methodology seems to take into account all SME particularities, however it has only been validated in one case study. Therefore, there is a pressing need for further study to substantiate the model through broader empirical evidence (Garengo & Biazzo, 2012). This study validates the model in another context to confirm and refine the methodology and consider its generalizability.
3. RESEARCH DESIGN
benefits. In addition Tenhunen et al. (2001) mentioned that PMS in SMEs fail because of the poor involvement of top management. By working on its design and change management will likely be more involved and committed to PMS. Lastly it has been found that SMEs eliminate some dimensions without first carefully understanding and analyzing the characteristics of the model and the company. This
approach is incomplete and does not consider the specific needs of SMEs (CIMA, 1993; Tenhunen et al., 2001). This means that when designing the PMS to the SME consequences of changes need to be carefully considered, and understanding the process and change will likely help managers understand the changes made in PMS.
4. DATA COLLECTION & ANALYSIS
In line with Coughlan and Coghlan (2002), this article is divided into four main phases; initially, the company context and needs were analyzed; afterwards, data were collected and analyzed to support the development of PMS, the process was evaluated and the guidelines proposed emerged from interactive cycles of data gathering, feedback, analysis, implementation and evaluation. As the actual implementation of PMS falls outside the scope of this research, the article is concerned with learning from the development and application of The Circular Methodology. By going through the development process implications are gathered concerning the model’s viability in a different context as well as general guidelines for future practitioners and researchers. Action research is governed by constant and iterative reflections of both the researcher and the organization as part of the process of organizational change and improvement of the methodology. As a result various factors will be identified that will either hinder or support the implementation of the methodology. Used in order to understand the process of change with a view to replication at another time, another setting. In addition improvements to the model will be suggested to deal with the factors that hinder the model’s implementation.
The methodology for unveiling the strategy of SMEs has been used to develop a PMS in a small manufacturer operating in the
food sector. The company van der Moolen Foodgroup was founded in 1966 to produce noodles using an authentic recipe. In addition to producing noodles the company nowadays imports and sells rice and pasta. The company did never explicitly formulated a vision, mission or strategy and the strategic process was rather intuitively and spontaneous. Therefore, the firm’s strategy usage could be classified as non-formalized, unstructured and mainly emerging. The managing director was particularly concerned with reducing risks and continuous improvements to ensure the company’s future existence. Formal strategy usage was never considered as particularly important but an unforeseen event where one of the principals got chronically ill caused the company to be more aware of the risks, and increased the desire to formalize operations and strategic processes. Since The Circular Methodology is particularly developed for SMEs with unformalized strategy processes, the company never did considered strategy as particularly important and in addition, the traditional rationalization loop could not be used, the organizational context was deemed suitable for testing and refining the methodology. Data was gathered through interviews, discussion and meetings with organizational members and in particular the managing director.
5. RESULTS
By using action research and through learning from the process through the reflective cycle the notions listed in Table 2 have been made. The table consists out of the summarized findings, it is described, firstly what is prescribed. Secondly what the obstacle was, if any. Thirdly, what the implications are and how the model can be improved.
Only remarkable findings considering the methodology have been noted, if nothing is noted it can be assumed that the execution was in accordance with the prescription. The sections include the more extensively described research process and results.
Methodology Prescription Findings/Obstacle in organizational
context Implication/Improvements
Step 1.
Start with interviewing individuals concerning performance measures
No planning of this or other stages of the project.
Explicitly stating the planning phase to let the remainder of the project run more smoothly and to omit some of the obstacles typically found in SMEs
Collect information concerning the operational reality
Difficulty of gathering the information from employees due to the high amount of tacit knowledge and the non-formalized practices
Therefore, questions were asked regarding the current and desired strategy. Need for alternative techniques to overcome the tacit knowledge.
Visualization of the performance measures to highlight ‘imbalances’ concerning the BSC
Incomplete performance information concerning the operational reality was found, therefore imbalances are assumed.
It was still helpful as information gaps could be expressed more easily while discussing a specific business function as compared to posing generic questions
the ‘’individual dashboard and the implicit
‘’organizational dashboard’’ are described together as one step
The sub-steps are essentially different. Individual dashboard is about gathering information, whereas organizational dashboard is about analyzing and synthesizing this information.
Divide the step into two sub-steps.
Step 2.
re-examining and summarize the answers on the question ‘what is it useful for/to whom/how?
In order to examine and summarize the answers the questions should be asked in the first step
Create an implicit strategy map
The implicit strategy map did not show exact relationship or what the key drivers of the CSF were.
To identify the strategic priorities of the company, and the drivers to better understand processes and be able to focus on performance drivers, a relationship diagram was created.
Step 3.
Eliminate non-strategic CSFs and add CSFs in order to create the desired strategy map.
No prescription on how this can be done. Guidelines are missing. A desired dashboard essentially consists out of more than the implicit strategy.
Ideas and visions are needed and therefore a desired strategy should be formulated.
Step 4.
Bottom- up approach This approach positively affects the strategy formulation process as well as the desired dashboard design process because the constrains and affordances are known.
[image:6.595.48.544.71.225.2]It reduces the need for adjusting the performance measures and strategy in a later stage. It matches so to say the operational reality with the desired strategy.
Table 2. Methodology prescription in relation to findings and respective implications/improvements
5.1. ‘‘Individual Dashboard’’ and
Implicit Organizational Dashboard
5.1.1. Planning Stage
The first step is about gathering data from individuals through interviews. The obstacle found here was that first an agreement and planning should be made in order to conduct the interviews. All parties should know what to prepare in order to start the PMS development process. Project planning is a necessary step for project
development without planning it the project will not run smoothly or will not run at all. For this reason it seems unlikely that Garengo & Biazzo skipped this step, assumedly the step has been considered self-explanatory. In order to overcome this obstacle the author of this article pledges for explicitly stating the orientation/planning step. If this step is added researchers and practitioners can provide guidelines in improving this step. Moreover an orientation phase can overcome some of the obstacles typically found during PMS implementation in SMEs (Chalmeta et al., 2012). For this reason Chalmeta et al. (2012) explicitly mention this step in their PMS methodology. In their planning phase the project is planned, the methodology is explained and the facilitator attempts to gain organizational support for the approach. Essentially both upper and middle management should be involved in the project, however involving employees and line manager will increase their commitment to the system. Here the facilitator should present the PMS to the
management, based on the basic points of a PMS project and, at the same time, the methodology that was going to be used was also explained to them. After this the project needs to be planned and structured. This involved defining its scope and its schedule in terms of time, workloads and capacities and defining the roles and commitment of the management.. As argued by Clameta et al. (2012) this methodological approach enabled the executives in the SME to quickly understand (1) the scope of the PMS project; (2) the applicability of the methodology to their company; (3) the potential benefits deriving from its application, which could offer a solution to the shortages identified earlier; (4) the activities they would have to collaborate in; (5) the amount, as well as the level, of the resources that should be assigned to the PMS project and (6) the impact that the project would have on their organization. Thanks to this phase Chalmeta et al. (2012) found it was possible to overcome some obstacles identified in PMS implementation in SMEs, such as; lack of support and guidelines from management; lack of understanding of the concept of PMS; unawareness of the
potential advantages of PMS and unawareness of a suitable methodology for implementing PMS in the SME. In addition, the planning phase has been found to let the remainder of the project run more smoothly. Therefore, this article pledges for a similar methodological approach.
5.1.2. Tacit Knowledge & Non-Formalized
Practices
was a pressing need to identify CSF using an alternative approach. Therefore, it was asked ’’what is the current (implicit) strategy of the company?’’ and ‘’what strategy do you think the company should pursue?’’. Both questions were asked with respect to the competitive advantage of the strategy, since this would identify CSF needed for later stages in the methodology. In addition respondents were encouraged to respond to both the organisational wide strategy as well as the local and operational strategy. Both employees and management showed no difficulty answering these questions and it revealed significant input for the organisational strategy. This information was later used in the desired strategy map as it showed the competitive advantage and thus the CSF for the company to focus on. In fact by analyzing and summarizing the answers several CSF were already identified, before synthesising the performance measures. In fact employees mentioned additional CSF not mentioned by the management, such as flexibility in production, customer trust and rapid internal communication.
5.1.3. ‘Imbalances’ Balanced Scorecard
As the information concerning performance measures is gathered it is prescribed to visualize the information by subdividing the indicators into the four BSC perspectives in order to highlight existing ‘vertical imbalances’ as well as ‘horizontal imbalances’ concerning the BSC. Even though the information concerning the operational reality was assumed to be incomplete, because evident business functions lacked indicators, the imbalances were still analysed and examined. As the information was incomplete this logically resulted in multiple imbalances. However, despite the incomplete information, analysing and discussing these imbalances with the management was still considered a useful practice. Since the imbalances pointed out specific performance measures missing, the management was able to indicate whether the performance measure was actually missing or whether was just left unexpressed. It was found that asking directly whether a certain indicator was evident was much easier to express for organisational members than the generic question of ‘what do you control’. For instance it was found out that during this analysis and discussion that there were in fact metrics used for purchasing and customer satisfaction which were left unexpressed in the interviews conducted in the first step.5.1.4. Separate Steps
In the methodology the ‘’individual dashboard and the implicit ‘’organisational dashboard’’ are described together as one step. This did not cause any complications on itself, however it would be more clear and easier to follow through the methodology if these steps would be separated because they are essentially different practices and their order is subsequently. The first is about gathering data and the later is about analyzing and examining this data. To clarify the model this article pledges for separating the step into two separate steps, namely the individual dashboard and the implicit organizational dashboard.
5.2. Implicit ‘’Strategy Map’’
5.2.1. Omit Conducting Two Interviews
In the second stage it is prescribed that the reasons why each interviewee was using a certain measure has to be made clear by re-examining and summarizing the answerson the question ‘what is it useful for/to whom/how?’. However it was found this question is not included in the first stage. Therefore, to omit having to conduct two separate interviews these questions should be added into the first stage.
5.2.2. Relationship Diagram
In this stage an implicit strategy map is created. Therefore it has to be made clear why individuals used a certain measure, because this somehow represents the strategic objectives of the company. This strategy map was created without complications. However, the implicit strategy map did not show exact relationship or what the key drivers of the CSF were, since it only shows broad causal
relationships between the CSFs. To identify the strategic priorities of the company and the drivers, to better understand processes and be able to focus on performance drivers that result in the strategic objectives for the desired strategy map, there was a need to analyze the causal relationships in greater detail. As a result a relationship diagram was created. As the strategy map is used as an input for the strategy development the relationship diagram could additionally be used as it shows the key drivers of the company’s objectives in greater detail.
5.3. Desired ‘’Strategy Map’’
any new directions or to revise the strategy. Some ideas, visions or thoughts must be present in order to change from what is currently going on. For that reason a desired strategy, based on the implicit strategy, was developed. The respective formulation in turn aided the development of principles and priorities in the elimination of non- strategic and identification of new CSFs. In order to overcome confusion and make the methodology easier to follow through especially during the identification and elimination of CSF it should be explicitly stated that a strategy formulation phase is included in this stage.
5.4. Desired Dashboard
In the last phase the CSFs are translated to measurable performances. During this and previous steps it was found that the methodological benefits of starting bottom-up are twofold. Firstly, as mentioned in the article, understanding and studying the currently so-called implicit strategy is offers a great contribution to the desired strategy formulation. Even though the company did not have a formalized and explicit strategy did not mean they do not pursue a strategy all. The desired strategy can for a great deal consist out of the emerged and non-formalized strategy. In addition new CSF can be identified by analyzing and synthesizing the CSF currently under control. For example, by doing this it was found that the company had a differentiation strategy, using customer relationship and quality. This overall focus served as a guideline and focus for new CSFs identification that would enhance the differentiation strategy. The new CSFs identified were ‘stimulation of the desired organizational culture’ and ‘focus on marketing and profiling’. Both in accordance with the CSFs already under control,
enhancing the overall strategic advantages of the company. Secondly the methodological approach is helpful since a more feasible desired dashboard can be designed.
Generally, the feasibility of the strategy is contingent upon the constraining and aiding factors encountered while implementing the strategy in practice (Leonardi, 2015). Since the operations are studies and understood the constraining and aiding factors are also understood when designing performance measures. For instance, during the first step it was found that the employees the operations were highly flexible and were largely based on the level of urgency and an accumulation of monitoring needs that arise. Generally a lot of individual responsibilities overlapped with each other. A lot of people were not responsible for one indicator but were responsible for multiple indicators and shared this responsibility with multiple other employees within the company. Logically, one would think that in order to increase the ability to control individuals there is a need to assign clear responsibilities. By doing this the management can hold employees responsible and assess performance against predefined targets. However, the identified flexibility was, as considered by organizational members, a competitive advantage as it reduces the reliance on one organizational member and increases the ability of the organization to quickly respond to specific customer needs. This pressed the need to discuss this issue with the management, and they also considered this flexibility as a competitive advantage. As a result it was decided that ,when translating the desired strategy map into measurable performances, employees should still have shared responsibilities. This example illustrates that by first analyzing the operational reality the facilitator can take into account the operational reality during the design of
the desired dashboard. In other words the constraining and aiding factors are understood which in turn increases the feasibility of the strategy. In sum, understanding the current operations positively affects both the strategy formulation process as well as designing the desired performance measures.
6. DISCUSSION
6.1. Conclusion
This article offers a contribution to research on PMS development in SME’s by refining and validating the Circular Methodology. The Circular Methodology is the first methodology to take into account the non-formalized strategic processes typically found in SMEs. The most severe obstacle found when implementing the
methodology are the non-formalized strategic processes together with the high amount of tacit knowledge. These particularities limit the ease of data gathering in the first stage, which in turn form the basis for the remaining stages. Both are not limited to this organizational context and are particularities of SMEs. Even though the perceived difficulty of identifying individual performance measures studying and understanding the current operations positively affected the strategy formulation process as well as the desired dashboard design process. This is because the constrains and affordances were known and understood. As a result, the nature of this methodology will make it less likely that unfeasible generic strategy or performance measures are formulated and implemented. The starting point of this methodology is bottom-up and this created significant input for the strategy formulation process, however it was found that some top-down generic vision is still necessary to prioritize and identify CSFs. Moreover, basing the desired strategy solely on the implicit strategy will result in a similar or limited version of the implicit strategy, for a new direction and strategic change a vision is essential. Therefore, in order to improve the feasibility of the methodology alternative techniques to overcome the tactic knowledge and non-formalized practices should be identified and tested. In addition strategy formulation processes should be included to make this stage easier to deal with.
6.2. Scientific Implications
In order to overcome non-formalized strategy usage, generally considered an obstacle to PMS implementation within SMEs’, the Circular Methodology has been developed by Garengo & Biazzo (2012). This paper does not consider the usefulness of the PMS after its
context (Jennings and Beaver 1997; Marchini 1995; Martins and Salerno 1999). Therefore there is a pressing need to for additional techniques to unveil the strategy in the case of tacit knowledge and non-formalized practices. One mean to overcome this obstacle is conducting interviews asking directly about the current and desired strategy. This seemed to be successful as it provided valuable input for the remaining stages. Even though the perceived difficulty of identifying individual performance measures the methodology could still be used if there is a difficulty gathering the individual performance measures. The methodological nature of Garengo & Biazzo’s (2012) bottom-up approach was found to have two benefits. Firstly, studying and understanding the current operations positively affected the strategy formulation process as well as the desired dashboard design process because the constrains and affordances were known and understood. As a result, the nature of this methodology will make it less likely that unfeasible generic strategy or performance measures are formulated and implemented. Secondly, the information gathered considering the operational reality and emergent strategy created significant input for the strategy formulation process. These methodological benefits can be of useful to research not limited to PMS or SMEs in particular. The bottom-up approach can be useful in a broader context even in organizations who do not have a problem with top-down generic vision since the strategy formulation stage is enhanced and a more feasible strategy is formulated. However even though the nature of the research offered substantial input for the strategy formulation process it was found that some top-down generic vision was still necessary to prioritize and identify CSFs. Since basing the desired strategy solely on the implicit strategy will result in a similar or limited version of the implicit strategy, for a new direction and strategic change a vision is essential. Because this methodology should contain a strategy formulation phase the methodology should be complemented with several strategy formulation techniques. Therefore, such a stage should be explicitly stated.
6.3. Implications for Practice
Several guidelines obstacles and improvements have been identified for The Circular Methodology in order for SMEs to more smoothly implement a PMS. As the methodology is tested through broader empirical research lessons are learned through the implementation of the methodology, which prevents other SME’s dealing with some of the obstacles found. Now SME’s can anticipate on these obstacles and can overcome them without encountering them. The author shows how in a situation with tacit knowledge and non-formalized practices the methodology could still be implemented. However, in order to more successfully implement the methodology these SME’s particularities should not be present or the company should be able omit them, using techniques used in this article.
6.4. Limitations & Future Research
Considering the nature of the research method data gathering consists out of ‘’soft data’’ solely, observation, discussion and interviewing. The limitation of this approach is that the data are largely perceptual and may be difficult to interpret validly and thus may be limited by subjectivity. Furthermore, this study is limited by its timeframe. Therefore, the practical usefulness after the implementation of the methodology is not considered. It is
not clear if the PMS developed had a positive impact on the company performance.
The usefulness of the methodology needs to be linked to contextual factors that help to understand to what extent this methodology and this study might be transferable to other contexts. Firstly, the entire process was monitored by an external facilitator who supported the company throughout the implementation process. Secondly, the management were involved in the project and there was great collaboration between the facilitator and the management. The parties worked together through the stages and any obstacle found was discussed and aimed to overcome. The management understood the organizational context to a greater extent and the facilitator understood The Circular Methodology and PMS to a greater extent. Through discussion and implementation this knowledge was combined to develop The Circular Methodology in the organization. Thirdly, the company had non-formalized strategic processes and practices. Did never formulate an explicit strategy, and its operations were mainly a product of emerging needs.
In order to aid the implementation of the methodology for future research the following aspects should be studied and tested. Firstly, tacit knowledge and non-formalized practices remain a particularity of SMEs that this methodology is not able to overcome. Techniques and methods to overcome this particularity should therefore be identified and tested in respect to the methodology. Secondly, during the desired strategy map stage it was found that a strategy formulation process is necessary. Different strategy formulations techniques, that can be used on itself or that can exploit the information gathered from the implicit strategy, should be identified and tested in respect to The Circular Methodology. Thirdly, in order to further substantiate this methodology there is a need to generalize these conclusions and the methodology through broader empirical research. Fifthly, the practical
usefulness of the methodology needs to be evaluated some period after its development and implementation. It should be considered what the benefits and limitations are after the methodology implementation and how these respective limitations can be overcome while using The Circular Methodology. Lastly, the methodological bottom-up nature created significant input for strategy formulation processes. The benefits studying the emergent strategy should be studied in a context not limited to SMEs or PMS. A bottom-up approach is possibly feasible for PMS development in general and strategy formulation processes at large enterprises.
8. ACKNOWLEDGMENTS
The author acknowledge with gratitude the active help and collaboration from Van der Moolen Foodgroup. A special thanks to the managing director, Peter Van der Moolen and the university supervisor Jeroen Kraaijenbrink.
9. REFERENCES
Addy, C., Pearce, J. and Bennett, J. (1994). Performance measures in small manufacturing enterprises: are firms measuring what matters? In Proceeding of the 10th National Conference on Manufacturing Research. Loughborough, UK, 13– 15 September
medium enterprises. In Proceedings of the Performance Measurement – Theory and Practice Conference, Cambridge, 14–17 July.
Bernardi, G. & Biazzo, S. (2003). Organizzazione e processi: un modello di intervento, in SIAV, Competenze per lo sviluppo: la relazione tra organizzazione e processi nelle PMI. Milan: Franco Angeli.
Bititci, U., Carrie, A., & McDevitt, L. (1997). Integrated performance measurement systems: A development guide. International Journal of Operations & Production
Management, 17(5), 522–534.
Bourne, M., Mills, J., Wilcox, M., Neely, A., & Platts, K. (2000). Designing, implementing and updating
performance measurement systems. International Journal of Operation and Production Management, 20(7), 754– 771.
Bourne, M., Neely, A., Platts, K. and Mills, J. (2002). The success and failure of performance measurement
initiatives – perceptions of participating managers. International Journal of Operations and Production Management, 22, 1288–1310 Brouthers, K., Andriessen, F. and Nicolaes, I. (1998). Driving blind: strategic decision-making in small companies. Long Range Planning, 31, 130– 138.
Burns, P. and Dewhurst, J. (1996). Small Business and Entrepreneurship. London: Macmillan
Chalmeta, R., Palomero, S. & Matilla, M., (2012). Methodology to develop a performance measurement system in small and medium-sized enterprises. Vol. 25, No. 8, August 2012, 716–740
Chennell, A., Dransfield, S., Field, J., Fisher, N., Saunders, I. & Shaw, D. (2000). OPM: a system for organisational performance measurement. In Proceedings of the Performance Measurement – Past, Present and Future Conference, Cambridge, 19–21 July.
Chong, H. G. (2008). Measuring performance of small-and-medium sized enterprises: the grounded theory approach. Journal of Business and Public Affairs, 2(1), 1-10.
CIMA (1993). Performance Measurement in the Manufacturing Sector. London: CIMA
Cocca, P., & Alberti, M., 2009. A framework to assess performance measurement systems in SMEs. International Journal of Productivity and Performance Management, 59 (2), 186–200.
Coda, V., & Mollona, E. (2006). Dynamics of strategy: A feedback approach to corporate strategy making. In G. Minati, E. Pessa, & M. Abram (Eds.), systemics of emergence: Research and development. (pp. 463-494). New York, NY: Springer
Coghlan, P., & Brannick, T. (2010). Doing action research in your own organization. London: Sage.
Coughlan, P. & Coghlan, D. (2002) Action research for operations management. International Journal of
Operations and Production Management, 22 (2) (2002), pp. 220–240
Coughlan, P., & Coghlan, D. (2002). Action research for operations management. International Journal of Operations & Production Management, 22(2), 230-240
Davig, W., Elbert, N., & Brown, S. (2004). Implementing a strategic planning model for small manufacturing firms: an adaptation of the balanced scorecard.SAM Advanced Management Journal, 69(1), 18.
Eden, C., & Huxham, C. (1996). Action research for management research. Britisch Journal of Mangement, 7(1), 75-86.
European Commission, (2015). What is an SME? - Small and medium sized enterprises (SME) - Enterprise and Industry. Retrieved from
http://ec.europa.eu/enterprise/policies/sme/facts-figures-analysis/sme-definition/
Manville, G., (2007) "Implementing a balanced scorecard framework in a not for profit SME", International Journal of Productivity and Performance Management, Vol. 56 Iss: 2, pp.162 – 169
Garengo, P. & Biazzo, S. , (2012). Unveiling strategy in SMEs through balanced scorecard implementation: A circular methodology. Total Quality Management & Business Excellence. Jan2012, Vol. 23 Issue 1, p79-102. 24p.
Garengo, P., Biazzo, S. & Bititci, U.S., (2005).
Performance measurement systems in SMEs: A review for a research agenda. international Journal of Management Reviews . 7 (1), pp.pp. 25–47
Garengo, P., Biazzo, S., & Bernardi, G., (2007). Design and implementing a performance measurement system in SMEs: a bottom up approach. In: Paper presented at the 14th international annual EurOMA conference managing operations in expanding Europe, 17–20 June, Ankara, Turkey. Brussels, Belgium: European Operations Management Association.
Ghalayini, A., Noble, J., & Crowe, T. (1997). An integrated dynamic performance measurement system for improving manufacturing competitiveness. International Journal of Production Economics, 48(3), 207–225.
Ghobadian, A. and Gallear, D. (1997). TQM and organisation size. International Journal of Operations and Production Management, 17, 121– 163.
Greatbanks, R. & Boaden, R. (1998). Can SMEs afford to measure performance? In Proceedings of the Performance Measurement – Theory and Practice Conference, Cambridge, 14–17 July.
Hudson, M., Bennett, J., Smart, P.A. and Bourne, M. (1999). Performance measurement for planning and control in SMEs. In Proceedings of the Advances in Production Management Systems Conference – Global Production Management, Berlin, 6–10 September.
of Performance Measurement – Past, Present and Future Conference, Cambridge, 19–21 July
Hudson, M., Lean, J., Smart, P.A. (2001a) Improving control through effective performance measurement in SME. Production Planning & Control Vol. 12 Issue8.
Hudson, M., Smart, P.A. & Bourne, M. (2001b). Theory and practice in SME performance measurement systems. International Journal of Operations and Production Management, 21, 1096–1116.
Hussein, M., Gunasekaran, A. and Laitinen, E.K. (1998). Management accounting system in Finish service firms. Technovation, 18, 57–67.
Hvolby, H-H. and Thorstenson, A. (2000). Performance measurement in small and medium-sized enterprises. In Proceeding of the International Conference on Stimulating Manufacturing Excellence in SMEs. Coventry, 17–19 April.
Jennings, P., & Beaver, G. (1997). The performance and competitive advantage of small firms: A management perspective. International Small Business Journal, 15(2), 34–58.
Kaplan, R.S. & Norton, D.P. (1992). The balanced scorecard – measures that drive performance. Harvard Business Review, 70, 71–79.
Kraus, S. B., Reiche, S & Reschke, C. H., (2007). Implications of Strategic in SME's For International Entrepreneurship Research and Practice. , Energizing Management through Innovation and Entrepreneurship: European Research and Practice, pp. 110-127. London: Routledge.
Laitinen, E. (1996). Framework for small business performance measurement: towards integrated PM system. Research Papers of the University of Vaasa, Finland
Leonardi, P. M. (2015), Materializing Strategy: The Blurry Line between Strategy Formulation and Strategy Implementation. British Journal of Management, 26: S17– S21. doi: 10.1111/1467-8551. Lynch, R.L., & Cross, K.F. (1991). Measure up – the essential guide to measuring business performance. London: Mandarin.
Mangelsdorf, D., (1999). ‘Evolution from Quality Management to an Integrative Management System Based on TQM and Its Impact on the Profession of Quality Managers in Industry’, The TQM Magazine 11(6), 419– 425.
Marchini, I. (1995). Il governo della piccola impresa, vol. 3 – La gestione delle funzioni, Genova: ASPI/INS-EDIT.
Martins, R.A. & Salerno, M.S. (1999). Use of new performance measurement system, some empirical findings. In Managing Operations Networks – VI International EurOMA Conference, Venice, Italy, 7–8 June.
McAdam, R. (2000). Quality models in an SME context. International Journal of Quality and Reliability
Management, 17, 305–323.
Mintzberg, H. (1978). Patterns in strategy formation. Management Science, 24(9), 934-948.
Mintzberg, H., & Waters, J.A. (1985). Of strategies, deliberate and emergent. Strategic Management Journal, 6(3), 257-272.
Neely, A., Adams, C. and Kennerley, M. (2002). The Performance Prism: the Scorecard for Measuring and Managing Stakeholder Relationship. London: Prentice Hall.
Neely, A.D. and Mills, J.F. (1993). Manufacturing in the UK – Report on a Survey of Performance Measurement and Strategy Issue in UK Manufacturing Companies. London: Manufacturing Engineering Group.
Niven, P.R. (2002). Balanced scorecard step by step: Maximizing performance and maintaining results. New York, NY: John Wiley & Sons
Noci, G. (1995). Accounting and non-accounting based measures of quality-based performances in small firms. International Journal of Operations and Production Management, 15, 78–106
Olsen, E.M., Slater, S.F., Hult, T.M., (2005). “The importance of structure and process to strategy implementation”, Business Horizons 48, 47-54
Pun, K. F., & White, A. S. (2005). A performance measurement paradigm for integrating strategy formulation: A review of systems and frameworks. International journal of management reviews, 7(1), 49-71.
Schein, E.H. (1987). The clinical perspective of fieldwork, (p. 72). Newbury Park, CA: Sage Publications.
Sharma, M. K., Bhagwat, R., & Dangayach, G. S. (2005). Practice of performance measurement: Experience from Indian SMEs. International Journal of Globalization and Small Business, 1(2), 183–213.
Sousa, S., Aspinwall, E., & Rodrigues, A., (2006). Performance measurement in English small and medium enterprises: survey results. Benchmarking: An
International Journal, 13 (1/2), 120–134.
Taticchi, P., Cagnazzo, L., & Botarelli, M., (2008). Performance measurement and management (PMM) for SMEs: a literature review and a reference framework for PMM design. In: Paper presented at the 19th POMS annual conference, 9–12 May, La Jolla, CA. Miami, FL: Production and Operations Management Society.
Tenhunen, J., Rantanen, H. & Ukko, J. (2001). SME-oriented Implementation of a Performance Measurement System. Lahti, Finland: Department of Industrial Engineering and Management, Lap- peenranta University of Technology.