Abstract— This paper presents a technique for Person authentication using face detection. A skin color based technique is used for detecting frontal human face from the input image. The visual features namely Profile Fourier Coefficients (PFC) are then extracted using template matching. Using Principal Component Analysis (PCA), the extracted features are projected into one-dimensional subspace. This approach preserves the Euclidean structure of face subspace that contains the local information. The projected face image is recognized using K nearest neighbor (KNN) classifier. This method is better and efficient than other existing methods due to its reduced error rate. It works for images taken under various lighting conditions and is also independent of the image type and resolution. The proposed Detection and Recognition algorithm (DR) can detect multiple faces of different sizes with a wide variety of facial variations. Further, the algorithm can detect both dark skin-tone and bright skin-tone because of the nonlinear transform of the Cb-Cr color space.
Index Terms— Euclidean space, face detection, k nearest neighbor classifier, Principal Component Analysis, Profile Fourier Coefficients.
I. INTRODUCTION
Person authentication involves verification of a person’s identity based on his/her physiological or behavioral characteristics. Image processing is a form of signal processing for which the input is an image, such as photographs or frames of video, the output of image processing [3] can be either an image or a set of characteristics or parameters related to the image. Most image-processing techniques involve treating the image as a two-dimensional signal and applying standard signal-processing techniques to it. Face detection procedure determines the locations and sizes of human faces in arbitrary (digital) images. It detects facial features and ignores anything else, such as buildings, trees and bodies. Face detection can be regarded as a more general case of face localization. In face localization, the task is to find the locations and sizes of a known number of faces (usually one). In face detection, one does not have this additional information.
A complete pattern recognition system consists of: i) a sensor that gathers the observations to be classified or described, ii) a feature extraction mechanism that computes numeric or symbolic information from the observations, iii) a classification or description scheme that does the actual job of classifying or describing observations, based on the extracted features. The classification or description scheme usually uses one of the following approaches: statistical (or decision theoretic), syntactic (or structural)[4].
Many face recognition techniques [2], [5], [11], [12] have been studied; one of the most recently used techniques is the appearance-based method. In general, a face image of size n x m pixels is represented as a vector in an n x 1 dimensional space. This leads one to consider methods of dimensionality reduction that allows one to represent the data in a lower dimensional space. Take the following typical cases: a face recognition system based on n x m gray scale images which, by row concatenation, can be transformed into n dimensional real vectors. In practice, one could have images of m = n = 256, or 65536-dimensional vectors used as the classification system, the number would be exceedingly large memory for the entire training database. Therefore dimensionality reduction is essential. In practical situations, when n is prohibitively large, one is often forced to use linear techniques [4]. Consequently, projective maps [1] have been the subject of considerable investigation [6].
Eigenface [7] method is the most popular linear techniques for face recognition. Eigenface applies Principal Component Analysis (PCA) to project the data points along the directions of maximal variances. Eigenface method is unsupervised, ability to learn and later recognize new faces. There is another popular technique, Linear Discriminant Analysis (LDA) which is a supervised algorithm and this approach projects the face images along the directions optimal for discrimination. But the eigenface is better because it provides for the ability to learn and later recognize new faces in an unsupervised manner.
KNN classifier is best suited for classifying persons based on their images due to its lesser execution time and better accuracy than other commonly used methods which include Hidden Markov Model and kernel method
.
Although methods like SVM and Adaboost Algorithm are proved to be more accurate than KNN classifier, KNN classifier has a faster execution time and is dominant than SVM in sparse datasets [8].Person Authentication Using Face Detection
1
V
.Vaidehi,
2S.Vasuhi, R.Kayalvizhi, K.Mariammal,
3Raghuraman.M.B,
4Sundara Raman.V,
5
Meenakshi.L,
6Anupriyadharshini.V,
7Thangamani.T
Manuscript received Jul 12, 2008.
V.Vaidehi and S.Vasuhi, R.Kayalvizhi are faculty and K.Mariammal, Raghuraman.M.B, Sundara Raman.V, Meenakshi.L, Anupriyadharshini.V, Thangamani.T are students of Department of Electronics Engineering, Madras Institute of Technology, Anna University, Chennai, Tamil Nadu, India
II. FACE DETECTION
A face detection algorithm for colour images in the presence of varying lighting conditions as well as complex backgrounds is proposed. In this work, a skin color based technique is used for detecting frontal human faces in images where they appear. The method consists of two image processing steps. First, skin regions are separated from non-skin regions. Then locate the frontal human face within the skin regions. In the first step, a chroma chart is obtained that shows likelihoods of skin colors. This chroma chart is used to generate a gray scale image from the original color image [10]. This image has the property that the gray value at a pixel shows the likelihood of that pixel representing the skin. The gray scale image is segmented, to separate skin regions from non skin regions [13]. The luminance component is used, together with template matching to determine if a given skin region represents a frontal human face or not.
A. Algorithm
The input RGB image is converted into YCbCr color space. The Cb and Cr part are then extracted separately using the equations given below [9]:
r = R/(R+G+B) (1)
b = B/(R+G+B) (2)
From the Gaussian fitted skin color model of the input Fig. the likelihood of skin is computed using the equation .
Likelihood=P(r, b) =exp [-0.5(x-m)T C-1(x-m)] (3)
Where x=(r, b) T
m =mean of x. C=Covariance of x.
The grayscale image of the figure is then obtained, highlighting the skin regions. Using adaptive threshold, skin regions are highlighted effectively. The face is then located from the skin like segments by finding the number of holes in the skin regions using the following equations
E = Cc – H (4)
E: is the Euler number
Cc: The number of connected components H: The number of holes in a region.
H = 1 – E (5)
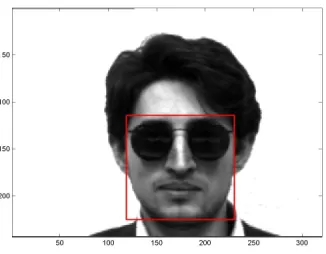
The template face is then resized according to the height and width of the region computed and also oriented accordingly. Thus by template matching a rectangle is drawn for the detected face boundary which is shown in Fig.1.
The PFC is obtained by taking Fourier transform of the detected face region. This detected face image is used for recognition.
50 100 150 200 250 300
50
100
150
200
Fig.1. The Boundary indicating the detected face
III. FACE RECOGNITION
The detected features are reduced in dimension using any dimensionality reduction technique and classified using a KNN classifier. The images of faces do not change radically when projected into face space, while the projection of non-face images changes radically. The background can significantly affect the recognition performance, because Eigenface analysis does not distinguish the face from the rest of image. The luminance and chrominance part is removed of the RGB image is which is given as input and thus overcoming the above mentioned problem. The Eigenface[7] method is the most popular linear technique for face recognition. Eigenface applies Principal Component Analysis (PCA) to project the data points along the directions of maximal variances.
A. PCA Projection
Principal Components Analysis is a method that reduces data dimensionality by performing a covariance analysis between subjects. As such, it is suitable for data sets in multiple dimensions [1].
PCA projection involves the following steps.
1. Arrange the data as a set of n column vectors x1, x2, xn, each
of which has m rows. Place the column vectors into a single matrix X of dimensions m x n.
2. Calculate the empirical mean along each dimension M=1…m and place the mean values into an empirical mean vector u of dimensions m x 1.
n
U[m] = (1/n) ∑ X[ M, N] (6)
N=1
3. Calculate the deviations (Dev) of the data matrix Χ from the mean vector u,
Dev = X – u . h (7)
where h[N] = 1,for N = 1…n . N: Feature vector
4. Calculate the m x m covariance matrix C from the outer product of matrix B with itself,
C = E [ Dev × Dev] = E [ Dev . Dev* ] = (1/n) Dev . Dev*(8)
5. Compute the matrix V of eigenvectors of the covariance matrix C,
V-1CV = D, (9) Where D is the diagonal matrix of eigen values of C.
Matrix D will take the form of an m x m diagonal matrix, where
D[p,q] =λm for p = q = m (10)
λm is the mth eigen value of the covariance matrix C, and matrix
V, also of dimension m x m, contains m column vectors, each of length m, which represent the m eigenvectors of the covariance matrix C. The eigenvalues and eigenvectors are ordered and paired. The mth eigenvalue corresponds to the mth eigenvector.
If the data is concentrated in a linear subspace, this provides a way to compress data without losing much information and simplifying the representation. By picking the eigenvectors [1] having the largest eigenvalues, there is a chance of losing some information. A fixed number of eigenvectors and their respective eigenvalues can be chosen and a representation, or abstraction of the data is obtained. In this way the face images xi are projected
into the subspace by throwing away the components corresponding to zero eigenvalue. By PCA projection, the extracted features are statistically uncorrelated and the rank of the new data matrix is equal to the number of features (dimensions).
The Eigen face method is also based on linear projection of the image space to a low dimensional feature space. However the eigen face method which uses principal component analysis(PCA) for dimensionality reduction yields projection directions that maximizes the total scatter across all classes i.e. all images of all faces. In choosing the projection which maximizes total scatter, PCA retains some unwanted variations due to lighting and facial expression. The variations between images of the same face due to illumination and viewing direction are almost always larger than image variations due to change in face identity. Thus PCA projections are optimal for reconstructing from a low dimensional basis; they may not be optimal from discrimination point of view.
PCA is used for dimensionality reduction in a data set by retaining those characteristics of the data set that contribute most to its variance, by keeping lower-order principal components and ignoring higher-order ones. Such low-order components often contain the "most important" aspects of the data, which are projected as Eigenfaces.
If there is no noise or self shadowing, the linear subspace would achieve error free classification under any lighting conditions. Nevertheless, there are several reasons to look else where, first due to self shadowing, facial expressions, some regions of the face have variability that does not agree with linear subspace model. Given enough images of faces, we should be
able to learn which regions are good for recognition and which regions are not. Second, to recognize a set image we must measure the distance to linear subspace for each person. While this in an improvement over a correlation scheme that needs a large number of images for each class, it is still too computationally expensive. Finally from storage point of view linear subspace algorithm must keep five images in memory for every person.
B. KNN CLASSIFIER
The simplest classification scheme is a nearest neighbor classification in the image space. Under this scheme an image in the test set is recognized by assigning to it the label of the closest point in the learning set, where distance are measured in image space. If all images have been normalized to be zero mean and have unit variance, then this procedure is equivalent to choosing the image in learning set that best correlates with the test image. Because of normalization process, the result is independent of light source intensity and the effects of a video camera’s automatic gain control. Feature selection is achieved using this learning algorithm by constraining each classifier to depend on only a single feature [14].
The Euclidean distance metric [4] is often chosen to determine the closeness between the data points in KNN. A distance is assigned between all pixels in a dataset. Distance is defined as the Euclidean distance between two pixels. The Euclidean metric is the function d: Rn X Rn→ R that assigns to any two vectors in Euclidean n-space X=(x1,…, xn) and Y=( y1,…, yn) the
number,
d(x,y) = √(( x1 - y1)2 + ….. + (xn- yn) 2) (11)
This gives the "standard" distance between any two vectors in Rn. From these distances, a distance matrix is constructed between all possible pairings of points (x, y).
C. KNN ALGORITHM
1) Each data pixel value within the data set has a class label in the set, Class = {c1,...,cn}.
2) The data points', k-closest neighbors (k being the number of neighbors) are then found by analyzing the distance matrix. 3) The k-closest data points are then analyzed to determine which class label is the most common among the set.
4) The most common class label is then assigned to the data point being analyzed.
D. KNN PERFORMANCE VS CHOICE OF K
1) When noise is present in the locality of the query instance, the noisy instance(s) win the majority vote, resulting in the incorrect class being predicted. A larger kcould solve this problem. 2) When the region defining the class, or fragment of the class, is so small that instances belonging to the class that surrounds the fragment win the majority vote. A smaller k could solve this problem. The KNN shows superior performance for smaller values of k compared to larger values of k.
one of the n-features that are used to describe an instance. The absolute position of the instances within this space is not as significant as the relative distance between instances. This relative distance is determined by using a distance metric. Ideally, the distance metric must minimize the distance between two similarly classified instances, while maximizing the distance between instances of different classes.
KNN predictions are based on the intuitive assumption that objects close in distance are potentially similar, it makes good sense to discriminate between the k nearest neighbors when making predictions, i.e., let the closest points among the k nearest neighbors have more say in affecting the outcome of the query point. This procedure has several well known disadvantages. First, if the image in the learning set and test set are gathered under varying lighting conditions, then the corresponding points in the image space will not be tightly clustered. So in order for this method to work reliably under variations in lighting, a learning set which densely sampled the continuum of possible lighting conditions, is required. Second, correlation is computationally expensive. For recognition, we must correlate the image of the test face with each image in the learning set to reduce computational time. Third, it requires large amounts of storage: i.e, the learning set must contain numerous images of each person.
IV. IMPLEMENTATION
The work is implemented in Matlab. Yale Database is used for testing and training purposes. The database contains 165 grayscale images in GIF format of 15 individuals. There are 100 images per subject in the database.
The time taken for execution of each module in Pentium IV processor is given in Table I.
Table I. Execution time for Face recognition
Process Time Duration (in Seconds)
PFC extraction 0.1935
KNN classification 0.2325
The confidence values for the recognition of a person is calculated using the Euclidean distance between the PCA projected values of the test image and PCA projected values of the train database. This value determines whether recognition of a face image using this method is dependable or not. When the confidence value is low recognition is not dependable. The confidence value obtained for different test images are tabulated in Table II.
The confidence values were obtained for ten test subjects, of which eight subjects were recognized, as those images were in the train database with a confidence value above the threshold value and the other two subjects were not recognized successfully as their confidence values fall below the threshold.
Table II. Confidence value for 10 random persons
Test Image Confidence value
Subject 1 88.7182
Subject 2 84.8806
Subject 3 88.7468
Subject 4 20.5647
Subject 5 89.3108
Subject 6 88.6411
Subject 7 89.7412
Subject 8 88.6166
Subject 9 89.5824
Subject 10 24.7433
………….. ………..
.
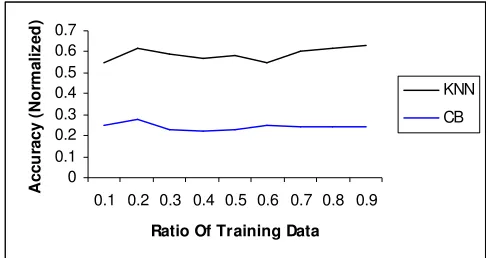
Table III. Accuracy values of KNN and CB classifier
Type KNN CB
Acc Test Train Both Test Train Both
k=1 0.3428 0.3444 0.3428 0.2553 0.2945 0.2866
From the Table III, it is observed that KNN classification algorithm outperforms CB classification algorithm in classification accuracy [7].
0 0.1 0.2 0.3 0.4 0.5 0.6 0.7
0.1 0.2 0.3 0.4 0.5 0.6 0.7 0.8 0.9
Ratio Of Training Data
A
c
c
u
ra
cy
(
N
o
rm
a
li
z
e
d
)
KNN
[image:4.595.309.554.449.578.2]CB
Fig 2. Comparison of KNN with Concept Vector based classifier
V. EXPERIMENTAL RESULTS
Fig 3. Cb part of input image
Fig 4. Cr part of input image
From the Gaussian fitted skin color model of the input image the likelihood of skin regions are obtained, highlighting the skin regions as shown in Fig. 5.
[image:5.595.388.476.83.179.2]Fig 5. Likelihood of skin regions in the given image
Using adaptive threshold skin regions are highlighted effectively, as shown in Fig. 6.
[image:5.595.357.507.258.383.2]Fig 6. Image after thresholding
The template face as shown in the Fig. 7 is obtained by template matching.
Fig 7. Template face (model) used to verify the existence of faces in skin regions.
Thus by template matching a rectangle is drawn for the detected face boundary as shown in the Fig. 8.
50 100 150 200 250 300 350
50
100
150
200
250
Fig 8. Face boundary for the given image
The retrieval of human faces requires detection of human faces in the subject’s image. Thus this method segments the skin regions out and locates faces using template matching in order to detect frontal human faces.
The detected face image is given as input of dimension 100X100 to the Eigen face recognition system which obtains the PCA projected values of reduced dimension 100X 1, which is used to recognize the face image by preserving the Euclidean structure of a person. The KNN classifier is used to classify the test image based on their Euclidean structure obtained using PCA. The test sample to the classifier and the classified output is shown in Fig. 9 and 10.
[image:5.595.111.220.386.480.2] [image:5.595.352.515.561.688.2]
Fig 10. Classifier output
VI. CONCLUSION
The proposed DR algorithm localizes the face from the given input image using the skin color detection method where the skin regions are segmented and face is located using template matching. The detected face image is projected using Eigen face analysis and classified using the K nearest neighborhood (KNN) classifier. This algorithm is efficient as it can be integrated with the output from multi-modal sensors and thus can be used as part of multi-sensor data fusion.
ACKNOWLEDGMENT
Authors thank Tata Consultancy Services for funding this project.
REFERENCES
[1] M.Belkin and P.Niyogi, “Laplacian Eigenmaps and Spectral Techniques for Embedding and Clustering”, Proc. Conf. Advances in Neural Information Processing System 15, 2001.
[2] Deng Cai, Xiaofei He, Jiawei Han, Senior Member, IEEE, and Hong-Jiang Zhang, Fellow, IEEE, “Orthogonal Laplacianfaces for Face Recognition”, IEEE Trans. On Image Processing, Vol. 15, No. 11, Nov. 2006. [3] Rafael C.Gonzalez , Richard E.Woods, “ Digital Image Processing,”
Prentice Hall Of India, 2005.
[4] M. A. Turk and A. P. Pentland, “Face recognition using eigenfaces”, IEEE Computer Society Conference on Computer Vision and Pattern Recognition, Proceedings CVPR ’91.
[5] John Wright, Allen Yang, Arvind Ganesh, Shankar Sastry, and Yi Ma. “Robust face recognition via sparse representation”, To appear in IEEE Transactions on Pattern Analysis and Machine Intelligence (PAMI), 2008. [6] Turk.M, and Pentland.A, “Eigenvalues for recognition,” Journal of
Cognitive Neuroscience, vol. 13, no. 1, pp.71-86, 1991.
[7] P. Sinha, B. Balas, Y. Ostrovsky, and R. Russell, “Face recognition by humans: Nineteen results all computer vision researchers should know about,” Proceedings of the IEEE, vol. 94, no. 11, pp. 1948–1962, 2006. [8] X. He, S. Yan, Y. Hu, P. Niyogi, and H. Zhang, “Face recognition using
Laplacianfaces,” IEEE Transactions on Pattern Analysis and Machine Intelligence, vol. 27, no. 3, pp. 328–340, 2005.
[9] R. L. Hsu, M. Abdel-Mottaleb, and A. K. Jain, “Face detection in color images,” IEEE Transactions on Pattern Analysis and Machine Intelligence, pp. 696–706, May 2002.
[10] J. Cai & A. Goshtasby & C. Yu, "Detecting Human Faces in Color Images", Wright State University, University of Illinois, 1998.
[11] C. Garcia and G. Tziritas, “Face detection using quantized skin color region merging and wavelet packet analysis,” IEEE Transactions on Multimedia Vol.1, No. 3, pp. 264–277, September 1999.
[12] Ming-Hsuan Yang, David J. Kriegman, and Narendra Ahuja, “Detecting faces in Images: A survey,” IEEE Transactions on Pattern Analysis and Machine Intelligence, pp. 34-58, January 2002.
[13] Vinod Pathangay and B. Yegnanarayana, "Use of vertical face profiles for text dependent audio-visual biometric person authentication," in Indian Conference on Computer vision, Graphics and Image processing, Ahmedabad, India, pp. 61—66, December 16-18 2002.
[14] Alex Pentland, Baback Moghaddam, and Thad Starner (1994), “View-Based and Modular Eigenspaces for Face Recognition”, IEEE Conf. on Computer Vision and Pattern Recognition, MIT Media Laboratory Tech. Report No. 245.