Abstract— One of the major activities of a manager is to communicate; this communication can be up or down the hierarchy (Vertical) or with other similar managers (Horizontal). The critical importance of communication has been growing with the increasing size of organizations owing to the vast economic development all across the world. In this scenario, the medium of communication and the factors that affect the time to communicate are of utmost importance.
Researchers have identified three factors that mainly affect communication in an organization. They are gender, level of employee in the organization, and sense of urgency conveyed in the message. To date, these factors have been considered separately; their interaction effects have not been studied in depth.
This research analyzes these three factors using a designed experiment in a technical organization, where response time is the response variable and the three factors are experimental variables. The organization chosen was the University of Minnesota Duluth. An experimental design approach was followed as it provides control over bias and uncertainties.
The results show that gender has a statistically significant effect, at α = 0.05, on the communication in technical organizations when any of the three media (Email, Voice Mail and Memo) was used. The sense of urgency affected the time to respond in email, but no effect was found in voice mail and memo. The reasons for the difference in response times are discussed and recommendations for future work are presented.
Index Terms— communication, communication effectiveness gender, level of employee, sense of urgency.
I. INTRODUCTION
Julia Scherba de Valenzuela [1] defined communication as, “Any act by which one person gives to or receives from another person, information about that person's needs, desires, perceptions, knowledge, or affective states. Communication may be intentional or unintentional, may involve conventional or unconventional signals, may take linguistic or nonlinguistic forms, and may occur through spoken or other modes.” In today’s corporate and industrial environment, managers occupy key decision-making positions which demand good communication skills. Chester Barnard [2] observed that the important function of an executive is to “develop and maintain a system of
Manuscript received March 17, 2010.
G. S. Natarajan is with the Department of Industrial Engineering, Texas Tech University, Lubbock, TX 79409 USA. (Phone: 218-341-2718; email: [email protected])
D. A. Wyrick is with the Department of Industrial Engineering, Texas Tech University, Lubbock, TX 79409 USA. (email: [email protected])
R. R. Lindeke is with the Department of Mechanical and Industrial Engineering, University of Minnesota Duluth, Duluth, MN 55812 USA (email: [email protected])
communication.” Communication represents the “central nervous system” of any organization.
This paper mainly focuses on the communication channels in technical organizations. A technical organization is defined, in this research, as engineering and design organizations, including the Research and Development
(R&D) department. This paper considers three main factors that affect communication in technical organizations: gender of the receiver, urgency of the message, and level of the receiver in the organization.
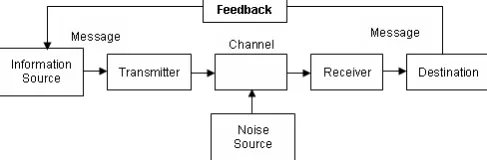
[image:1.595.303.547.256.336.2]The communication model followed in this research is the Transmission Model of Communication proposed by Shannon and Weaver [3]. This basic model is the simplest and most widely used model of communication; it does not, however, contain a feedback loop to receive valuable information from the receiver side to the sender side. In order to overcome this problem, this research will use a modified version of the basic Shannon and Weaver model as shown in Figure 1.
Organizations in general and technical organizations in particular, face immense pressure and competition in today’s challenging economy [4]. In this scenario, project management and particularly conveying messages to people and gaining their trust is a challenging task for the manager. A study by El-Shinnawy and Markus [5] has shown how electronic media has overtaken the conventional communication media (like face-to-face meetings, and letters) in professional communication.
Researchers have been trying to explore the field of communication for almost 70 years and have proposed various theories and found different results on which media works the best in technical organizations [6], [7]. The more important part that researchers are still exploring is the factors affecting the choice of the communication media. The main factors that appear in research studies are more often effects of gender [7]-[9] and employee level in the organization [7], [10]. In addition, some researches also cite urgency [11]-[13] as a key factor in the effectiveness of communication. The problem with all these studies is that they consider these factors separately and do not compare or
Communication in Technical Organizations:
A Designed Experiment Approach
Ganapathy S. Natarajan, Dr. David A. Wyrick, and Dr. Richard R. Lindeke
combine these factors and study the effects. A study which compares or combines these factors and their effects on the different media would help demonstrate the effectiveness of the different media at different levels of these factors.
The main objective of this research project is to combine the effects of gender, level of employee, and level of urgency with three communication media most widely used in technical organizations: email, voice mail and professional memo. To this end, this project will measure the time difference between sending a message and receiving a feedback from the receiver for different combinations of gender, levels of urgency, and level of employee in every media. This time is henceforth referred to as the response time.
In accordance with the project objectives stated above, three hypotheses were tested:
H1: Women respond significantly slower than men, irrespective of the type of media.
H2: Urgency does not affect the response time in memo, but there is a significant effect in email and voice mail
H3: Receiver’s level in the organization affects the response time significantly with both genders.
II. METHODOLOGY
The experiment was conducted in two phases: a pilot run and a data collection round. The data from the pilot run was used to analyze the validity and possible flaws in the experiment so that the changes can be incorporated in the data collection phase. The experimental design sample drew from the population of the Swenson College of Science and Engineering (SCSE) and Labovitz School of Business and Economics (LSBE) at the University of Minnesota Duluth.
A. Experimental Design
The factors that affect the communication response time are media, gender, level of urgency, and level of receiver in the organization, as discussed in the literature review. The basic experimental design has to take into account these factors and the levels of these factors. Media had three levels: email, voice mail, and interdepartmental memo. Urgency and gender had two levels each: urgent and not urgent, and male and female, respectively. The level of the receiver in the organization was simulated by dividing the sample into instructors, graduate students, and sophomores (second year undergraduates).
B. Phase I: Pilot Run
The pilot run used the factors and levels mentioned above. The experiment was blocked with the media, so that for each media the other three factors were altered and studied. Thus, this phase had 2 levels of gender, 2 levels of urgency, and 3 levels of level of receiver, which made the minimum number of required samples to be 12 (2 x 2 x 3). In order to obtain a reasonable value set for data analysis, it was decided to use three replicates of each setup, which increased the required sample size to be 36.
The response time was measured by sending out messages to the sample population and measuring the time until a reply was received. In order to apply control to the experiment and avoid biases, the blind measurement
technique was used. The identity of the sender of the message was masked so that the response time would not be changed because of respondents’ prior knowledge about this research. The identity of the sender is easy to track when using a regular University of Minnesota Duluth email address; so a new email address [email protected] was created and the display name was set to “Survey Coordinator, MIE Department.” The phone number used to send the voice mail messages was displayed as “Transportation Laboratory” and is difficult to physically identify.
In order to minimize respondents’ bias on revealing the subject of research, the message was structured to request for a time to meet and talk about some subject (for example: Supply Chain Management or Women in Science and Engineering). The actual variable measured here is the time to respond rather than the meeting time. The urgency in the message was altered at the subject line by either saying “Urgent – Request for a Meeting” or “Request for a meeting.” Urgency was also altered by varying the preferred time of meeting; in the urgent message the respondent was asked to provide a time slot in the same week, and in the message that was not urgent they were asked to provide the time slot within the next week. There would be three rounds of requests, each time through a different communication mode and using a different sender name. The subject for the third round would actually be the subject of interest, “Communication in Technical Organizations.”
The order of sending the messages may introduce a bias into the results. Since there are three modes, there are six possible combinations of sending messages, which may increase the sample size and complicate the analysis. Hence, an incomplete factorial design was followed for the order in which messages were sent. Each mode had to be in the first, second, and third place at least once in the three replicates experimented. This gave the pattern Replicate 1: Email, Voice Mail, and Memo; Replicate 2: Voice Mail, Memo, and Email; Replicate 3: Memo, Email, and Voice Mail. Although we did not explore all the possibilities, this technique should provide results very close to when all the six combinations were used.
C. Findings from Phase I
The pilot run was a failure and was ended short due to problems with the script and use of blind measurements. There were complaints that using a masked identity is misrepresentation of identity. The legitimacy of the script and the subject of the experiment came under scrutiny. The preamble paragraph in the letter did not give much information about the identity of the person sending the message. These factors demanded the pilot be discontinued until further changes in the script and the methodology. This led into Phase II of the experiment, which also includes a survey in order to measure the clarity and legitimacy of the experiment.
D. Data Collection Run
had the sender’s name and designation. In addition to that, the subject of discussion mentioned in the letter was the actual subject of discussion rather than some “hot” topic. Although, the identity has been revealed the purpose of the experiment was kept intact and the response time was the measured variable.
Revealing the identity and the actual subject meant that the same person cannot be sent different messages using different subjects through different media. The sample size had to be increased in order to have a statistical significance in the results. The minimum number of participants required increased from twelve to 36 (2 x 2 x 3 x 3). The extra “three” appears as the participants have to be different for each media used. Since the data are obtained from different sets of people, comparing the results for each mode is difficult. In order to obtain a statistically significant comparison of the modes, the replicates have to be increased [14]. The number of replicates is now increased to four, which results in a total sample size of 144 (36 x 4). Information on the sample population, such as email address, phone number and departmental mailbox address, were collected through the University of Minnesota Duluth online directory, respective department websites, and the SCSE dean’s office. The respective resident hall addresses and phone numbers were used in the case of sophomores. The instructors and graduate students were selected from both LSBE and SCSE, whereas, the sophomore sample included students from the SCSE, only. The instructors and graduates were supposed to represent the managerial level and thus included people from the LSBE.
The principal investigator met with the respondents at the time and place mentioned by the participants. Questions related to the participant’s experience in an organization of their choice were asked. The questions related to use of technical jargon in organizations and its effect on miscommunication, the effects or urgency and gender. The meeting was maintained as legitimate as possible and some interesting points stemmed out of it, some of which would be discussed later. The meeting was ended with a survey; surveys being handed out and collected immediately by the principal investigator.
E. The Survey Process
The two important points that came into question during the execution of the pilot run were clarity of the message and legitimacy of the message. In order to obtain these supplementary information and data for normalizing the time data, a survey was designed. The basic constructs of the survey were clarity and legitimacy. Each of the constructs had four questions to describe them differently and obtain a Cronbach alpha score as a measure of internal consistency [15]. The survey had a six point Likert scale, ranging from 1 (strongly disagree) to 6 (strongly agree). The “neutral” option was not included in order to force participants not to take the easy way out [16]. The message could have either been clear and legitimate or not; so taking out “neutral” aids the participant move towards one side only.
The survey instrument had nine questions in total. Eight out of the nine questions were based on the constructs, four each. Question numbers 2, 4, 7, and 8 pertained to the
legitimacy construct and the other questions (1, 3, 5 and 6) pertained to the clarity construct. The questions were taken from existing literature [17-19] and modified to suit the needs of this research. The questions were randomized completely so that there was no pattern to provide clues to respondents about the constructs being tested. Question 9 asked for the information on how often the participant checks email or voice mail or interdepartmental memo, based on the medium for which the person was contacted. The participants were asked for a numerical answer to this question. The number was used to normalize the raw response times obtained when they replied to the message. The normalization helped eliminate the inherent delays that could be due to the characteristics of the media. For example, if a person checked email every 30 minutes and replied after an hour, the relative score would be 2 (60/30). Similarly, if a person checked the interdepartmental memo every 2 days and replied within a day the score would be 0.5 (1/2). In comparison, the person who replied to the memo is relatively faster than the person who replied to email. The response has been delayed by the inherent characteristic of the memo and not by the behavior of the person replying. This relative measurement is equally important as the absolute values of time measured during the experiment.
F. Data Collection Plan
The email addresses, phone numbers, and interdepartmental mail box addresses of 144 people were collected and sorted so to ensure equal representation of males and females, and equal number of instructors, graduate students, and sophomores. There were a total of 72 male and 72 female participants, and 48 participants represented each level of receiver. The population was totally randomized such that there were three blocks with equal representation as discussed above. Then each of these three blocks were assigned to each mode of communication. Once randomization was complete, in each block 24 people (equal numbers of each level) were assigned to be sent “Urgent” messages. The other 24 people in each block were set to receive messages which were “Not urgent.” In this way, each block (blocked by the communication mode) has four replicates of all twelve possible combinations; arising from two levels of gender, two levels of urgency and three levels of receivers (2 x 2 x 3 =12. 12 x 4 replicates = 48). The results will be such that each mode can be compared against the other mode and also within itself as discussed in Section III.
G. Experimental Control
In this experiment, four main sources of biases were identified and controlled.
First, there was a chance that the receiver could contact the sender through a media other than the one used by the sender. The experimental setup needs the receiver to reply back in the same mode. Hence, inter-modal communication was avoided during data collection. The receiver was asked to reply back in the same mode as the message was sent.
time the message was sent. In order to avoid this bias all the messages were sent on the first working day of the week around 10:00 a.m.
Third, the instrument used to measure the times and the person measuring may introduce errors in the measurement. To avoid this bias, all times were measured at the same point, using the same instrument, and by the same person.
Last, the level of receiver is an experimental variable, whereas, the level of sender is a constant variable. The designation of the sender was kept the same (Survey Coordinator) to maintain constancy.
III. RESULTS AND DISCUSSIONS
As noted in Section II, the total number of recipients was 144. The total number of people who responded to the invitation was 75 (52%), of which 46 (61%) were male and 29 (39%) were female. Thirty-eight (53%) people responded to “urgent” messages and 37 (47%) replied to “non urgent” messages. Thirty-seven instructors (77%) and 31 (64.5%) graduate students replied to the message. The number of sophomores who replied was seven, and thus was not statistically significant. Hence, the response times of sophomores were not included in the analysis of data. The seven replies obtained from sophomores were divided as five for email and two for voice mail. This indicated that the use of voice mail and memo were absent in the case of sophomores.
A. Hypothesis 1: Influence of Gender
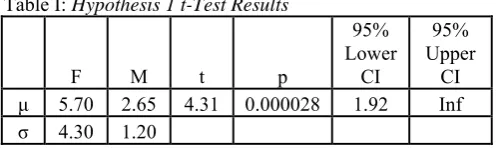
[image:4.595.45.294.521.595.2]Hypothesis 1 was tested using a one-tailed t-test. The one-tailed test was used so that the alternate hypothesis that females are slower than males can be tested. The null hypothesis for testing was μfemale – μmale = 0 and the alternate hypothesis was μfemale > μmale. The higher the normalized score, the slower the response time; so μfemale > μmale would indicate that females were slower than males in responding. The results of the t-test can be found in Table I.
Table I: Hypothesis 1 t-Test Results
F M t p
95% Lower CI
95% Upper CI
μ 5.70 2.65 4.31 0.000028 1.92 Inf
σ 4.30 1.20
The results show a very low p-value. The p-value is below the acceptable limit of 0.05. Thus we reject the null hypothesis which is μfemale - μmale = 0. The alternate hypothesis holds, indicating that there is a significant difference in the response times between male and female respondents irrespective of the media used. In particular, males are found to be faster in responding than females. There is enough evidence to support hypothesis H1 as true.
The difference in response time between the genders may be attributed to the difference in use of technology [20], but respondents include associate professors with a lot of experience. The difference in perception in using technology cannot be the single factor affecting male and female communication. The significance may also be attributed to the number of male respondents; 61% of the respondents and
this could have made the male population more significant. Another reason may be that females may not entertain messages from sources with whom they are not well acquainted [20]. This can be answered when the survey responses for the legitimacy constructs are analyzed later. Although Hypothesis 1 has been proved with evidence, the reasons could not be well established.
B. Hypothesis 2: Influence of Perceived Urgency
Hypothesis 2 was tested using a two-tailed test. The aim was to check whether the means were equal or different. Testing was done on three sets of hypotheses, each corresponding to a combination of urgency and media. In order to perform the t-test, a pooled sample standard deviation was calculated for all the combinations of urgency and media.
Three sets of null hypotheses and alternate hypotheses were formed for testing each combination of media and urgency level. In order for Hypotheses H2 to hold well, urgency must not have significance in memo, but should have significant effects in email and voice mail.
The three sets of hypotheses that were tested are as follows:
1. Email: H0: μNE - μUE = 0 Ha: μNE - μUE ≠ 0 where,
NE – Not Urgent and Email UE – Urgent and Email 2. Memo:
H0: μNM - μUM = 0 Ha: μNM - μUM ≠ 0 where,
NM – Not Urgent and Memo UM – Urgent and Memo 3. Voice Mail:
H0: μNV - μUV = 0 Ha: μNV - μUV≠ 0 where,
NV – Not Urgent and Voice Mail UV – Urgent and Voice Mail
Table II presents the results of testing these hypotheses. The p value for the first set of hypotheses is 0.04 (below the acceptable limit of 0.05), which means the null hypothesis is rejected. This would mean that there is a statistically significant difference in the means of the response times to “urgent” and “not urgent” messages when sent on email. The p values for the second and third set of hypothesis are well above 0.05, which is not enough evidence to reject the null hypotheses. The sense of urgency does not have a statistically significant effect when the message is sent through either voice mail or memo. Hypothesis H2 is partially supported – for email, and memo.
where the results may be different with another population. Urgency in voice mail did not affect the response time, as people tended to reply as soon as they hear the voice mail. Although the time of listening was a factor, it was normalized when the relative scores were calculated. Urgency did not have any effect on memo. The memos are cleared only once a day at the University of Minnesota Duluth and would reach the receiver on the next day. Hence, even if the receiver places the reply memo late, but within the same day, the delay has been normalized. The delay that happened in the sender replying has been cancelled due to the inherent characteristic of the media.
Table II: Hypothesis 2 – t-Test Results
# T P 95% Lower CI 95% Upper CI
1 -2.12 0.04 -5.16 -0.15
2 -0.55 0.58 -3.69 2.09
3 0.93 0.36 -1.36 3.72
C. Hypothesis 3: Level of Receiver
Hypothesis 3 tests the third factor in the experiment, level of the receiver in the organization. The interaction effects of level and gender also have to be studied.
In order to test the hypothesis and find the interaction effects, ANalysis Of VAriance (ANOVA) has to be performed. ANOVA was performed using MATLAB™ and the results are shown in Table III.
[image:5.595.303.555.414.611.2]The results show a high p-value for receiver level in the organization (Level). This means that the main effect of level on response time was not significant as there is not enough evidence to reject the null hypothesis H0: μInstructor-μGraduate= 0. Table III:Hypothesis 3 – ANOVA
Sourc e
Sum of Square
s
DOF Mean
Square F P > F
L 19.694 1 19.694 2.52 0.1174 G 143.923 1 143.923 18.41 0.0001 L X G 27.022 1 27.022 3.46 0.0676
Error 500.2 64 7.816
Total 685.615 67 L – Level, G-Gender.
On the other hand, the p-value for the main effects of gender is very low, indicating that gender has a statistically significant effect on response time. The interaction effects of Level X Gender has a p-value slightly more than 0.05, which means that response time is not statistically significant when level and gender are combined.
Gender seems to have a significant main effect and the interaction effects are almost absent. In addition, the main effects of level are not significant. This shows that hypothesis H3 does not hold. The effect of the level of receiver is similar for both the genders as suggested by the hypothesis, but the
main effects of level are not significant to support H3 completely. The lack of significance for main effect of level can be attributed to the poor response from sophomores. The sophomores were chosen to simulate the employees lower in the hierarchy, similar to the hourly employees used by Allen and Griffeth [7]. The lack of response may be due to that the employees at lower levels chose not to communicate. Similar to Allen and Griffeth’s [7] study, the employees do not prefer communication up the hierarchy as they communicate with their peer groups. The results of Allen and Griffeth’s [7] research showed significance in response times of female-hourly employees. The results from this research suggest that the level of receiver does not affect the response time even when the gender of the receiver changes.
D. Results of the Survey
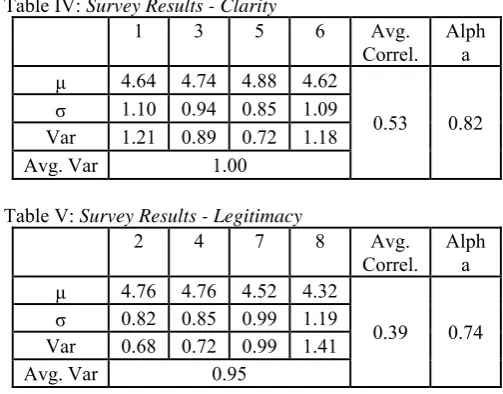
The survey collected information on the clarity and legitimacy of the message in order to understand no responses, late responses, and potential setbacks. The survey has two constructs: clarity of message and legitimacy of the message. The items measured for clarity were: clarity of intent, clear language, “to the point” information, and length of message. The items measuring legitimacy were: sender level, anonymity, credibility of subject used, and sender identity. Question numbers 1, 3, 5 and 6 are the four items describing the clarity construct. Question numbers 2, 4, 7 and 8 are the four items describing the legitimacy construct. The results of the survey are shown in Table IV (clarity) and Table V (legitimacy).
Table IV: Survey Results - Clarity
1 3 5 6 Avg.
Correl. Alpha
μ 4.64 4.74 4.88 4.62
0.53 0.82
σ 1.10 0.94 0.85 1.09
Var 1.21 0.89 0.72 1.18
Avg. Var 1.00
Table V: Survey Results - Legitimacy
2 4 7 8 Avg.
Correl. Alph
a
μ 4.76 4.76 4.52 4.32
0.39 0.74
σ 0.82 0.85 0.99 1.19
Var 0.68 0.72 0.99 1.41
Avg. Var 0.95
The averages for each item on the survey shows that the message was clear and the rating was more than 4.5, indicating a “slightly agree” to “agree” range for all the items. The message was thus fairly clear. The Cronbach alpha is seen to be 0.82, which shows that there was a good internal consistency (0.7 is the threshold) within the various items of the survey.
[image:5.595.51.288.484.638.2]about the sender’s identity. Female participants were more worried about the sender’s identity than male participants.
[image:6.595.46.292.140.242.2]As, discussed earlier, the gender perception of legitimacy is important to explain the low response rates of female participants. Table VI shows survey results for male and female participants for the legitimacy construct.
Table VI: Survey Results – Gender vs. Legitimacy
2 4 7 8 Mean
M μ 4.83 4.67 4.42 5.18 4.78
σ 0.82 0.85 0.99 1.19
F μ 4.69 4.85 4.62 3.46 4.40
σ 0.85 0.80 1.26 1.61
M-Male; F-Female.
The averages show that female participants were not sure of the sender’s identity when they replied. The sender’s identity could have had a negative effect on the number of female participants. This could explain the difference in the number of responses between male and female participants.
IV. CONCLUSIONS
The purpose of the study was to study the combined effects of gender, urgency, and level of the receiver in communication in technical organizations. The important factors affecting communication in technical organizations were tested under three different hypotheses and the results were analyzed. Gender was the major factor that was seen to affect communication. Along with the gender, urgency affected the response time for email communication. Response time is very important in technical organizations and especially in the R & D and new product development environment. The research followed a new approach. The author built a designed and controlled experiment to study the effects of these factors of interest. The results reported earlier indicated that this method of testing critical effects in communication was a success.
A. Results of the Hypotheses
Hypothesis 1 showed that there is a definite statistical difference in response times between males and females. This means that care should be taken when mixed gender groups and female groups are involved in the communication process.
Hypothesis 2 was partially accepted – for email and memo. There was no statistically significant difference in response times between “urgent” and “not urgent” messages in memo or voice mail; but there was a statistically significant difference in the case of email. The urgency in email was found to cause the impression of spamming in some of the sample population. This means that ways of sending urgent messages on email without them being mistaken for spam needs to be explored.
Hypothesis 3 was rejected at the 95% confidence level. Gender was found to be statistically significant, whereas the interaction effect between Level x Gender was found to be close but not statistically significant. This is a very important result from the manager’s point of view. Employees lower in the level were found to reply less or not reply at all to the
higher levels. The manager has to take into consideration this fact, and accommodate during communicating.
B. Results from the Survey
The survey results showed that the message was legitimate and clear. Females were more concerned about the legitimacy and identity of the sender. The result implies that care should be taken when sending messages to different genders. The identity of the sender has to be made clear and previous acquaintance of the sender and receiver should be considered.
C. Recommendations
The results indicate that gender differences and gender perceptions of the different modes have to be taken into consideration when communicating. The level of receiver has some effect on the time to respond. Response time differences were statistically significant based on gender differences, as well as level of urgency, at least for the case of emails. Managers should pay attention to gender differences and level of receiver when sending out vital information that may need feedback. Email was found to be a good mode for faster response on urgent information. Voice mail was found to perform similarly in “urgent” and “non urgent” situations. Managers and others communicating in a technical organization should focus on clarity of the message. The appearance of legitimacy must be considered, as different genders perceive legitimacy differently. The messages should be as clear as possible and the source and the subject must be understood as credible in order to receive faster responses.
D. Future Work
Sophomores, who were similar to the lower level employees in an organization, could not be included in the research. This trend may be indicative of a shift in communication in younger participants which may also be included in future research. The data from sophomores would have been valuable to test the differences in level of the receiver. In the future, care should be taken to include and obtain sufficient responses from the group selected as lower level employees.
The hypotheses in this research are very simple; much more testing and statistical analysis can be done. For example, a multivariate factor analysis would identify the important factors that affect response time. Complex statistics could be done in the future.
In future, ways of getting more replies from female participants should be followed. Since the experiment was confined to the Swenson College of Science and Engineering, the number of female respondents was limited. In future work, the sample could be selected from other technology-based organizations.
The sender’s level was maintained constant in this research. Female participants were found to not reply to messages as often or as fast when the identity of the sender was not well known to them. This suggests that, in future studies, different levels such as a boss, a colleague, and some unknown person may be used; in this case the difference in response times based on change in sender’s level may be studied.
be different due to many possible combinations of media. Future studies may allow inter-modal communication.
ACKNOWLEDGMENT
We would like to thank Dr. Patricia Borchert for her guidance in experimental techniques and statistical analysis. The authors would like to thank the Institutional Review Board of the University of Minnesota Duluth for granting the exemption to conduct research involving human subjects. The authors would like to thank the participants of the research, without whom this study would have been a failure.
REFERENCES
[1] J.S. de Valenzuela, “National Joint Committee for the Communicative needs of persons with Severe Disabilities,”1992.
[2] C.I. Barnard, The Functions of the Executive,MA: Harvard University
Press, 1938.
[3] C.E. Shannon, “A mathematical theory of communication,” Bell Systems Technical Journal, vol. 27, pp. 379-423, 1948.
[4] L.M. Markus, “Electronic Mail as the Medium of Managerial Choice,”
Organization Science, vol. 5, no. 4, pp.502-527, 1994.
[5] M. El-Shinnawy and L.M. Markus, “Acceptance of Communication Media in Organizations: Richness of Features?,” IEEE Transactions on Professional Communication, vol. 41, no. 4, pp. 242-253, 1998.
[6] L.McGee, “Communication Channels Used by Technical Writers throughout the Documentation Process,” IEEE Transactions on Professional Communication, pp. 35-50, 2000.
[7] D.G. Allen and R.W. Griffeth, “Vertical and Lateral Information Processing: The Effects of Gender, Employee Classification Level, and Media Richness on Communication and Work Outcomes,” Human Relations, vol. 50, no. 10, pp. 1239-1259, 1997.
[8] B.R. Burleson, “The Experience and Effects of Emotional Support: What the Study of Cultural and Gender Differences can tell us about Close Relationships, Emotion, and Interpersonal Communication,”
Personal Relationships, vol. 10, pp. 1-23, 2003.
[9] D. Gefen and D. Straub, “Gender Differences in the Perception and Use of E-mail: An Extension of the Technology Acceptance Model,” MIS Quaterly,, vol. 21, no. 4, pp. 389-400, 1997.
[10] S. Madzar, “Subordinates’ Information Inquiry in Uncertain Times: A Cross Cultural Consideration of Leadership Style Effect,”
International Journal of Cross Cultural Management, vol. 5, no. 3, pp. 255-274, 2005.
[11] Brigadier General M.K. Eder , “ Toward Strategic Communication,”
Military Review, pp. 61-70, 2007.
[12] B. Fischhoff, “Non-persuasive Communication About Matters of Greatest Urgency: Climate Change,” Environmental Science and Technology, pp. 7205-7208, 2007.
[13] M. Watson-Manheim and F. Belanger, “Communication Media Repertories: Dealing with the Multiplicity of Media Choices,” MIS Quarterly, vol. 31, no. 2, pp. 267-293, 2007.
[14] S. Vardeman and M. Jobe, Baisc Engineering Data Collection, CA:
Dusbury, 2001.
[15] L.J. Cronbach, “Coefficient Alpha and the Internal Structure of Tests,”
Pychometrika, vol. 16, no. 3, pp. 297-334, 1951.
[16] M. Patten, Questionnaire Research, Los Angeles, CA: Pyrczak
Publishing, 1998.
[17] S. Chermak and A. Weiss, “Maintaining Legitimacy Using External Communication Strategies: An Analysis of Police-Media Relations,”
Journal of Criminal Justice, vol. 33, pp. 501-512, 2005.
[18] G. Streib and T. Poister, “Assessing the Validity, Legitimacy, and Functionality of Performance Measurement Systems in Municipal Governments, American Review of Public Administration, vol. 29, no.
2, pp. 107-123, 1999.
[19] N. Baradburn, S. Sudman, and B. Wansink, Asking Questions, San Francisco, CA: Josey-Bass, 2004.