Manuscript version: Author’s Accepted Manuscript
The version presented in WRAP is the author’s accepted manuscript and may differ from the
published version or Version of Record.
Persistent WRAP URL:
http://wrap.warwick.ac.uk/111222
How to cite:
Please refer to published version for the most recent bibliographic citation information.
If a published version is known of, the repository item page linked to above, will contain
details on accessing it.
Copyright and reuse:
The Warwick Research Archive Portal (WRAP) makes this work by researchers of the
University of Warwick available open access under the following conditions.
Copyright © and all moral rights to the version of the paper presented here belong to the
individual author(s) and/or other copyright owners. To the extent reasonable and
practicable the material made available in WRAP has been checked for eligibility before
being made available.
Copies of full items can be used for personal research or study, educational, or not-for-profit
purposes without prior permission or charge. Provided that the authors, title and full
bibliographic details are credited, a hyperlink and/or URL is given for the original metadata
page and the content is not changed in any way.
Publisher’s statement:
Please refer to the repository item page, publisher’s statement section, for further
information.
A novel discrete method of shear angle measurement for in-plane shear
properties of thermoset prepreg using a point-tracking algorithm
Corentin Pasco*1, Muhammad Khan2, Kenneth Kendall1,
1 Automotive Composites Research Centre, WMG, The University of Warwick, 2 Faculty of Engineering, Environment and Computing, Coventry University *corresponding author email: [email protected]
Postal Address: WMG, The University of Warwick, International Manufacturing Centre, Gibbet
Hill Road, Coventry CV4 7AL, United Kingdom
Abstract
:Determining accurate in-plane shear properties of dry and prepreg fabrics is dependent upon the
correct measurement of actual shear angle values. This paper presents a novel discrete method
of shear angle measurement for in-plane shear properties of thermoset prepreg using a
point-tracking algorithm. Two different reinforcement forms of woven and unidirectional with the same
rapid-cure resin system are used in this study. In-plane shear tests of picture-frame and
bias-extension are employed to evaluate the new discrete method under conditions representative of
high-volume manufacturing, i.e. fast deformation rate and elevated temperature. This study
demonstrates that the proposed discrete method is capable of measuring the shear angle
correctly until large shear deformation, unlike traditional methods such as digital image correlation
(DIC) and the pin-jointed network (PJN) approach. Furthermore, the normalised shear force data
presents a better correlation of the two tests based on the actual shear angle measurement
obtained from this novel discrete method.
1. Introduction
1.1. Problem statement
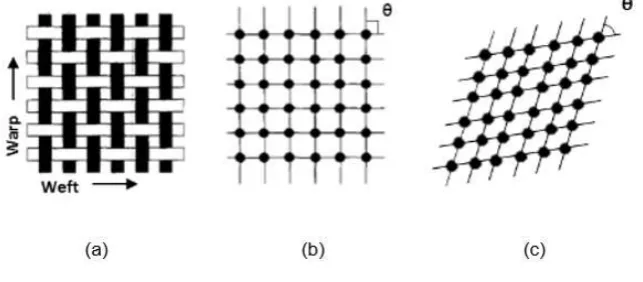
Upon deformation, the initially orthogonal tows of a woven material will rotate relative to each
other around the crossover points, resulting in a change of angle between the tows, known as
shear angle. This particular shearing mechanism gives biaxial fabrics the ability to be draped
over doubly-curved surfaces without forming folds or wrinkles. This deformation mode is often
conceptualised using the analytical approach known as the pin-jointed net (PJN) model [1],
which assumes that: (1) the tows are inextensible with no thickness and no width, (2), warp and
weft tows are free to rotate at their crossover points (i.e. as if they are pinned) without relative
[image:3.595.134.456.347.488.2]slippage and (3) the tows remain straight between the crossover points during deformation.
Figure 1 shows a schematic representation of the PJN model.
Figure 1: Schematic representation of the pin-jointed model. (a) Woven fabric structure, (b) Ideal equivalent representation in the initial state and (c) ideal equivalent representation after deformation
It was demonstrated by Potter [1], that dry and prepreg biaxial reinforcements behave almost
entirely like a PJN, provided that the blank size is considerably greater than the warp and weft
tow size. However, it was shown that under bias-extension deformation this statement is only
valid up to a certain shear angle, after which the actual material shear angle starts deviating
from the theoretical one [2]. This phenomenon is caused by inter-tow slippage at higher shear
angle. As a consequence, an accurate measurement method must be employed when
characterising the in-plane shear behaviour of reinforcements.
A well-established full-field measurement technique in the textile field is Digital Image
during the bias-extension test of dry reinforcements [3, 4]. More recently, attempts have been
made to use DIC with prepreg materials [5], however with partial success. The authors’ attempts
have also proved challenging, due to the following reasons:
(1) When testing at relevant processing conditions (e.g. elevated temperature and shear
rate in the case of thermoset prepreg for high-volume applications) a number of
difficulties arise. Relatively high-speed testing requires a short exposure time (or shutter
speed) to avoid the motion blur that makes the image correlation impossible. This
requirement subsequently limits the amount of light allowed to pass through the lens
system. One possible solution is the use of external white light sources. However,
reflections from those external lights onto both the window of the thermal chamber and
the glossy resin of the specimen can create glare and distort the images.
(2) Under large shear deformation, excessive rotation of the warp and weft tows, along
with compaction of adjacent tows causes significant disruption of the speckle pattern
used for DIC analysis. This compaction results in the inability to track the displacement
of target subsets and the loss of data points.
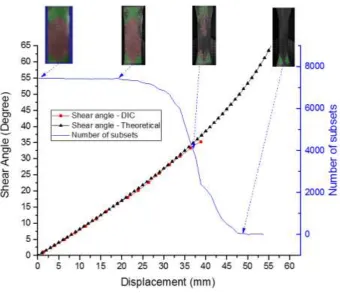
The preliminary findings from the authors’ own attempt at measuring the material shear angle
during a bias-extension test are shown in Figure 2. The tests were performed at 80°C with a
crosshead speed of 8.33mm.s-1,using a 2D-DIC GOM ARAMIS® system consisting of a high-resolution (12M 4096 x 3072 pixels) CCD camera equipped with a 75mm lens. The left axis
shows the measured shear angles using 2D-DIC compared against theoretical ones based on
the PJN assumptions, while the right axis shows the evolution of the subset count as the test
progresses. In addition, snapshots of the specimen surface along with the subsets location and
density is displayed at four different intervals. While the DIC results and the theoretical
predictions are in good agreement, no more data could be obtained beyond a shear angle of
35°. As can be seen in Figure 2, the number of subsets decreases dramatically from
approximately 8000 to 0, between 30 and 45mm displacement. In addition, at a displacement of
about 35mm, most of the remaining subsets (red areas) are located at the borders of the central
region of interest (i.e. characterised by the red areas). Therefore, results might not be
during bias-extension test is limited to relatively low shear angles. Another issue with DIC arises
from the use of matt black paint commonly sprayed onto the surface specimen to remove
reflection and increase contrast. Harrison et al. [6], pointed out that this treatment may
significantly affect the mechanical properties of the material. These findings stress the need for
an alternative method for shear angle measurement during in-plane shear test of thermoset
[image:5.595.127.468.213.506.2]prepreg and are the main motivation for this current study.
Figure 2: Plot of shear angle in pure-shear zone Vs displacement of the twill woven prepreg with a sample size of 74mm x 222mm in a bias-extension test
1.2. Review of shear angle measurement method
A number of techniques exist to measure the evolution of the shear angle during in-plane shear
test of woven materials. The first category can be referred to as manual image analysis and
requires digital images of the specimen captured at specific time intervals during the test [6, 7].
The shear angle between warp and weft tows is manually measured using image analysis
software such as ImageJ, or CAD packages such as Autocad. An example of manual shear
Figure 3: Manual shear angle measurement using image analysis [7]
Although this technique is relatively simple to implement, it is subject to human error and only
provides a local shear angle, as opposed to a full-field measurement. A second category of
techniques includes the use of dedicated algorithm. Harrison et al. [8], while studying the trellis
shearing resistance of fabrics, developed an automated image analysis software aimed at
facilitating the interpretation of bias-extension data (Figure 4). Using successive images of the
specimen under bias-extension test, the software fits linear equations to lines drawn on the
surface of the specimen prior to testing. The inter-tows angle is then readily calculated at
different points within the pure-shear zone of the bias-extension specimen using the fitted
equations. Although this technique allows the rapid collection of a number of data points,
inevitable errors in the fitting procedure arise from the finite thickness and varying contrast of
the lines, resulting in errors in the shear angle measurement.
Figure 4: Interface of the image analysis software developed by Harrison et al. [8]
Arumugam et al. [9], developed a MATLAB algorithm using Hough transform to determine the
shear angle during picture-frame tests. Pictures of a specimen onto which a grid array is drawn
[image:6.595.232.366.471.655.2]then post-processed and converted to binary images. A Hough transform is then used to detect
the lines and their intersection points. The algorithm then yields the distance between each line
and the origin, along with the angle between each line and the origin. It is then possible to
obtain the shear angle values at the location of each intersection. In this particular example, 16
[image:7.595.219.378.185.344.2]data points were obtained.
Figure 5: Grid pattern on a picture-frame specimen [9]
A last category of measurement techniques requires specific hardware. Such an example,
referred to as the Apodius Vision System, from Apodius GmbH is presented and used in [10]
and [11]. Using a high definition camera along with a proprietary software, the Apodius sensor
allows to measure the fibre orientation as well as the shear angle with a resolution of 0.1° (in
terms of fibre angle). Although this method provides an accurate mean of measuring shear
angle, it is significantly more expensive than other methods based on image analysis method.
In the present work, a new method based on an open-source point-tracking algorithm is
proposed. The method, referred to as the discrete method, is an inexpensive and accurate way
of measuring the shear angle during in-plane shear testing of composite reinforcements. In
comparison to the DIC technique, the discrete method requires less sample preparation and
does not need for a complex lighting environment. In addition, the discrete method allows the
measurement of the shear angle at large shear angles, without loss of any data points. Further,
unlike previously developed dedicated algorithm such as in [8, 9], the proposed method allows
the collection of a much larger number of data points (i.e. in excess of 200), making it possible
2. Experimental set-up
2.1. Materials
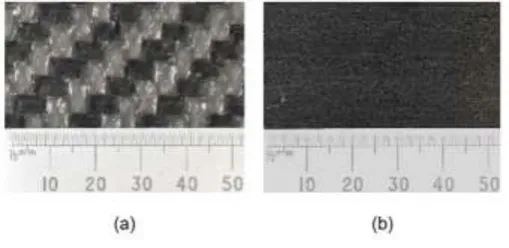
The materials used in this study are a unidirectional and a 2x2 twill weave reinforcement
architectures for thermoset prepreg systems. The unidirectional material has a fibre areal weight
of 250 g/m², a 15k tow-size and a resin content of 30% by weight while the woven material has
a fibre areal weight of 400 g/m², a 12k tow-size and a resin content of 40% by weight. The
prepreg materials investigated are based on the same epoxy rapid cure thermoset resin. Both
materials are commercially available and have been specifically designed for
compression-moulding and high-volume applications. Typical curing time is 5 minutes at 140°C but can be
adjusted depending on the moulding temperature. Figure 6 shows images of the prepreg
[image:8.595.171.426.344.468.2]materials. Further details on the material specifications can also be found in [12].
Figure 6: Materials tested: (a) 12k 2x2 Twill thermoset prepreg. (b) 15k unidirectional thermoset prepreg
2.2. Measurement principle of the novel method
The proposed measurement method relies on an open-source Fiji (https://fiji.sc/) plugin named
Trackmate [13]. This technique, mostly used in biology (for e.g. cell-tracking [14, 15]) consists of
a wizard-like GUI providing the tools to perform single-particle tracking (SPT). The plugin
enables the identification and tracking of bright particles and/or spot-like structures over a dark
background, within consecutive frames (i.e. images). Each particle is assigned an identity and
its trajectory (referred to as “track”) is reconstructed, yielding information such as its
coordinates, total displacement, velocity and so forth. The Trackmate plugin is fairly automated
and guides the user through several steps, consisting of a spot-detection step, a spot-analysis
Prior to launching the plugin, a sequence of temporally related frames of equal size and bit
depth must be imported into Fiji and combined into a single stack. Spatial calibration is then
performed to translate pixel units into physical units (i.e. mm). If required, frames can be
pre-processed to enhance contrast and to reduce noise
First, an initial spot-detection stage is carried out using a Laplacian of Gaussian (LoG) filter. A
LoG filter is a two-step operation consisting in smoothing and filtering images to find local
maxima, corresponding to spot locations. Each spot is assigned a quality value by taking the
local maxima. Spots of quality lower than that set in the LoG filter will be automatically
discarded. Spots are then analysed using a number of filters. The user can discard or keep
spots based on, for instance, their intensity index and/or their estimated diameter. Finally, the
movement of the filtered spots is tracked in consecutive frames using a simple Linear
Assignment Problem (LAP) algorithm. An LAP algorithm is a mathematical framework consisting
of assigning a set of objects (in this case spots) identified in a next frame, to existing tracks (i.e.
trajectories) at a minimum cost. Here, the cost refers to possible physical assignment between
tracks and detected spots (e.g. potential links between two spots). The LAP algorithm returns
the assignment list that minimises the sum of their costs. Spot-linking processes can be
visualised immediately and at any stages and the user can easily navigate back and forth
through the different steps to modify the settings if required. Tracking results consisting of each
track along with the spots coordinates can then be exported into an xml file and retrieved using
a Matlab routine provided by Tinevez et al. [13]. Finally, a custom algorithm was developed and
used to convert the displacement of each dot into local shear-angle variation, using the law of
cosines.
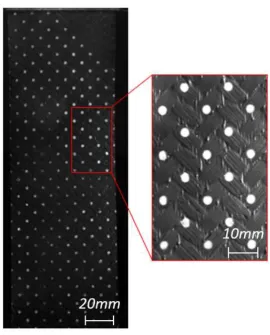
To provide a spot-like structure, a discrete, evenly spaced array of 3mm diameter dots was
drawn on the surface of the sample using white acrylic paint. A stencil was designed so that the
dots were placed at every other tow crossovers in both the warp and weft directions (Figure 7).
A CCD camera was used to capture images of the sample at regular time intervals (i.e. 0.25s in
3. Results and discussion
To assess its effectiveness and accuracy, the new shear angle measurement method was
applied to two commonly used in-plane shear tests for textile reinforcements. First,
picture-frame experiments were carried out on the woven material and theoretical shear angle values
were compared to measured ones. Secondly, bias-extension tests of both woven and UD
materials were performed, and shear angle values that were measured using both DIC and the
proposed method were compared to the theoretical ones.
3.1. Picture-frame test
The picture-frame test, is a de facto standard for measuring the in-plane shear behaviour of
aligned fibrous materials. During a test, the specimen is clamped in a square-shaped frame,
hinged at each corner. The fibres of the specimen are carefully aligned with the edges of the
frame. A tensile load is applied across two diagonally opposite corners of the frame, thereby
imposing pure-shear deformation onto the specimen. One corner of the frame is fixed while the
opposite one is connected to a load cell, of 500N capacity in this case, that measures the force
exerted on the sample. The load cell was connected to the crosshead of an Instron 5800R. The
crosshead displacement and the force measured by the load cell were recorded during a test.
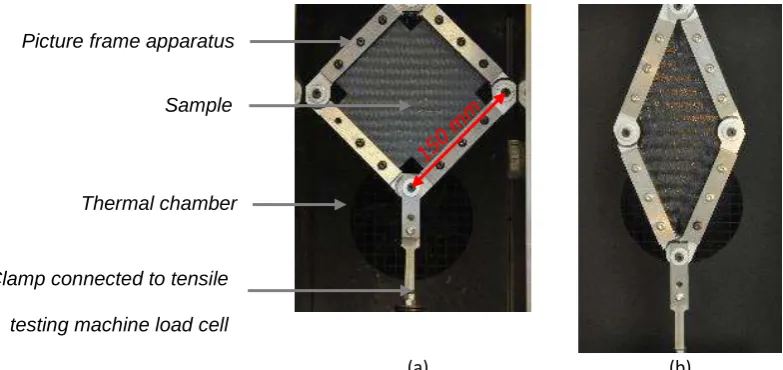
Figure 8 shows the picture-frame test setup used in this research. The distance between hinges
is 150mm and the effective specimen area is 17,956mm2. It is normally accepted that the picture-frame test provides uniform shear conditions and that the determination of the shear
angle can be done directly using the kinematics of the frame [16]. Based on the crosshead
displacement, the shear angle can be calculated using [7]:
1
1
2cos
2
2
2
pfd
L
(1)with, the shear angle, d the crosshead displacement and Lpf the side length of the frame
(a) (b)
Figure 8: Picture-frame of a 2x2 twill weave: (a) before deformation and (b) after deformation
Using the point-tracking algorithm method, it was also shown that during a picture-frame test,
the average shear angle within the material is similar to the angle of the frame. In this case, the
maximum difference observed between the average measured shear angle across the whole
specimen and the theoretical shear angle is 0.5° (Figure 9). This finding is in agreement with the
previous study from Lomov et al. [4], who demonstrated using DIC that, during a picture-frame
test of both dry and thermoplastic woven materials, the material shear angle was similar to the
frame angle (i.e. within 2°). This example demonstrates that the evolution of the shear angle
can be directly determined from the frame displacement and does not require additional
measurement methods. This particular exercise can also be considered as a first step on
validation of the proposed discrete method for measurement of shear angle using picture-frame
test.
Figure 9: Theoretical and measured shear angle vs displacement during picture-frame test of the 2x2 twill prepreg
0 5 10 15 20 25 30 35 40 45 50 55 60 65 70 75 0 5 10 15 20 25 30 35 40 45 50 55 She
ar angle (degree)
Displacement (mm) Shear angle - Theoretical Shear angle - Measured
Sample
Thermal chamber
Clamp connected to tensile
[image:12.595.190.403.533.716.2]3.2. Bias-extension test
3.2.1. Woven
The bias-extension, similar to the picture-frame test, is a widely used method to characterise the
shear behaviour of both dry and prepreg (in their uncured state) woven reinforcements. The test
setup used in this study is shown in Figure 10. The test consists of a tensile test of a rectangular
woven material with warp and weft tows initially oriented at ±45° to the direction of the applied
load. The specimen is clamped at both ends. One clamp is fixed whilst the other one is
connected to a 500N load cell that measures the force exerted on the sample. The load cell is
connected to the crosshead of an Instron 5800R. The effective specimen dimensions (i.e.
outside of the clamps) were 220mm by 74mm. It is important that the length to width ratio be
greater than two to satisfy the PJN conditions [17]. In the present work, the test was carried out
[image:13.595.92.475.360.636.2]in a thermal chamber.
Figure 10: Bias-extension of a 2x2 twill weave: (a) before deformation and (b) after deformation
Based on the PJN assumptions, it was shown that a woven material will generally exhibit three
distinct zones during a bias-extension test (Figure 11): A central region C with uniform shear, an
In region C, the PJN assumption can be used to predict the shear angle(i.e. the change in the
angle between the warp and weft tows) as a function of the crosshead displacement such that:
1 0
0
2 cos
2
2
L
d
L
(2)where Lo is the difference between the length and the width of the sample and d is the
crosshead displacement. The current work aims at investigating the behaviour of woven prepreg
under bias-extension deformation, and compare the data against the PJN assumption. This
investigation will be supported by measurement of the shear angle using the novel discrete
[image:14.595.158.433.315.604.2]method.
Figure 11: Illustration of a bias-extension and the different shear zones - [18]
The measurement results for a bias-extension test of the 2x2 twill prepreg carried out at 8.33
mm.s-1 are presented in Figure 12. These include the shear angle contour plot superimposed over picture of the specimen at different stages (a and b, Figure 12), as well as the trajectory
and speed of each dot (c, Figure 12). The speed can be visualised by means of the different
(a) (b) (c)
Figure 12: Outputs of the dot tracking method for a bias-extension test showing shear angle contours for a crosshead displacement of (a) 30mm, and (b) 65mm and (c) the dots speed (in mm.s-1) and trajectory
The shear angle contours are plotted for a crosshead displacement of 30mm (a, Figure 12) and
65mm (b, Figure 12) corresponding to the end of the test. In addition, lines were drawn on the
surface of the specimen along the borders separating the different theoretical shear zones. In
both cases, the contour plots show the presence of three different shear zones, with a central
area where peak values are twice that of the adjacent intermediate zones, and an area adjacent
to the clamp with negligible shear. At the end of the test, the shear angle distribution within the
pure-shear zone reveals a 10° difference between minima and maxima, with the existence of a
gradient between the different zones. The trajectories (c, Figure 12) show the relative motion of
each point throughout the entire test and reveal the existence of a bilateral symmetric
deformation pattern. The speed distribution is characterised by a relatively linear gradient from
top to bottom and as expected, reveals a significantly faster motion of the top dots (i.e. near the
moving clamp) than the bottom dots (i.e. near the stationary clamp). A total of approximately
180 data points were collected, of which 120 were located in the theoretical zone corresponding
different results plotted against the crosshead displacement. It can be seen that up to a
displacement of approximately 38mm, each approach provides similar shear angle values with a
maximum deviation of 4°. Upon further displacement, the DIC method becomes ineffective due
to significant loss of data points. In addition, the theoretical values deviate significantly from
those obtained with the tracking method (i.e. referred to as discrete method). This difference is
because deformations are no longer the result of pure-shear deformation but are a combination
of shear and slippage [19], accompanied with tow compactions between warp and weft.
Therefore, the PJN assumptions are no longer valid [20]. These observations serve to: (1)
demonstrate that the shear angle can be accurately predicted using the theoretical equation (2)
without requiring a measurement method, up to approximately 35°; and (2) validate the
proposed discrete measurement method as a reliable way to determine the shear angle
[image:16.595.183.402.346.537.2]continuously throughout a bias-extension test.
Figure 13: Shear angle in zone C vs displacement during bias-extension test of the 2x2 twill prepreg
The experimental results of bias-extension tests performed using two different crosshead
speeds are presented in Figure 14. For each test condition, the experimental results were
averaged over three specimens. The error bars represent one standard deviation on either side
of the mean. For each plot, the load is plotted as a function of the actual, measured shear angle
(i.e. obtained using the proposed discrete method) and the theoretical shear angle. The
theoretical shear angle was calculated using equation (2), whereby the crosshead extension
can be converted into theoretical shear angle within the pure-shear zone of the bias-extension
used to calculate the shear angle values beyond the locking angle (i.e. approximately 35°).
Beyond this value, it can be observed that the theoretical shear angle deviates from the
measured one. Towards the end of the bias-extension test, the theoretical shear angle reaches
a maximum value of 90°, suggesting that the fibres are perfectly aligned with the direction of the
applied load. This condition is highly unlikely because beyond the shear angle locking, the
relative rotation of the warp and weft tows is hindered by adjacent tow compaction. Therefore, in
practice, shear angle values will tend to reach a limit. Consequently, to perform accurate
preforming simulation, the shear angle values based on crosshead displacement should not be
considered as input parameters when bias-extension data are used. Failing that, for any shear
angle values beyond the locking angle, the numerical model may underestimate shear stresses.
[image:17.595.86.508.304.514.2](a) (b)
Figure 14: Load Vs measured and theoretical shear angle for bias extension tests performed with a
crosshead speed of (a) 1mm.s-1 and (b) 8.33mm.s-1
3.2.2. Cross-plied UD
The proposed measurement method was also used to study the behaviour of cross-plied UD
prepreg under bias-extension deformation. Tests were carried out at 80°C with a crosshead
speed of 8.33 mm.s-1 using specimen consisting of four cross-plied UD prepreg layers (i.e. [+45/-45]s), making up a total of 8 plies. Specimen dimensions were kept similar to those used for the woven material to facilitate comparison between both materials. The shear angle
contours are plotted for a crosshead displacement of 30mm (Figure 15, a) and 65mm (Figure
0 10 20 30 40 50 60 70 80 90 0.0 0.5 1.0 1.5 2.0 2.5 3.0 Load ( N))
Shear angle (degree) Measured
Theoretical
0 10 20 30 40 50 60 70 80 90 0.0 0.5 1.0 1.5 2.0 2.5 3.0 Load ( N)
Shear angle (degree) Measured
picture of the specimen at different stages (Figure 15, a and b), as well as the trajectory and
speed of each dot (Figure 15, c). For each crosshead extension, the shear angle contour reveal
three distinct zones that correspond remarkably well with the theoretical shear zones predicted
by the PJN model (highlighted with the white painted lines). Similar to the woven material, it can
be observed that the shear angle values obtained in the central zone of the specimen are
double that of the adjacent, intermediate zones. The bottom zone adjacent to the clamp
remained undeformed. The dot trajectories and speed shown in Figure 15, c are relatively
similar to those observed for the woven material.
[image:18.595.90.508.258.545.2](a) (b) (c)
Figure 15: Outputs of the dot tracking method for a bias-extension test of a cross-plied UD laminate showing shear angle contours for a crosshead displacement of (a) 30mm, and (b) 65mm, and (c) the dots
speed (in mm.s-1) and trajectory
3.2.3. Comparison between woven and cross-plied UD
Figure 16 shows the comparison of shear angle measurement using the theoretical approach
based on the kinematics of the specimen, and the results obtained from the discrete method for
both the UD and the woven materials. Interestingly, throughout the entire test, the measured
angles for the UD are almost identical to those for the woven (i.e. within a 2° range for any given
relatively well predicted by the PJN model up to a displacement of 40mm (corresponding to a
shear angle of around 35°), where the maximum difference in shear angles values is no more
than 5°. However, beyond this point, the theoretical values start increasing nonlinearly, while the
values for both the UD and woven remain linear. With regards to the UD material, the PJN
model overestimated the shear angle value by approximately 10° at a displacement of 50mm,
[image:19.595.176.416.213.413.2]and by 30° at a displacement of 60mm.
Figure 16: Shear angle in the pure-shear zone Vs crosshead displacement for both the UD and woven prepregs, compared to the PJN prediction.
The findings provide strong evidence that cross-plied UD prepreg deform in a similar way to
woven material. Although cross-plies UD do not possess physical linkages similar to woven
materials (in the forms of crossovers, facilitating trellis shearing), the interaction between the
different layers (most likely in the form of adhesive contacts through the viscous resin) yields a
similar in-plane deformation under bias-extension. The discrepancies between the measured
and predicted shear angle values confirm that, similar to the woven material, deformation must
be accurately monitored during bias-extension of cross-plied UD prepreg.
3.3. Comparison between bias-extension and picture-frame tests of woven material
Because the picture-frame and bias-extension tests can both be used for measurement of
in-plane shear behaviour of textile reinforcements, the data generated from these tests should be
comparable. To compare bias-extension and picture-frame data for the same material, results 0 5 10 15 20 25 30 35 40 45 50 55 60 65
0 10 20 30 40 50 60 70 80 90 Shea r a ng le ( de g) Displacement (mm)
extension tests due to the inherent kinematics induced and the sample geometry used during
the tests. Therefore, an accurate normalisation technique must be used before comparing the
test data. The next sections explain the normalisation procedure.
3.3.1. Equivalent angular shear rate
To compare test data from different experiments, one must perform the experiments under
similar conditions of temperature and test speed due to the temperature and shear rate
dependent viscosity of the prepreg material. In the present case, test speed must be expressed
in terms of shear rate. To work out an equivalent shear rate, the following procedure was used:
(1) the shear rate obtained during a bias-extension test was determined from the measured
shear angle value; (2) based on this shear rate, the required crosshead speed for a
picture-frame test was calculated.
Figure 17 shows the measured shear angle values plotted against time for a bias-extension test
performed with a crosshead speed of 1mm.s-1. It can be seen that the shear angle varies in a linear fashion with time, indicating a constant shear rate within the reinforcement during the test.
This is in disagreement with Sharma et al. [20], who stated that for a constant crosshead speed,
the resulting shear rate within the reinforcement is variable. The slope of the linear fit
[image:20.595.193.403.544.715.2]corresponds to the value of the shear rate in °.s-1. In this case, it can be observed that a bias-extension test performed with a crosshead speed of 1mm.s-1 produces a shear rate within the material of approximately 0.83°.s-1.
Figure 17: Experimental evolution of the shear angle with time for a bias-extension test performed with a crosshead speed of 1mm.s-1
0 5 10 15 20 25 30 35 40 45 50 55 60 0 5 10 15 20 25 30 35 40 45 50 55
Experimental shear angle Linear fit Shea r a ng le ( ) Time (s)
y = 0.8264x + 0.0945 R2
It is then possible to calculate the required crosshead speed needed during a picture-frame to
produce a similar shear rate. It was shown by Clifford et al. [21], that the angular shear rate
during a picture-frame test can be expressed as:
2 2 1/2
2
sin
(2
2 2
)
pf pf pf
d
d
L
L
L d
d
(3)where
is the shear rate,d
andd
are the crosshead speed and displacement, respectively, andLpf is the side length of the frame. Rearranging equation (3), the required crosshead speed for a given angular shear rate can be expressed for any displacement of the picture-frame such that:
2 2 1/2
(2
2
)
sin
2
pf pf
pf
L
L d
d
[image:21.595.95.501.143.221.2]d
L
(4)Figure 18 shows the required relationship between the crosshead speed and the crosshead
displacement to obtain a constant shear rate of 0.83°/s during a picture-frame test. It can be
seen that this relationship is not linear, and a decreasing crosshead speed is required as the
test progresses to maintain a constant shear rate.
[image:21.595.158.439.461.671.2]This relationship was then programmed into the universal tensile testing machine. A test speed
based on an equation was not possible using the software. Therefore, the function was
discretised into a set of steps of constant speeds. The actual crosshead speed recorded by the
machine is shown Figure 19. Although there is inevitably a slight discontinuity in the crosshead
[image:22.595.181.413.193.374.2]speed, the resulting speed profile was deemed acceptable.
Figure 19: Actual Vs desired crosshead speed as a function of its displacement
3.3.2. Normalisation of bias-extension data
To compare picture-frame and bias-extension data, the forces obtained from the test must be
expressed in quantities that are independent of the sample geometry and the measurement
device. Such a quantity is the shear force per unit length known as ‘normalised shear force’.
During a bias-extension test, the energy required to deform the specimen is dissipated in two
zones: zone B and zone C (Figure 11). The shear force required to produce ideal pure-shear
conditions in zone C can be written as:
2
3
1
cos
1
cos
2
sin
2
.
2
cos
2
sh be sh
L
F
F
W F
L
W
W
(5)where L and W are the length and width of the sample, respectively,
is the shear angle,F
beisthe load recorded by the load cell during the bias-extension test, and
F
sh represents the shear3.3.3. Normalisation of picture-frame data
In the case of picture-frame where the length of the specimen is not equal to the length of the
frame, it was shown by Launay et al. [22] and Cao et al. [7], that the normalised shear force per
unit length Fsh can be written as:
( )
2 cos(
)
4
2
norm sh
F
F
(6)
Equation (6) yields the same property as equation (5) from the bias-extension test, where
isthe shear angle and
F
normis the normalised load exerted by the picture-frame such that:2 c frame norm fabric
F L
F
L
(7)where Fc the load applied on the picture-frame, Lframe and Lfabric the side length of the
picture-frame and of the sample, respectively.
3.3.4. Normalised results
The normalised shear force vs shear angle curves from picture-frame and bias-extension tests
are shown in Figure 20. All curves have been smoothed using fast Fourier transformation to
reduce noise before normalisation. For the bias-extension data, the shear force was calculated
based on both the theoretical shear angles (dashed, black line) and the measured shear angles
(solid, black line). It can be seen that both ways provide different data, in that the curves start
deviating from a shear angle of 35° onwards (i.e. when the pin-jointed assumptions are no
longer valid). Beyond this value, inter-tow slippage occurs during the bias-extension test and
influences the evolution of the shear angle. The proposed measurement method enables to
account for all the different deformation mechanisms by measuring the actual shear angle
during a bias extension-test. Interestingly, the bias-extension results that are based on
measured shear angle are much closer to the normalised picture-frame data than the theoretical
results that are based on the measured shear angle show a plateau from approximately 10° to
30°, the picture-frame data show a slight gradual increase between 15 to 45°. This relative
difference is attributed to tension in the fibres in the picture frame, arising from fibre
misalignment with respect to the frame and excessive clamping. This phenomenon was also
observed in [7] and [23, 24]. Generally, the normalised results, based on the measurement of
shear angle from the discrete method, show that the picture-frame and the bias-extension tests
provide similar data, suggesting that both test methods can be used for the measurement of
[image:24.595.171.418.257.478.2]intraply-shear properties of woven prepreg.
4. Summary and conclusions
Characterisation of the intraply shear properties of composite reinforcements and prepregs is
dependent upon the correct measurement of the shear angle that evolves during in-plane shear
deformation tests, such as the picture-frame and the bias-extension tests. The current work was
aimed at introducing a novel ‘discrete method’ of shear angle measurement based on a
point-tracking algorithm. The application of the proposed method was demonstrated on thermoset
prepreg materials with UD and woven reinforcement. The investigation concludes that the
discrete method is a full-field strain measurement technique that is robust and straightforward.
The study used three methods of shear angle measurement i.e. theoretical, digital image
correlation (DIC) and discrete method. A comparison of these three methods applied to
bias-extension tests showed that the new discrete method is capable of measuring the shear angle
accurately up to large deformations whereas the results from the theoretical and DIC
approaches are useful only up to a shear angle of about 35°. The theoretical method is based
on the kinematics of a pin-jointed network and is unable to account for deformations other than
pure-shear. DIC is a well-recognised method for full-field strain measurement, but the approach
is difficult to implement due to the nature of sample treatment required as well as the conditions
of high-deformation rate adopted for high-volume application of composite manufacturing. The
current study demonstrated that DIC becomes unusable after a certain stage of shear
deformation due to loss of data points resulting from compaction of lateral tows and disruption of
the speckle pattern. The discrete method proposed and implemented in this study proved to be
robust and required minimal sample preparation in the form of a spot-like structure. In addition,
it was found that this method is significantly more forgiving than 2D-DIC as far as sample
preparation, lighting conditions and image analysis are concerned. It is also worth mentioning
that later trials in a different study were successfully performed using a standard 1080p HD
webcam (as opposed to a CCD camera), highlighting the simple and inexpensive nature of the
proposed method.
The discrete method relies on an open-source Fiji plugin named ‘Trackmate’. Spot-linking and
The study also presents a comparison of the normalised shear force based on shear angle
measurements from the discrete method for bias-extension and picture-frame tests. The results
demonstrated that both tests can be used for measuring the intraply shear behaviour of prepreg
materials using actual values of shear angle measurement as determined using the proposed
Acknowledgement
This work was jointly funded by EPSRC and Aston Martin Lagonda Ltd. under grant reference
number 1500124. The authors wish to thank WMG and Aston Martin Lagonda Ltd. for their
support. A particular thanks is addressed to Frederick Walker, Manager Body CAE at Aston Martin
Lagonda Ltd., for his involvement in reviewing the progress of the work and appraising its
![Figure 4: Interface of the image analysis software developed by Harrison et al. [8]](https://thumb-us.123doks.com/thumbv2/123dok_us/9431342.448876/6.595.151.438.66.171/figure-interface-image-analysis-software-developed-harrison-et.webp)
![Figure 5: Grid pattern on a picture-frame specimen [9]](https://thumb-us.123doks.com/thumbv2/123dok_us/9431342.448876/7.595.219.378.185.344/figure-grid-pattern-on-picture-frame-specimen.webp)

![Figure 11: Illustration of a bias-extension and the different shear zones - [18]](https://thumb-us.123doks.com/thumbv2/123dok_us/9431342.448876/14.595.158.433.315.604/figure-illustration-bias-extension-different-shear-zones.webp)
