O R I G I N A L A R T I C L E
Open Access
Assessment of axillary temperature for the
evaluation of normal body temperature of
healthy young adults at rest in a
thermoneutral environment
Shuri Marui
1, Ayaka Misawa
1, Yuki Tanaka
1and Kei Nagashima
1,2*Abstract
Background:The aims of this study were to (1) evaluate whether recently introduced methods of measuring axillary temperature are reliable, (2) examine if individuals know their baseline body temperature based on an actual measurement, and (3) assess the factors affecting axillary temperature and reevaluate the meaning of the axillary temperature.
Methods:Subjects were healthy young men and women (n= 76 andn= 65, respectively). Three measurements were obtained: (1) axillary temperature using a digital thermometer in a predictive mode requiring 10 s (Tax-10 s), (2) axillary temperature using a digital thermometer in a standard mode requiring 10 min (Tax-10 min), and (3) tympanic membrane temperature continuously measured by infrared thermometry (Tty). The subjects answered questions about eating and exercise habits, sleep and menstrual cycles, and thermoregulation and reported what they believed their regular body temperature to be (Treg).
Results:Treg,Tax-10 s,Tax-10 min, andTtywere 36.2 ± 0.4, 36.4 ± 0.5, 36.5 ± 0.4, and 36.8 ± 0.3 °C (mean ± SD), respectively. There were correlations betweenTtyandTax-10 min,TtyandTax-10 s, andTax-10 minandTax-10 s(r= .62,r= .46, andr= .59, respectively,P< .001), but not betweenTregandTax-10 s(r= .11,P= .20). A lowerTax-10 swas associated with smaller body mass indices and irregular menstrual cycles.
Conclusions:Modern devices for measuring axillary temperature may have changed the range of body temperature that is recognized as normal. Core body temperature variations estimated by tympanic measurements were smaller than those estimated by axillary measurements. This variation of axillary temperature may be due to changes in the measurement methods introduced by modern devices and techniques. However, axillary temperature values correlated well with those of tympanic measurements, suggesting that the technique may reliably report an individual’s state of health. It is important for individuals to know their baseline axillary temperature to evaluate subsequent temperature measurements as normal or abnormal. Moreover, axillary temperature variations may, in part, reflect fat mass and changes due to the menstrual cycle. Keywords:Core temperature, Regular body temperature, Tympanic temperature, Digital thermometer, Infrared
thermometry, Menstrual cycle, Body mass index, Prediction measurement, Thermal sensation, Healthy people
* Correspondence:[email protected]
1Body Temperature and Fluid Laboratory (Laboratory of Integrative
Physiology), Faculty of Human Sciences, Waseda University, Mikajima 2-579-15, Tokorozawa, Saitama 359-1192, Japan
2
Institute of Applied Brain Sciences, Waseda University, Tokorozawa, Saitama 359-1192, Japan
Background
In most animals, body temperature is an important de-terminant for metabolism, movement, and neural activ-ity [1–3]. Homeothermic animals, in particular, maintain a constant body temperature using various autonomic and behavioral processes [4]. However, the meaning of the term body temperature is sometimes vague. In large animals, including human beings, the body temperature represents the temperatures of two separated physical compartments: core and shell [5], and reports indicate that thermal inputs from both the core body and the skin activate thermoregulatory responses [6, 7].
We propose that the core body temperature is used as a surrogate for the body temperature in clinical medicine, and accurate monitoring involves placement of a thermometer such as a thermistor probe or thermocouple in the core body, e.g., the rectum or esophagus [8, 9]. More practical methods such as thermometry in the oral cavity, axilla, and ear canal are used in clinics and at home as the first step in the evaluation of infection, inflammation, and medication ef-fects. These methods aim to assess the core temperature al-though the temperatures measured are those of the body shell. Among them, axillary temperature measurement has been widely used to evaluate patient temperature for years [9–11], probably due to the ease of axillary access [10]. However, the influence of the environmental temperature and incorrect placement of the thermometer lead to errone-ous body temperature measurement [9]. Additionally, some more recently introduced digital thermometers, while cap-able of producing rapid results, utilize a predictive algorithm that could augment measurement errors and tend to show lower values [12–14].
“Normal body temperature” was defined as the axillary temperature measured using a mercury thermometer (ap-proximately 37.0 °C) [15]. However, axillary temperature varies among people, and temperatures ranging from 36.2 to 37.5 °C are accepted as normal [15, 16]. This range may compensate for various factors that influence measure-ment. The factors include measurement errors and environment temperature. Moreover, we speculate that the wide range of axillary temperature reflects physical and physiological characteristics affecting the shell temperature, such as fat mass, skin blood flow, or basal metabolic rate. The existence of human temperature vari-ation indicates that a comparison of an individual’s temperature with the normal range may not accurately evaluate their state of health. Instead, it is more important to compare the individual’s current temperature with their personal baseline temperature. For example, we can iden-tify a fever based on a temperature that is 0.5 °C greater than the personal normal temperature.
In the present study, we aimed to reevaluate the meaning of the normal body temperature determined by measure-ments of axillary temperature. Previous studies assessed the
importance of axillary temperature measurements by com-paring them to core temperature measurements [11–13, 17–24]. However, these studies were limited to small groups, patients, and newborns. Therefore, we first compared the axillary and tympanic temperatures of over 100 healthy sub-jects of a similar age in the same thermoneutral environ-ment and during the same season. Tympanic temperature was utilized as a surrogate for core temperature [25, 26]. We also compared each subject’s perceived personal base-line body temperature with the axillary temperature we re-corded. Finally, we tested our hypothesis that axillary temperature deviations are related to physical, physiological, and behavioral characteristics.
Methods
Subjects
Healthy college students were recruited for the study (76 males and 65 females, aged 20.7 ± 1.6 and 20.7 ± 1.9 years (mean ± SD), respectively). Experiments were conducted from August to October (autumn in Japan). Body temperature was measured from 2:00 to 3:00 p.m. in an
experimental room maintained at an ambient
temperature of 25.4 ± 2.0 °C and relative humidity of 62
± 9% (mean ± SD, respectively). All subjects were
instructed to wear light clothing (such as T-shirts and long pants), and no subjects reported discomfort during the study. Written informed consent was obtained from all individual participants prior to commencing the study. The Human Research Ethics Committee of the Faculty of Human Sciences of Waseda University ap-proved all the procedures. The study was also conducted in accordance with the Declaration of Helsinki.
Subjects were instructed to avoid exercise the day before the experiment and eschew food intake for 1 h before arriving at the experimental room. In addition, we verified that subjects wore lighter clothes. While sit-ting in a chair for at least 30 min, the subjects completed a questionnaire (12 questions for males and 13 for fe-males) about sleeping and eating habits, menstrual cycle (females), exercise, and body temperature. The question-naire included a question asking each participant to state his or her own regular body temperature (Treg).
Axillary temperatures were determined with a digital thermistor probe (MC612, Omron Healthcare, Inc., Kyoto, Japan). The accuracy and resolving power of the thermistor sensor are ±0.1 and 0.1 °C, respectively. The measurement was performed twice, using different modes provided in the probe. One temperature was ob-tained using the standard mode: subjects were asked to
place the thermometer in their axilla until the
temperature displayed was stable, which usually took 10 min (Tax-10 min). The other was assessed using the
determined by an algorithm (based on the immediate in-crease in temperature that occurs when the subject places the instrument) within 10 s (Tax-10 s). Subjects
conducted these measurements by themselves after in-struction by a researcher.
After the measurement of Tax-10 min and Tax-10 s, the
subject’s tympanic membrane temperature (Tty) was
mon-itored with an infrared sensor probe (CE Thermo, NIPRO Corp., Osaka, Japan) as a surrogate for estimating core temperature [25, 26]. The sensor probe was placed in the left ear canal with the assistance of a researcher. The probe occluded the ear canal, and the researcher adjusted the placement of the probe so as to make the sensor show the highest value (i.e., ideal direction of the probe). The data was recorded at 30-s intervals and stored on a com-puter, till when the value became stable (±0.1 °C for 3 min, usually took 10–15 min).
Body mass index was calculated as weight (kg)/height2 (m2) and classified as follows: underweight, 18.4 kg/m2 or below; normal weight, 18.5–24.9 kg/m2; overweight, 25.0 kg/m2or above [27].
Statistics
We drew histograms demonstrating the grouped Treg,
Tax-10 s, Tax-10 min, and Tty data. The data for each
temperature measurement method was divided into interval widths of 0.3 °C each, from 35.1 to 37.2 °C, and less than 35.1 °C and greater than 37.2 °C. The skewness and kurtosis were determined for each distribution (IBM SPSS Statistics for Windows, Version 22.0., IBM Corp., NY, USA). We hypothesized that the skewness and kur-tosis were both 0 if the data showed normal distribution. The difference of means betweenTreg,Tax-10 min,Tax-10 s,
and Ttywas assessed by the one-way analysis of variance
using SPSS software. A post hoc test was conducted using the Bonferroni method.
The correlations betweenTax-10 minandTax-10 s,Tax-10 min
and Tty, and Tregand Tax-10 s were evaluated by Pearson’s
test. Fisher’s z-transformation test was performed to exam-ine the difference between the correlations. Lexam-inear regres-sion analysis was also conducted using the method of least squares.
We assumed a causal relationship betweenTax-10 sresults
and the questionnaire answers. First, we divided the subjects into two groups based on theirTax-10 s: one group with
mea-surements lower than theTax-10 smedian and the other with
higher measurements. Each answer of the questionnaire was digitized and compared between the two groups using Student’sttest. The null hypothesis was rejected atP< .05. All values are expressed as the mean ± SD.
Results
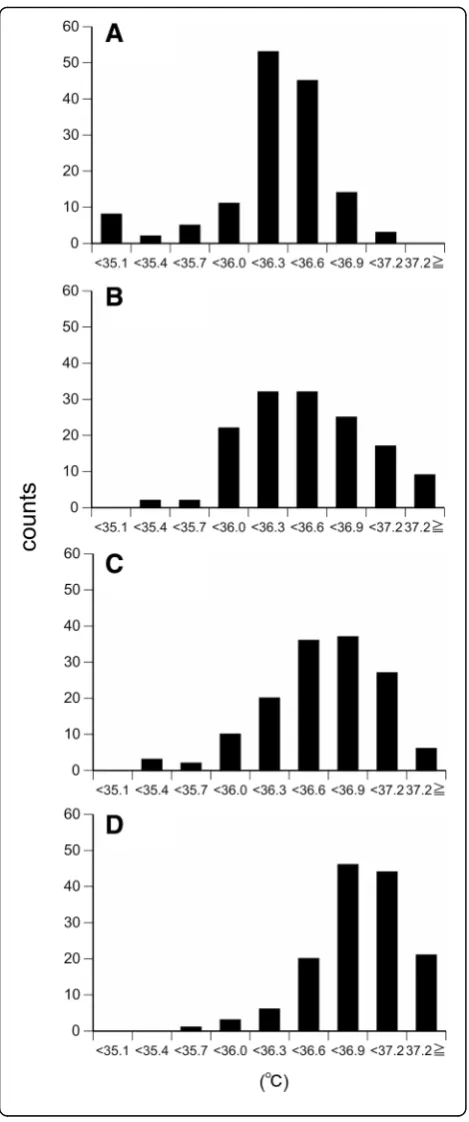
Figure 1a–d shows the frequency distributions of Treg,
Tax-10 s,Tax-10 min, andTty, respectively. The mean values
were 36.2 ± 0.4, 36.4 ± 0.5, 36.5 ± 0.4, and 36.8 ± 0.3 °C. Any pair of the means was different (P< .05). The me-dian values ofTreg,Tax-10 s,Tax-10 min, andTtywere 36.2,
36.4, 36.5, and 36.9 °C, respectively. The skewness was −0.40, 0.04,−0.66, and −0.82 in Treg,Tax-10 s,Tax-10 min,
and Tty, respectively, and the kurtosis was 0.51, −0.28,
0.54, and 1.02.
Figure 2 shows scattergrams demonstrating the relation-ship between Tty and Tax-10 min(A),Tty and Tax-10 s (B),
Tax-10 minandTax-10 s(C), andTregandTax-10 s(D). There
were significant correlations between Tty and Tax-10 min,
Tty and Tax-10 s, and Tax-10 min and Tax-10 s (r= .62,
P< .001; r= .46, P< .001; and r= .59, P< .001, re-spectively). However, there was no significant correlation betweenTregandTax-10 s(r= .11,P= .20). The linear
regres-sion line equations for Tty andTax-10 min,Tty and Tax-10 s,
andTax-10 minandTax-10 swere:y = 0.82x + 6.26,y = 0.64x +
12.94, andy = 0.62x + 13.80, respectively. Ther-value forTty
andTax-10 minwas greater than that forTtyandTax-10 s(z=
2.64,P= .01).
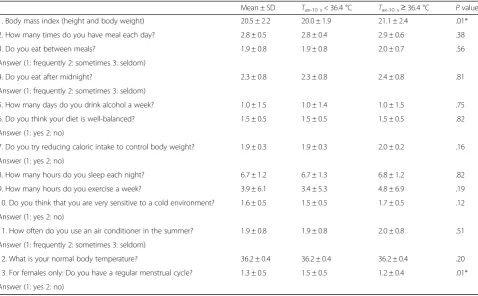
Table 1 summarizes the comparison of each answer in the questionnaire between the two groups we had defined by subjectTax-10 s. The group with aTax-10 sbelow the
me-dianTax-10 shad a lower body mass index and women in
the groups that had irregular menstrual cycles.
Discussion
The term “normal body temperature” is often used in
clinical medicine and at home; however, the definition should be more sharply defined to avoid misunderstand-ing. We aimed to answer three fundamental questions regarding the normal body temperature (usually assessed by the value of axillary temperature) in the present
study. First, we analyzed if variation in axillary
temperature between subjects originated from (a) technical errors in the measurement process, for ex-ample, incorrect placement of the measurement device, (b) technological problems with the instrument itself, for instance, with the predictive algorithm, or (c) individual differences in core body temperature. Second, we tested whether the body temperature subjects identified as their personal body temperature corresponded with their measured body temperature. Third, we investigated if differences in axillary temperature reflect differences in physical, physiological, or behavioral characteristics or vice versa.
We obtained Tty using continuous infrared
used in the present study was designed to correct the in-fluence by monitoring the ambient temperature and to fit to the ear canal, pointing to the tympanic membrane (based on the manual of the maker). We also tried to in-crease the reliability of the measurement by the methods as follows, besides collecting data of more than 100 subjects. Measurements were conducted in a stable thermoneutral environment to minimize deviations from the core temperature. A researcher conducted the place-ment of the probe, making the sensor face to the tym-panic membrane. The probe occluded the ear canal, which also minimized the influence of the ambient temperature. Moreover, we continuously measureTty, till
when the value became stable (usually took 10–15 min). We assume that, even if the sensor did not correctly point to the tympanic membrane, the stabilizing period allowed the inner-ear temperature to become identical to the temperature of the tympanic membrane. The average was 36.8 ± 0.3 °C, and the coefficient was 0.8%. This finding together with the higher value of the kur-tosis for the frequency distribution of Tty could suggest
that there was little interindividual difference in the core temperature. Although the skewness was less than 0, the result may also suggest the accuracy of the measurement method (Fig. 1d).
Reports indicate that axillary temperature, although measured at the body surface, correlates well with the core temperature [11, 13, 17, 21–24]. In the present study, we also found a significant correlation between
TtyandTax-10 min(Fig. 2a), although the frequency
distri-bution of Tax-10 min was different from that of Tty
(smaller kurtosis, Fig. 1c, d). Moreover, the regression
slope was 0.82. These results may suggest that under the conditions present during our measurements, axillary temperature closely approximates the core temperature as previously reported. However, the value showed greater variation among subjects compared to Tty. In
addition,Tty was higher thanTax-10 minas previously
re-ported [28]. Because the measurements were conducted in a similar environment and under the instruction and
Fig. 1Histograms demonstrating the groupedTreg,Tax-10 s,Tax-10 min, and Ttydata. Histograms ofa Treg(median = 36.2 °C, skewness =−0.40, kurtosis = 0.51),bTax-10 s(median = 36.4 °C, skewness = 0.04, kurtosis = −0.28),c Tax-10 min(median = 36.5 °C, skewness =−0.66, kurtosis = 0.54), andd Tty(median = 36.9 °C, skewness =−0.82, kurtosis = 1.02) in healthy young men and women (n= 141). The data for each temperature measurement method was divided into interval widths of 0.3 °C, from 35.1 to 37.2 °C, and less than 35.1 °C and greater than 37.2 °C.Treg, the regular body temperature each subject reported in the questionnaire,T
supervision of researchers, factors leading to measure-ment errors [9] may have been negligible.
There was a significant correlation between Tty and
Tax-10 min, and Tty and Tax-10 s (Fig. 2a, b). The
correl-ation coefficient (r) for the correlation between Tty and
Tax-10 s was lower than that for the correlation between
Tty and Tax-10 min. These results confirm thatTax-10 s
in-cludes a greater error in estimated axillary temperatures as indicated by previous reports [12–14]. Moreover, the mean ofTax-10 swas lower than that ofTax-10 min, which
suggests that it is necessary to know an individual’s per-sonal regular temperature as obtained by the standard method. This knowledge may help individuals to assess whether they have a fever correctly and, thus, evaluate their state of health more accurately.
It seems to be accepted that “normal body
temperature” is around 37.0 °C on average, although a range around this value (36.2 to 37.5 °C) is considered within normal limits [15, 16]. However, in the present
study, the averaged values estimated by axillary
temperature measurements using a digital thermometer were lower than the accepted normal value (i.e., 36.2 °C on average). The reason remains unclear. Differences in sensor material and the use of a predictive mode may have resulted in lower values.
In recent years, the axillary temperature is usually measured using a predictive mode, and all of the study participants regularly used this method of measurement. However, we did not find any correlation between Treg
and Tax-10 s (Fig. 2d). This result may suggest that the
body temperature subjects believe to be their regular temperature is not based on the values they previously measured. However, we may have misinterpreted the data, because axillary temperature shows daily fluctua-tions and is influenced by the menstrual cycle [29, 30].
Subjects with a Tax-10 s below the median tended to
have a lower body mass index (28% underweight, 0% overweight) compared to those whoseTax-10 swas above
the median (14% underweight, 78% normal weight, 8% overweight) (Table 1). A smaller subcutaneous fat mass may affect axillary temperature and be a factor involved in the interindividual difference we found. In addition, female subjects in the former group had irregular menstrual cycles. The disturbance of body temperature related to irregular menstrual cycles may influence axil-lary temperature.
Twenty subjects (14% of the total subjects) reported a
Treg below 36.0 °C. Eight of these subjects had aTax-10 s
these eight subjects may have reported their regular body temperature based on the knowledge of previous actual measurements.
An individual’s axillary temperature is judged as normal or abnormal based on a previously determined value (i.e., 37.0 °C), and it is well known that normal body temperature varies [15, 16]. The present results may indi-cate that the normal temperature range has changed due to the use of digital thermometers that utilize predictive algorithms. Our experiment included young and healthy subjects in an environment controlled to minimize factors that could potentially affect axillary temperature; although, we did not consider gender differences including those re-lated to menstruation. Even in the experimental environ-ment, we found important interindividual differences. The present study suggests that each individual needs to be aware of his or her baseline temperature. The interindivid-ual differences in axillary temperature may, in part, reflect measurement errors. However, we found a lower Tax-10 s
that was associated with lower body mass indices in male and female subjects and with irregular menstrual cycles. Because we did not assess physiological parameters such as metabolism, skin temperature, and skin blood flow, which may influence axillary temperature, the reasons for the observed interindividual variation remain unclear.
Future studies are needed to clarify the mechanism under-lying this variation.
Conclusions
Modern axillary temperature measurement techniques
may have changed the range of normal body
temperature; nonetheless, they are reliable enough to es-timate the core body temperature adequately. However, even between young and healthy subjects at rest in a comfortable environment, a normal temperature shows significant variation. Our results suggest that each indi-vidual should know his or her own regular temperature. Moreover, axillary temperature may reflect individual physical differences and diverse physiological states. Ax-illary temperature still has importance in evaluating health status, not only for determining if a fever is present but also for defining our baseline state of health.
Abbreviations
Tax-10 min:Axillary temperature using the standard mode, taking 10 min;
Tax-10 s: Axillary temperature using the predictive mode, taking 10 s; Treg: Regular body temperature;Tty: Tympanic membrane temperature
Acknowledgements
Not applicable.
Table 1The comparison of each answer in the questionnaire between the two groups defined byTax-10 s
Mean ± SD Tax-10 s< 36.4 °C Tax-10 s≥36.4 °C Pvalue
1. Body mass index (height and body weight) 20.5 ± 2.2 20.0 ± 1.9 21.1 ± 2.4 .01*
2. How many times do you have meal each day? 2.8 ± 0.5 2.8 ± 0.4 2.9 ± 0.6 .38
3. Do you eat between meals? 1.9 ± 0.8 1.9 ± 0.8 2.0 ± 0.7 .56
Answer (1: frequently 2: sometimes 3: seldom)
4. Do you eat after midnight? 2.3 ± 0.8 2.3 ± 0.8 2.4 ± 0.8 .81
Answer (1: frequently 2: sometimes 3: seldom)
5. How many days do you drink alcohol a week? 1.0 ± 1.5 1.0 ± 1.4 1.0 ± 1.5 .75
6. Do you think your diet is well-balanced? 1.5 ± 0.5 1.5 ± 0.5 1.5 ± 0.5 .82
Answer (1: yes 2: no)
7. Do you try reducing caloric intake to control body weight? 1.9 ± 0.3 1.9 ± 0.3 2.0 ± 0.2 .16
Answer (1: yes 2: no)
8. How many hours do you sleep each night? 6.7 ± 1.2 6.7 ± 1.3 6.8 ± 1.2 .82
9. How many hours do you exercise a week? 3.9 ± 6.1 3.4 ± 5.3 4.8 ± 6.9 .19
10. Do you think that you are very sensitive to a cold environment? 1.6 ± 0.5 1.5 ± 0.5 1.7 ± 0.5 .12
Answer (1: yes 2: no)
11. How often do you use an air conditioner in the summer? 1.9 ± 0.8 1.9 ± 0.8 2.0 ± 0.8 .51
Answer (1: frequently 2: sometimes 3: seldom)
12. What is your normal body temperature? 36.2 ± 0.4 36.2 ± 0.4 36.2 ± 0.4 .20
13. For females only: Do you have a regular menstrual cycle? 1.3 ± 0.5 1.5 ± 0.5 1.2 ± 0.4 .01*
Answer (1: yes 2: no)
Funding
This study was supported by a Grant-in-Aids for Scientific Research (B) (20390066) from the Ministry of Education, Sports, Science, and Technology, Japan.
Availability of data and materials
Not applicable.
Authors’contributions
KN supervised the entire project. SM and KN designed the study and wrote the manuscript. SM, AM, and YT performed the experiments. All authors read and approved the final manuscript.
Competing interests
The authors declare that they have no competing interests.
Consent for publication
Not applicable.
Ethics approval and consent to participate
Written informed consent was obtained from all individual participants prior to commencing the study. The Human Research Ethics Committee of the Faculty of Human Sciences of Waseda University approved all the procedures (2015-162). The study was also conducted in accordance with the Declaration of Helsinki.
Received: 22 January 2017 Accepted: 15 February 2017
References
1. van Marken Lichtenbelt WD, Schrauwen P, van De Kerckhove S, Westerterp-Plantenga MS. Individual variation in body temperature and energy expenditure in response to mild cold. Am J Physiol Endocrinol Metab. 2002; 282:E1077–83.
2. Rising R, Keys A, Ravussin E, Bogardus C. Concomitant interindividual variation in body temperature and metabolic rate. Am J Physiol. 1992;263:E730–4. 3. Tosini G, Menaker M. Circadian rhythm of body temperature in an
ectotherm (Iguana iguana). J Biol Rhythms. 1995;10:248–55.
4. Bennett AF, Ruben JA. Endothermy and activity in vertebrates. Science. 1979;206:649–54.
5. Burton AC. Human calorimetry II. The average temperature of the tissues of the body. J Nutr. 1935;9:261–80.
6. Kuwahara T, Inoue Y, Taniguchi M, Ogura Y, Ueda H, Kondo N. Effects of physical training on heat loss responses of young women to passive heating in relation to menstrual cycle. Eur J Appl Physiol. 2005;94:376–85. 7. Saunders AG, Dugas JP, Tucker R, Lambert MI, Noakes TD. The effects of
different air velocities on heat storage and body temperature in humans cycling in a hot, humid environment. Acta Physiol Scand. 2005;183:241–55. 8. Robinson JL. Body temperature measurement in paediatrics: Which gadget
should we believe? Paediatr Child Health. 2004;9:457–9.
9. Robinson JL, Seal RF, Spady DW, Joffres MR. Comparison of esophageal, rectal, axillary, bladder, tympanic, and pulmonary artery temperatures in children. J Pediatr. 1998;133:553–6.
10. Erickson RS, Woo TM. Accuracy of infrared ear thermometry and traditional temperature methods in young children. Heart Lung. 1994;23:181–95. 11. Lodha R, Mukerji N, Sinha N, Pandey RM, Jain Y. Is axillary temperature an
appropriate surrogate for core temperature? Indian J Pediatr. 2000;67:571–4. 12. Rubia-Rubia J, Arias A, Sierra A, Aguirre-Jaime A. Measurement of body
temperature in adult patients: comparative study of accuracy, reliability and validity of different devices. Int J Nurs Stud. 2011;48:872–80.
13. Weiss ME, Richards MT. Accuracy of electronic axillary temperature measurement in term and preterm neonates. Neonatal Netw. 1994;13:35–40. 14. Fallis WM, Christiani P. Neonatal axillary temperature measurements: a
comparison of electronic thermometer predictive and monitor modes. J Obstet Gynecol Neonatal Nurs. 2006;28:389–94.
15. Wunderlich CA. On the Temperature in Diseases: A Manual of Medical Thermometry. London: New Sydenham Soc; 1871.
16. Sund-Levander M, Forsberg C, Wahren LK. Normal oral, rectal, tympanic and axillary body temperature in adult men and women: a systematic literature review. Scand J Caring Sci. 2002;16:122–8.
17. Falzon A, Grech V, Caruana B, Magro A, Attard-Montalto S. How reliable is axillary temperature measurement? Acta Paediatr. 2003;92:309–13.
18. Chamberlain JM, Terndrup TE, Alexander DT, Silverstone FA, Wolf-Klein G, O’Donnell R, et al. Determination of normal ear temperature with an infrared emission detection thermometer. Ann Emerg Med. 1995;25:15–20. 19. Işler A, Aydin R, Tutar Güven S, Günay S. Comparison of temporal artery to
mercury and digital temperature measurement in pediatrics. Int Emerg Nurs. 2014;22:165–8.
20. Craig JV, Lancaster GA, Williamson PR, Smyth RL. Temperature measured at the axilla compared with rectum in children and young people: systematic review. BMJ. 2000;320:1174–8.
21. Charafeddine L, Tamim H, Hassouna H, Akel R, Nabulsi M, Haddock B, et al. Axillary and rectal thermometry in the newborn: do they agree? BMC Res Notes BioMed Central. 2014;7:584.
22. Mayfield SR, Bhatia J, Nakamura KT, Rios GR, Bell EF. Temperature measurement in term and preterm neonates. J Pediatr. 1984;104:271–5. 23. León C, Rodríguez A, Fernández A, Flores L. Infrared ear thermometry in the
critically ill patient. J Crit Care. 2005;20:106–10.
24. Giuffre M, Heidenreich T, Carney-Gersten P, Dorsch JA, Heidenreich E. The relationship between axillary and core body temperature measurements. Appl Nurs Res. 1990;3:52–5.
25. Kiya T, Yamakage M, Hayase T, Satoh J, Namiki A. The usefulness of an earphone-type infrared tympanic thermometer for intraoperative core temperature monitoring. Anesth Anal. 2007;105:1688–92.
26. Shibasaki M, Kondo N, Tominaga H, Aoki K, Hasegawa E, Idota Y, et al. Continuous measurement of tympanic temperature with a new infrared method using an optical fiber. J Appl Physiol. 1998;85:921–6.
27. National Heart, Lung, and Blood Institute: Losing Weight, Body Mass Index. http://www.nhlbi.nih.gov/health/educational/lose_wt/BMI/bmi_dis.htm. Accessed 23 Sep 2016.
28. Sund-Levander M, Grodzinsky E, Loyd D, Wahren LK. Errors in body temperature assessment related to individual variation, measuring technique and equipment. Int J Nurs Pract. 2004;10:216–23.
29. Thomas KA, Burr R, Wang S-Y, Lentz MJ, Shaver J. Axillary and thoracic skin temperatures poorly comparable to core body temperature circadian rhythm: results from 2 adult populations. Biol Res Nurs. 2004;5:187–94. 30. Baker FC, Waner JI, Vieira EF, Taylor SR, Driver HS, Mitchell D. Sleep and 24 h
body temperatures: a comparison in young men, naturally cycling women and women taking hormonal contraceptives. J Physiol. 2001;530:565–74.
• We accept pre-submission inquiries
• Our selector tool helps you to find the most relevant journal • We provide round the clock customer support
• Convenient online submission • Thorough peer review
• Inclusion in PubMed and all major indexing services • Maximum visibility for your research
Submit your manuscript at www.biomedcentral.com/submit