R E S E A R C H
Open Access
Classification of root canal microorganisms using
electronic-nose and discriminant analysis
Bekir H Aksebzeci
1, Musa H Asyal
ı
2*, Yasemin Kahraman
3, Özgür Er
3, Esma Kaya
4, Hatice Özbilge
4, Sad
ı
k Kara
5* Correspondence: [email protected]. tr
2Zirve University, Faculty of
Engineering, Department of Electrical & Electronics Eng., 27260 Gaziantep, Turkey
Abstract
Background:Root canal treatment is a debridement process which disrupts and
removes entire microorganisms from the root canal system. Identification of microorganisms may help clinicians decide on treatment alternatives such as using different irrigants, intracanal medicaments and antibiotics. However, the difficulty in cultivation and the complexity in isolation of predominant anaerobic microorganisms make clinicians resort to empirical medical treatments. For this reason, identification of microorganisms is not a routinely used procedure in root canal treatment. In this study, we aimed at classifying 7 different standard microorganism strains which are frequently seen in root canal infections, using odor data collected using an electronic nose instrument.
Method:Our microorganism odor data set consisted of 5 repeated samples from 7
different classes at 4 concentration levels. For each concentration, 35 samples were classified using 3 different discriminant analysis methods. In order to determine an optimal setting for using electronic-nose in such an application, we have tried 3 different approaches in evaluating sensor responses. Moreover, we have used 3 different sensor baseline values in normalizing sensor responses. Since the number of sensors is relatively large compared to sample size, we have also investigated the influence of two different dimension reduction methods on classification
performance.
Results:We have found that quadratic type dicriminant analysis outperforms other varieties of this method. We have also observed that classification performance decreases as the concentration decreases. Among different baseline values used for pre-processing the sensor responses, the model where the minimum values of sensor readings in the sample were accepted as the baseline yields better classification performance. Corresponding to this optimal choice of baseline value, we have noted that among different sensor response model and feature reduction method combinations, the difference model with standard deviation based dimension reduction or normalized fractional difference model with principal component analysis based dimension reduction results in the best overall performance across different concentrations.
Conclusion:Our results reveal that the electronic nose technology is a promising and convenient alternative for classifying microorganisms that cause root canal infections. With our comprehensive approach, we have also determined optimal settings to obtain higher classification performance using this technology and discriminant analysis.
1. Introduction
Endodontics is largely concerned with the treatment of infections originating in the root canal system. Microorganisms are the primary etiological agent for the root canal system infections and periapical lesions [1,2]. Dental infections may be successfully treated by the removal of the source of the infection [3]. Since W. D. Miller [4] demonstrated the presence of bacteria in necrotic pulp tissue, the role of the oral microflora in the pathogenesis of pulpal and periapical pathosis has become increas-ingly evident. Although more than 300 species of bacteria have been isolated from the oral cavity, only a limited number have been consistently isolated from endodontic
infections [5]. These include species of the genera Streptococcus, Fusobacterium,
Prevo-tella, Porphyromonas, Eubacterium, Peptostreptococcus, Bacteroides, and Lactobacillus
[5,6]. Several studies have also reported cultivation of fungi from endodontic infections [7,8].
Clinicians must understand the close relationship between the presence of microor-ganisms and endodontic disease process in order to develop an effective rationale for treatment. Culture and molecular methods can be used to detect bacterial species in root canal infections. Culture method identifies the predominant species of endodontic infections. Cultivation is important in terms of which microorganism the clinician is facing. Molecular techniques have been used to detect microorganism in endodontic infections using DNA-DNA hybridization analysis and polymerase chain reaction method. However, culture and molecular methods are laborious and expensive, they are often slow to provide a diagnostic result [9-13]. Especially, conventional diagnosis of anaerobic bacteria that is generally responsible for root canal infections is difficult, due to requirements of long cultivation time for these bacteria, special equipment and experienced staff. Because of difficulties in cultivation process of anaerobic microor-ganisms, identification of these microorganisms is not routinely used. Clinicians tend to resort to empiric decision making and/or treatment.
Electronic noses (e-noses) have been used for the analysis of odors or volatile organic compounds. E-noses consist of sensing and pattern recognition systems. Sensing sys-tem of an e-nose is formed as an array of chemical gas sensors. Chemical gas sensors contain a chemical detection layer and transform a chemical interaction into an electri-cal signal [14]. Selectivity of an e-nose is also related to the particular pattern recogni-tion techniques applied to the responses from the chemical gas sensors [15].
E-nose technology has been used in various microbiological studies [16-20]. In a pre-vious study, we have classified 8 different microorganism cultures in petri dishes using e-nose [21]. These microorganisms were aerobic type. In this study, we have focused on specific standard microorganism strains which are frequently encountered in root canal. Many of these microorganisms are anaerobic; so isolation and cultivation pro-cesses were relatively difficult. After all microorganism species were grown in their own specific agar, they were transferred into liquid medium. We have then taken odor samples from these microorganism suspensions and formed datasets with respect to various pre-processing and dimension reduction methods. We have obtained successful classification results using the discriminant analysis method which is used extensively in the literature.
demonstrated that use of a classification method such as discriminant analysis on odor data collected through an e-nose device is a feasible alternative for detection of micro-organisms that cause root canal infections. Secondly, with our comprehensive approach, we have determined optimal settings to obtain higher classification perfor-mance using e-nose technology and discriminant analysis.
2. Materials and Methods 2.1. Microorganisms
In this study, we have used 7 different standard microorganism strains (Candida
albi-cans, Candida glabrata, Fusobacterium nucleatum, Porphyromonas gingivalis, Pseudor-amibacter alactolyticus, Streptococcus sanguinis, Enterococcus faecalis). Microorganism strains we have grown locally (at the Faculty of Pharmacy, Erciyes University, Kayseri) belong to the American Type Culture Collection (ATCC), the German Collection of Microorganisms and Cell Cultures (DSMZ) and the Refik Saydam Culture Collection (RSKK) at Refik Saydam Hygiene Center in Ankara. Names of microorganism species, oxygen requirements, growth medium, incubation conditions and collection types are presented in Table 1. All microorganisms were grown on their specific medium in standard petri dishes at 37°C. After culturing, colonies inoculated to vials different
con-centrations were adjusted to be at 12 × 108cfu/ml (4 McFarland) in 4 ml sterile saline
solution using PhoenixSpec Nephelometer (BD Diagnostic Systems, Franklin Lakes, NJ USA) [22]. Microorganism suspensions were prepared and diluted -in sterile glass
tubes of standard size- to be of 12 × 105, 12 × 103, and 12 × 101cfu/ml concentration.
2.2. Instrumentation
The application of microorganism classification using Cyranose 320 e-nose (Smiths Detection, Hertfordshire, UK) was investigated in this study [23]. Cyranose 320 is a portable e-nose instrument, which has 32 individual carbon-black polymer composite sensors configured into an array. Measurements are based on change in the resistance of each sensor when exposed to an odor. Real-time sensor resistance values in the sen-sor array are transferred to the PC using a data cable.
Table 1 Names and descriptions of the microorganism species used in the study.
Microorganism Species O2Requirement Growth Medium Incubation
Condition
Class
Candida albicans Yeast Aerobe Sabouraud dextrose agar
24-48 hours at 37°C ATCC 90028 Candida glabrata
(Torulopsis glabrata)
Yeast Aerobe Sabouraud dextrose
agar
24-48 hours at 37°C RSKK 04019 Fusobacterium
nucleatum
Bacteria Anaerobe Anaerobic blood agar 4-6 days at 37°C DSMZ 20482 Porphyromonas
gingivalis
Bacteria Anaerobe Anaerobic blood agar 4-6 days at 37°C ATCC 33277 Pseudoramibacter
alactolyticus
Bacteria Anaerobe Anaerobic blood agar 4-6 days at 37°C DSMZ 3980 Streptococcus
sanguinis
Bacteria Facultative anaerobe
Tryptic soy agar 4 days at 37°C %5 CO2
DSMZ 20567 Enterococcus faecalis Bacteria Facultative
anaerobe
Blood agar 24 hours at 37°C ATCC
2.3. Test Procedure
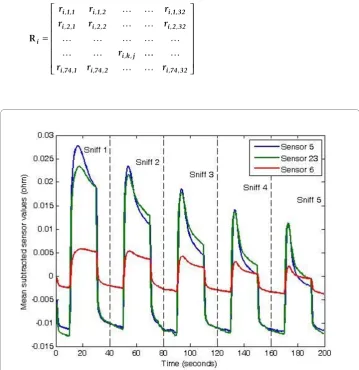
We have taken 5 repeated odor samples from each microorganism suspensions at 4 different concentration levels. That is, we have had 35 odor samples at each concentra-tion level. Before collecting odor data with the e-nose, the cap of each vial that con-tained the suspension was unscrewed and put into a sealed plastic bag. Then the probe of e-nose was inserted into the bag. We waited for 5 minutes to let the sample disperse into the bag for each data collecting process. The accompanying data acquisition soft-ware of the e-nose was set in such a way that an odor sample is collected in 40
sec-onds. Figure 1 shows data of 5 odor samples obtained fromCandida albicansat 12 ×
108 cfu/ml concentration using Cyranose 320. (Only the data belonging 3 sensors that
demonstrated maximum changes are shown.)
2.4. Data Pre-processing
An odor sample actually consists of 74 readings that include instantaneous resistance
values of 32 sensors on the e-nose. Let i= 1, 2, ..., 35 be the sample,k= 1, 2, ..., 74 be
reading, andj= 1, 2, ..., 32 be the sensor index, then each raw odor sensor data Ri=
[ri, k, j] constitute a 74-by 32 matrix.
Ri
i 1 1 i 1 2 i 1 32
i 2 1 i 2 2 i 2 32
i k j
r r r
r r r
r
=
, , , , , ,
, , , , , ,
, ,
ri 74 1, , ri 74 2, , ri 74 32, ,
⎡
⎣ ⎢ ⎢ ⎢ ⎢ ⎢ ⎢
⎤
⎦ ⎥ ⎥ ⎥ ⎥ ⎥ ⎥
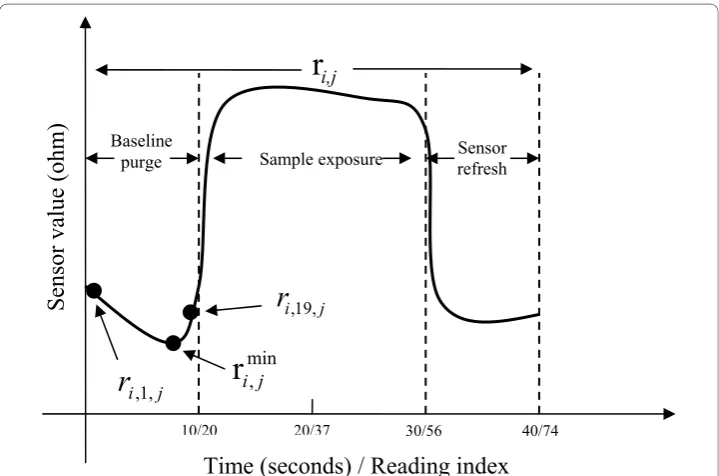
An odor sample acquisition session of 40 seconds consists of 3 phases. In the first 10 seconds, the sensors of e-nose were cleaned with indoor air (baseline purge). The first
19 rows of the sample matrix Ricorrespond to this phase. In the following 20 seconds,
the odor of microorganism suspension was applied to the sensor chamber (sample
exposure). The rows between 20 and 56 of the sample matrix Ricorrespond to this
phase. The last 10 seconds, the sensor chamber was cleaned again with indoor air (sen-sors refresh) represents the rest of the data. Figure 2 shows these 3 phases of data acquisition along with some different alternatives for the baseline value which will be used in the pre-processing.
Concerning the resistance baseline values of sensors, 3 different approaches were considered:
•Baseline Value-1: The minimum values of sensor readings in the odor sample.
Roi =Rimin (1)
•Baseline Value-2: The first values of sensor readings in the odor sample (k= 1).
Roi =[ri, ,1j]=Rfirsti (2)
•Baseline Value-3: The final values of sensor readings in the baseline purge section
of odor sample (k= 19).
Roi =[ri,19,j]=Ribp (3)
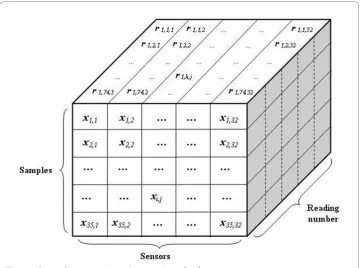
We have also used 3 different sensor response models in order to remove the time
(i.., the vertical) dimension in the sample matrix Riand convert or reduce it into a xi=
Baseline
purge Sample exposure refresh Sensor
10/20 20/37 30/56 40/74
min ,
r
i jj i
r
,1,j i
r
,19,Time (seconds) / Reading index
Sensor value
(ohm
)
i,j
r
[xi, j], 1-by-32 vector. Thus our microorganism odor dataset will be a X = [xi, j], 35-by-32 data matrix. Figure 3 shows the data cube representing our odor data.
•Difference model: The difference between maximum (Rmaxi is a row vector
con-taining the maximum element from each column of Ri.) and baseline resistance
values (Roi ) of the sensors.
xi=Rimax −Roi =ΔRi (4)
•Fractional difference model: The ratio of sensor resistance change to baseline
value.
xi= ΔR / Ri oi (5)
•Normalized fractional difference model: The normalization of fractional difference
model based on the sensor that demonstrates the maximum change.
xi=(ΔR /Ri oi) / (ΔR /Ri io)max (6)
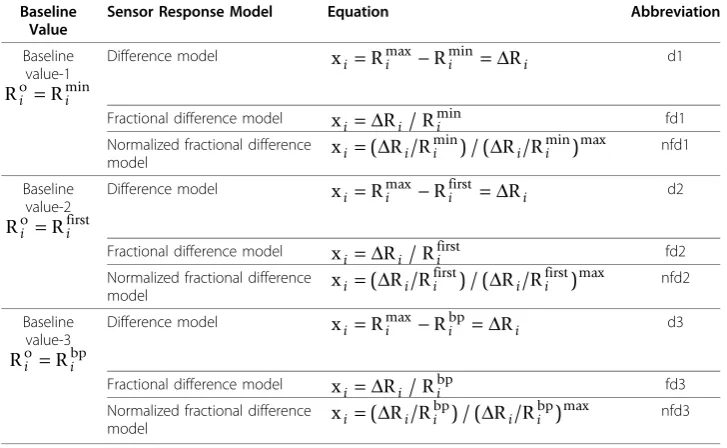
Thus total of 9 different data pre-processing methods (combinations) were applied to the odor samples from 7 microorganisms. Equations and abbreviations of these pre-processing methods are given in Table 2.
As the number of samples is relatively small compared to the feature size (35 versus 32), in order to avoid the curse of dimensionality problem and have an efficient classi-fication setting, we have employed 2 different dimension reduction methods to have only 3 features. These methods were as follows:
•Choose 3 sensors that demonstrate the maximum change on the basis of standard
deviation (std),
•Choose the first 3 principal components following the application of Principal
Components Analysis (PCA).
As a result, 18 different datasets were obtained by applying different pre-processing and dimension reduction methods to the raw odor data. Finally, 3 different Discrimi-nant Analysis (DA) methods (linear, Mahalanobis distance and quadratic) were used in order to classify each dataset into 7 groups.
2.5. Discriminant Analysis
Given a multi-category classification problem, let x denote an observation in a d
-dimensional feature space with a probability density function p(x) (evidence factor),i=
1, 2, ..., cbe the class index, andωibe the class labels indicating the true state of the
nature. In our studycis 7, since we have 7 microorganism species to be classified.
If class prior probabilities P(ωi) and the class conditional probability density
func-tions (likelihood) p(x|ωi) are known, then the posterior probabilities are calculated
using Bayes formula:
P p P
p
i i i
( | ) ( | ) ( )
( ) .
x x x
= (7)
Table 2 Equations and abbreviations of pre-processing methods.
Baseline Value
Sensor Response Model Equation Abbreviation
Baseline value-1
Roi =Rimin
Difference model x R Rmin R
i = i − i = i
max Δ d1
Fractional difference model x R / R
i = Δ i imin fd1
Normalized fractional difference
model x R /R R /R
min min
i =(Δ i i ) / (Δ i i )max nfd1
Baseline value-2
Roi =Rfirsti
Difference model xi =Rimax −Rfirsti =ΔRi d2
Fractional difference model x R / Rfirst
i = Δ i i fd2
Normalized fractional difference
model x R /R R /R
first first
i =(Δ i i ) / (Δ i i )max nfd2
Baseline value-3
Roi =Rbpi
Difference model x R Rbp R
i = imax − i =Δ i d3
Fractional difference model x R / Rbp
i = Δ i i fd3
Normalized fractional difference
model x R /R R /R
bp bp
i =( i i ) / ( i i )
max
Bayes decision rule basically assigns x to the classωi that has the highest posterior probability:
Decide if i P(i| )x >P(j| )x for all j≠i. (8)
In Eq. (7) the evidence p(x) is just a scaling factor thereby it is unimportant in the
case of decision making. For the minimum error rate classification, we can use natural logarithm transform of posterior probabilities. The following equation maximizes the posterior probability so it defines maximum discriminant function:
gi( )x =ln ( |p x i)+lnP(i). (9)
If the class conditional densitiesp(x|ωi) are multivariate normal, that is
p i d
i
i t i i
( | )
( ) | | exp(
( ) ( )
).
/ /
x x x
= 1 − − − −
2 2 1 2 2
1
(10)
where μiis the d× 1 mean vector,Σiis thed×dcovariance matrix, and |Σi| is the
determinant of the covariance matrix, then the discriminant function can be written as:
gi( )x = −12[ ln(d 2)+ln |i| (+ −x i)t i−1(x−i)]+ln (Pi). (11)
We have examined this discriminant function for three special cases [24]. All of these classification algorithms were implemented using Matlab R2007b (Mathworks Inc., Natick, MA) software [25].
Case 1: Linear
In this case, it is assumed that each class has the same (pooled) covariance matrix (i.e.,
Σi=Σ). Hencedln (2π) and |Σi| terms in Eq. (11) are independent ofi, so these can
be ignored. Then, the discriminant function becomes:
gi( )x = −12(x− i)t −1(x−i)+ln (Pi).
Then, we expand the first term on the right hand side
(x− i)t −1(x−i)=xt−1x−xt −1 i− it −1x+ it −1 i.
The quadratic term xtΣ-1 x is independent ofi, so it can be ignored too. Further,
like other terms in the expansion, xt Σ-1 μi is a scalar term and hence
(xt −1 i)t =xt −1 i = ti −1x. Thus, the discriminant function can be reduced to
the following expression which is linear in x:
gi( )x = it −1x−1 it −1 i+ln (P i).
2 (12)
Case 2: Mahalanobis Distance
In this case, the covariance matrices for all of the classes are different and the discrimi-nant function is simply the Mahalanobis distance part of Eq. (11), that is
Case 3: Quadratic
In this case, the covariance matrices are assumed to be different for different classes, i.
e., Σiis arbitrary. Only the dln(2π) ln term in Eq. (11) is independent ofi, so it can
be dropped, and the discriminant function is:
gi( )x = −1(x− i)t −i (x− i)− ln | i| ln (+ P i).
2 12
1
(14)
3. Results
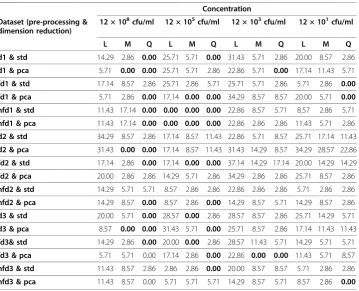
The odor data (35 samples) in certain concentrations were classified according to the type of microorganism species. Table 3 summarizes our classification results in terms of training error. For each concentration, different pre-processing and dimension reduction methods were applied to the odor data, resulting in 18 different datasets, corresponding to the rows of the table. These datasets were classified into 7 groups using linear, Mahalanobis distance, and quadratic type DA classifiers. When we
exam-ine the classification performance of 3 methods, the ‘quadratic’method consistently
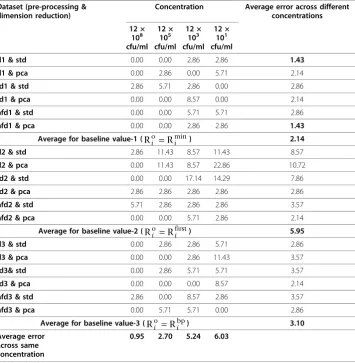
offers the best results across different concentrations, pre-processing and dimension reduction methods. Hence we have made a reduced version of Table 3, namely Table
4, where we have only included the results for the ‘quadratic classifier.’However, this
time, in order to examine the influence of different factors on the classification perfor-mance; we have included averages of classification errors across different dimensions in the table.
Table 3 Classification error rates (%) at different concentrations using Linear (L), Mahalanobis (M), and Quadratic (Q) type DA methods
Concentration Dataset (pre-processing &
dimension reduction)
12 × 108cfu/ml 12 × 105cfu/ml 12 × 103cfu/ml 12 × 101cfu/ml L M Q L M Q L M Q L M Q d1 & std 14.29 2.86 0.00 25.71 5.71 0.00 31.43 5.71 2.86 20.00 8.57 2.86
d1 & pca 5.71 0.00 0.00 25.71 5.71 2.86 22.86 5.71 0.00 17.14 11.43 5.71
fd1 & std 17.14 8.57 2.86 25.71 2.86 5.71 25.71 5.71 2.86 5.71 2.86 0.00 fd1 & pca 5.71 2.86 0.00 17.14 0.00 0.00 34.29 8.57 8.57 20.00 5.71 0.00 nfd1 & std 11.43 17.14 0.00 0.00 0.00 0.00 22.86 8.57 5.71 8.57 2.86 5.71
nfd1 & pca 11.43 17.14 0.00 0.00 0.00 0.00 22.86 2.86 2.86 11.43 5.71 2.86
d2 & std 34.29 8.57 2.86 17.14 8.57 11.43 22.86 5.71 8.57 25.71 17.14 11.43
d2 & pca 31.43 0.00 0.00 17.14 8.57 11.43 31.43 14.29 8.57 34.29 28.57 22.86
fd2 & std 17.14 2.86 0.00 17.14 0.00 0.00 37.14 14.29 17.14 20.00 14.29 14.29
fd2 & pca 20.00 2.86 2.86 14.29 5.71 2.86 34.29 2.86 2.86 25.71 8.57 2.86
nfd2 & std 14.29 5.71 5.71 8.57 2.86 2.86 22.86 2.86 2.86 5.71 2.86 2.86
nfd2 & pca 14.29 8.57 0.00 8.57 2.86 0.00 14.29 8.57 5.71 14.29 8.57 2.86
d3 & std 20.00 5.71 0.00 28.57 0.00 2.86 28.57 8.57 2.86 25.71 14.29 5.71
d3 & pca 8.57 0.00 0.00 31.43 5.71 0.00 25.71 8.57 2.86 17.14 11.43 11.43
fd3& std 14.29 2.86 0.00 20.00 0.00 2.86 28.57 11.43 5.71 14.29 5.71 5.71
fd3 & pca 5.71 5.71 0.00 17.14 2.86 0.00 22.86 0.00 0.00 11.43 5.71 8.57
nfd3 & std 11.43 8.57 2.86 2.86 2.86 0.00 20.00 8.57 8.57 5.71 2.86 2.86
nfd3 & pca 11.43 8.57 0.00 5.71 5.71 5.71 14.29 8.57 5.71 8.57 2.86 0.00
We can deduce the following results from Table 4:
•Classification performance decreases as the concentration decreases.
•Among different baseline values used while pre-processing the sensor responses,
baseline-value-1 (Roi =Rimin), where the minimum values of sensor readings in the
sample were accepted as the baseline, results in better classification performance.
Corresponding to Roi =Rimin baseline value, we note that d1 & std (i.e., difference
model with‘standard deviation based’dimension reduction) or nfd1 & pca (i.e.,
nor-malized fractional difference model with ‘PCA based’dimension reduction)
combina-tion yields the top overall performance across different concentracombina-tions which averages to 1.43%. For this combination, classification error rate is only 2.86%, even for the
low-est concentration of 12 × 101cfu/ml.
4. Discussion and Conclusion
In this study, we aimed at classification of microorganism strains that cause root canal infections using the e-nose technology. To this end, we have cultivated the
Table 4 Classification error rates (%) at different concentrations using the Quadratic DA method
Dataset (pre-processing & dimension reduction)
Concentration Average error across different concentrations 12 ×
108
cfu/ml 12 ×
105
cfu/ml 12 ×
103
cfu/ml 12 ×
101
cfu/ml
d1 & std 0.00 0.00 2.86 2.86 1.43 d1 & pca 0.00 2.86 0.00 5.71 2.14
fd1 & std 2.86 5.71 2.86 0.00 2.86
fd1 & pca 0.00 0.00 8.57 0.00 2.14
nfd1 & std 0.00 0.00 5.71 5.71 2.86
nfd1 & pca 0.00 0.00 2.86 2.86 1.43 Average for baseline value-1 (Ro R
i = imin) 2.14
d2 & std 2.86 11.43 8.57 11.43 8.57
d2 & pca 0.00 11.43 8.57 22.86 10.72
fd2 & std 0.00 0.00 17.14 14.29 7.86
fd2 & pca 2.86 2.86 2.86 2.86 2.86
nfd2 & std 5.71 2.86 2.86 2.86 3.57
nfd2 & pca 0.00 0.00 5.71 2.86 2.14
Average for baseline value-2 (Ro Rfirst
i = i ) 5.95
d3 & std 0.00 2.86 2.86 5.71 2.86
d3 & pca 0.00 0.00 2.86 11.43 3.57
fd3& std 0.00 2.86 5.71 5.71 3.57
fd3 & pca 0.00 0.00 0.00 8.57 2.14
nfd3 & std 2.86 0.00 8.57 2.86 3.57
nfd3 & pca 0.00 5.71 5.71 0.00 2.86
Average for baseline value-3 (Ro Rbp
i = i ) 3.10
Average error across same concentration
microorganisms of interest at laboratory conditions at different concentrations and obtained odor data samples. Then, we have designed DA classifiers and observed their classification performance under different conditions, in order to assess the influence of baseline values, sensor response models, and dimension reduction methods.
Our first finding is that the quadratic type DA outperforms the other two DA vari-eties, namely linear and Mahalanobis. This is somewhat expected, as the quadratic method lets different classes have different covariance matrices, it has more modeling capability. We still wanted to check the performance of simpler methods in order to understand the complexity of the classification problem that we are dealing with. After deciding on the quadratic DA method as the method of choice, we have looked into the influence of different factors on the classification performance. Our second finding is that as the concentration increases the classification performance improves. This is also expected, as the sensor responses will have higher amplitudes at higher microor-ganism suspension concentrations.
In the user’s manual of the Cyranose 320 e-nose instrument, there is no specific
explanation regarding the value that should be taken as the baseline value. Therefore, we have also wanted to look into the effect of using different alternatives for the
base-line value (Roi ) while computing the sensor responses using formulas 1, 2, or 3. Our
results revealed that the best baseline value is baseline-value-1 (Roi =Rimin), in terms
of achieving a better classification performance using quadratic DA. In fact, as we observe in Tables 3 and 4, the choice of baseline value significantly affects the
classifi-cation performance. For the choice of‘baseline value-1’, we note that d1 & std (i.e.,
dif-ference model with standard-deviation-based dimension reduction) or nfd1 & pca (i.e., normalized fractional difference model with PCA-based dimension reduction) combi-nations offer better classification performance, compared to other pre-processing and dimension reduction method combinations.
we have opted for 5-fold Cross Validation (CV) technique, where overall set of training samples is randomly divided into 5 approximately equal size and balanced (i.e., the dis-tribution of samples into different classes is roughly similar) subsets. Then, each time, one of these subsets is excluded from the overall training set and used as a test set for the classifier that is trained based on the rest of the samples and the resultant test error rates are averaged to obtain the 5-fold CV error rate. Compared to training error, estimation of 5-fold CV classification error is more costly computationally. Therefore, we have carried out 5-fold CV classification error estimation for the
exemp-lary case of 12 × 108cfu/ml concentration and obtained a CV error rate of less than %
25, for the optimal pre-processing and dimension reduction combination that we have identified before. We envision that even a classification of accuracy of about 75% will be very appealing for the clinicians who tend to resort to empiric decision making in treatment of root canal infections, due to current limitations in the practice.
As for the issue of the existence of multiple microorganism species in the medium, we note that the decision made by our approach will reflect the major or dominant microorganism species in the medium. However, we can use the raw discriminant values as the probability of the sample under question belonging to each of the indivi-dual classes, instead of taking the maximum value of the discriminant function as the
‘class decision.’ This way, the clinician may see the probability of existence of each
microorganism species in the medium and decide about the course of treatment accordingly. If we include the class prior probabilities, i.e., the prevalence of each microorganism species in the root canal, in computation of the discriminant function, classification performance of our approach may further improve. We are planning to look into this issue in a future clinical study.
In conclusion, we have demonstrated that the e-nose technology is a promising and convenient alternative for classifying microorganisms that cause root canal infections. With our comprehensive approach, we have also determined optimal settings in terms of which classification, pre-processing and dimension reduction methods to be used, to obtain higher classification performance using this technology. This comprehensive study is done only once to fine tune to parameters of this approach. We will use these pre-determined optimal settings or parameters in our future studies involving classifi-cation of real clinical cases. In consultation with the clinicians in our team, we will develop some suitable settings to collect odor data in a practical and efficient manner.
Acknowledgements
This study has been supported by the Fund for Scientific Research Projects of Erciyes University (Project No: FBT-07-14 and SBT-07-38).
Author details
1
Erciyes University, Faculty of Engineering, Department of Electrical & Electronics Eng., 38039 Kayseri, Turkey.2Zirve University, Faculty of Engineering, Department of Electrical & Electronics Eng., 27260 Gaziantep, Turkey.3Erciyes University, Faculty of Dentistry, Department of Conservative Dentistry and Endodontics, 38039 Kayseri, Turkey.4Erciyes University, Faculty of Pharmacy, Department of Microbiology, 38039 Kayseri, Turkey.5Fatih University, Faculty of Engineering, Department of Electrical & Electronics Eng., 34500 Istanbul, Turkey.
Authors’contributions
Competing interests
The authors declare that they have no competing interests.
Received: 2 February 2010 Accepted: 22 November 2010 Published: 22 November 2010
References
1. Naür R, Sjögren U, Gunthild K, Kahnberg KE, Sundqvist G:Intraradicular bacteria and fungi in root-filled,
asemptomatic human teeth with therapy-resistant periapical Lesions: A long-term light and electron microscopic follow-up study.J Endod1990,16(12):580-588.
2. Sundqvist G, Sohansson E, Sjögren U:Prevalance of black pigmented bacteroides species in root canal infections.J Endod1989,15:13-19.
3. Barker GR, Qualtrough AJE:An investigation into antibiotic prescribing at a dental teaching hospital.Br Dent J1987,
162:303-6.
4. Miller WD:The micro-organisms of the human mouth.Basel S. Karger; 1973.
5. Sundqvist G:Taxonomy, ecology, and pathogenicity of the root canal flora.Oral Surg Oral Med Oral Pathol1994,
78:522-530.
6. Le Goff A, Bunetel L, Mounton C, Bonnaure-Mallet M:Evaluation of root canal bacteria and their antimicrobial susceptibility in teeth with necrotic pulp.Oral Microbiol Immunol1997,12:318-322.
7. Peciuliene V, Reynaud AH, Balciuniene I, Haapasalo M:Isolation of yeast and enteric bacteria in root-filled teeth with chronic apical periodontitis.Int Endod J2001,34:429-434.
8. Sundqvist G, Fidgor D, Persson S, Sjögren U:Microbiologic analysis of teeth with failed endodontic treatment and the outcome of conservative retreatment.Oral Surg Oral Med Oral Pathol1998,85:86-93.
9. Sixou M:Diagnostic testing as a supportive measure of treatment strategy.Oral Dis2003,1(9 Suppl):54. 10. Fredricks DN, Relman DA:Application of polymerase chain reaction to the diagnosis of infectious diseases.Clin
Infect Dis1999,29:475.
11. Relman DA:Emerging infections and newly-recognised pathogens.Neth J Med1997,50:216.
12. Tang Y-W, Procop GW, Persing DH:Molecular diagnostics of infectious diseases.Clin Chem1997,43:2021. 13. Zoetendal EG, Collire CT, Koike S, Mackie RI, Gaskins HR:Molecular ecological analysis of the gastrointestinal
microbiota: a review.J Nutr2004,134:465.
14. James D, Scott SM, Zulfiqur A, O’Hare WT:Chemical sensors for electronic nose systems.Microchimica Acta2005,
149:1-17.
15. Scott SM, James D, Ali Z:Data analysis for electronic nose systems.Microchimica Acta2007,156:183-207. 16. Gibson TD, Prosser O, Hulbert JN, Marshall RW, Corcoran P:Detection and Simultaneous Identification of
Microorganisms from Headspace Samples Using an Electronic Nose.Elsevier Sensors and Actuators1997,44:413-422. 17. Dutta R, Hines EL, Gardner JW, Boilot P:Bacteria classification using Cyranose 320 electronic nose.BioMedical
Engineering OnLine2002, 1-4.
18. Boilot P, Hines EL, Gardner JW, Pitt R, John S, Mitchell J, Morgan DW:Classification of bacteria responsible for ENT and eye infections using the Cyranose system.IEEE Sensors Journal 22002,3:247-253.
19. McEntegart CM, Penrose WR, Strathmann S, Stetter JR:Detection and discrimination of coliform bacteria with gas sensor arrays.Elsevier Sensors and Actuators B2000,70:170-176.
20. Pavlou A, Turner APF, Magan N:Recognition of anaerobic bacterial isolates in vitro using electronic nose technology.Letters in Applied Microbiology2002,35:366-369.
21. Kara S,et al:Medical Application of Information Gain Based Artificial Immune Recognition System (IG-AIRS): Classification of Microorganism Species, Expert Systems with Applications.2009,36(3, Part 1):5168-5172. 22. Web address of information about the PhoenixSpec Nephelometer:
[http://www.bd.com/ds/productCenter/IS-PhoenixInstrumentationAccessories.asp].
23. Web address of information about the Cyranose 320:[http://www.smithsdetection-sci.com/eng/262.php]. 24. Duda RO, Hart PE, Stork DG:Pattern Classification.2 edition. John Wiley & Sons; 2000.
25. Web address of information about the Matlab software:[http://www.mathworks.com].
26. Asyali MH:Gene expression profile class prediction using linear Bayesian classifiers, Computers in Biology and Medicine.2007,37(12):1690-1699.
27. Jain AK, Duin RPW, Jianchang M:Statistical pattern recognition: A review.IEEE Trans Pattern Anal Mach Intell2000,
22(1):4-37.
doi:10.1186/1475-925X-9-77
Cite this article as:Aksebzeciet al.:Classification of root canal microorganisms using electronic-nose and