Available Online at www.ijpret.com 1762
INTERNATIONAL JOURNAL OF PURE AND
APPLIED RESEARCH IN ENGINEERING AND
TECHNOLOGY
A PATH FOR HORIZING YOUR INNOVATIVE WORK
DATA CLASSIFICATION ALGORITHMS
VITISHA CHHAJED, CHANDRANI ROY, GARIMA CHAUDHARY
CS Dept, NMIMS University, Shirpur
Accepted Date: 05/03/2015; Published Date: 01/05/2015
Abstract: Classification is a model finding process that is used for portioning the data into
different classes according to some constrains. In other words we can say that classification is process of generalizing the data according to different instances. Several major kinds of classification algorithms include C4.5, k-nearest neighbor classifier, Naive Bayes, SVM, Apriori, and Ada Boost. In this paper with each algorithm, we provide a description of the algorithm, discuss the advantages and limitations of the algorithm, review current and further research on the algorithm.
Keywords: Classification, Data Mining, kNN, C4.5, Apriori, Naive Bayes, SVM, EM
Corresponding Author: MS. VITISHA CHHAJED
Access Online On:
www.ijpret.com
How to Cite This Article:
Vitisha Chhajed, IJPRET, 2015; Volume 3 (9): 1762-1773
Available Online at www.ijpret.com 1763 INTRODUCTION
Data mining is a process of inferring knowledge from huge data. Data Mining is needed to make sense and use of data. People often do mistakes while analyzing or possibly when trying to establish relationships between multiple features. This makes it difficult for them to find solutions to certain problems. Data Mining has three major components Clustering or Classification, Association Rules and Sequence Analysis. An Association rule is a rule which implies certain association relationships among a set of objects in a database. In this process we discover a set of association rules at multiple levels of abstraction from the relevant set of data in a database. For example, one may discover a set of symptoms often occurring together with certain kinds of diseases and further study the reasons behind them. Since finding interesting association rules in databases may disclose some useful patterns for decision support, selective marketing, financial forecast, medical diagnosis, and many others applications, it has attracted a lot of attention in re- cent data mining research. Mining association rules may require iterative scanning of large transaction or relational databases which is quite costly in processing. In Sequential Analysis, we seek to discover pat- terns that occur in sequence. This deals with data that appear in separate transactions. For example: If a shopper buys item A in the first week of the month, then s/he buys item B in the second week etc. In Classification/clustering we analyze a set of data and generate a set of grouping rules which can be used to classify future data. For example, one may classify diseases and provides the symptoms which describe each class or subclass. This has much in common with traditional work in statistics and machine learning. However, there are important new issues which arise because of the sheer size of the data. One of the important problem in data mining is the Classification- rule learning which involves finding rules that partition given data into predefined classes
Classification Model:-
The different type of classification models are as follows:
1. Decision tree.
2. Neural network.
Available Online at www.ijpret.com 1764 1.1 C4.5 ALGORITHM
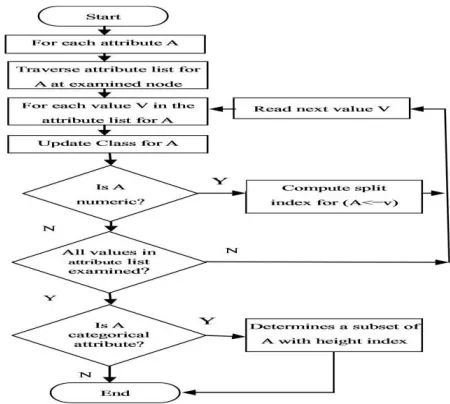
Systems that construct classifiers are one of the commonly used tools in data mining. Such systems take as input a collection of cases, each belonging to one of a small number of classes and described by its values for a fixed set of attributes, and output a clas- sifier that can accurately predict the class to which a new case belongs.C4.5 generates classifiers expressed as decision trees.
Given a set S of cases, C4.5 first grows an initial tree 1 using the divide-and-conquer algorithm as follows: If all the cases in S belong to the same class or S is small, the tree is a leaf labeled with the most frequent class in S. Otherwise, choose a test based on a single attribute with two or more outcomes. Make this test the root of the tree with one branch for each outcome of the test, partition S into corresponding subsets S1, S2 according to the outcome for each case, and apply the same procedure to each subset
Figure 1: Working of C4.5 algorithm
1.1.1 Limitations
Some limitations of C4.5 Algorithm are:
Available Online at www.ijpret.com 1765 potential branches to build a decision tree. But all of them are not significant for classification task.
(c) Over fitting: Over fitting happens when algorithm model picks up data with uncommon characteristics. This cause many fragmentations in the process distribution. Statistically insignificant nodes with very few samples are known as fragmentations. Generally C4.5 algorithm constructs trees and grows it branches. This strategy performs well with noise free data. But most of the time this approach over fits the training examples with noisy data.
1.2 KNN ALGORITHM
In 1968, Cover and Hart proposed an algorithm the K-nearest Neighbor, which was finalized after some time. K-Nearest Neighbor can be calculated by calculating Euclidian distance, although other measures are also available but through Euclidian distance we have splendid mixture of ease, efficiency and productivity Suppose that an object is sampled with a set of different attributes, but the group to which the object belongs is unknown. Assuming its group can be determined from its attributes; different algorithms can be used to automate the classification process. A nearest neighbor classifier is a technique for classifying elements based on the classification of the elements in the training set that are most similar to the test ex- ample. With the k-nearest neighbor technique, this is done by evaluating the k number of closest neighbors. In pseudo code, k-nearest neighbor classification algorithm can be expressed fairly compactly : k is the number of nearest neighbors for each object X in the test set do Calculate the distance D(X,Y) between X and every object Y in the training set neighborhood the k neighbors in the training set closest to X X. class :Select Class(neighborhood) end for Distance and Similarity metrics: While the terms similarity metric and distance metric are often used to refer to any measure of affinity between two objects, the term metric has a formal meaning in mathematics. A metric must conform to the following 4 criteria (where d(x, y) refers to the distance between 2 objects x and y):
1. d(x, y) ≥ 0; non-negativity
2. d(x, y) = 0onlyif x = y; identity
3. d(x, y) = d(y, x); symmetry
Available Online at www.ijpret.com 1766 1.2.1 Advantages
1. KNN classifiers have paved an important path for classification of data in biometrics like iris detection, signature verification.
2. If compared with different distances Euclidean distance has higher efficiency as compared to other distances.
3. If compared with Bayes algorithm K-Nearest neighbor algorithm again maintains its efficiency.
4. The KNN classifier is one of the most popular neighborhood classifier in pattern recognition.
5. A innovative method to improve the classification
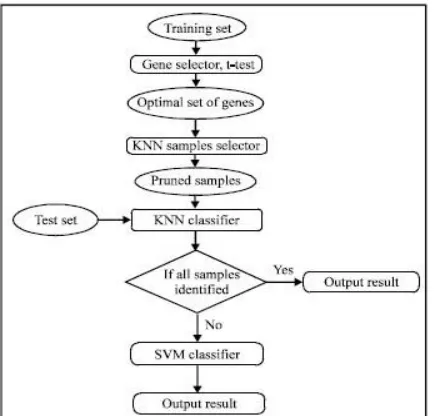
Figure 2: Working of KNN algorithm performance of KNN using Genetic Algorithm (GA) is being implemented.
1.2.2 Limitations
1. Great calculation complexity.
2. Fully dependent on training set.
Available Online at www.ijpret.com 1767 4. The cost of the optimal solution decreases with in- creasing k till it hits zero when the number of clusters equals the number of distinct data-points. This makes it more difficult to
(a) Directly compare solutions with different numbers of clusters.
(b) To find the optimum value of k.
1.3 SUPPORT VECTOR MACHINE ALGORITHM
The aim of SVM is to find the best classification function to distinguish between members of the two classes in the training data. The metric for the con- cept of the best classification function can be realized geometrically. It offers one of the most robust and accurate methods among all well-known algorithms. It has a sound theoretical foundation, requires only a dozen examples for training, and is insensitive to the number of dimensions.
1.3.1 Algorithm
A linear classification function corresponds to a separating hyper plane f (x) that passes through the middle of the two classes, separating the two. Once this function is determined, new data instance xn can be classified by simply testing the sign of the function
f (xn); xn belongs to the positive class if f (xn) ≥ 0.
1.3.2 Limitations
The limitation is SVM is its computational inefficiency.
1.3.3 When to use
SVM is capable of doing both classification and regression. Non-linear SVM calculates the boundary that is not a straight line. The benefit is that we can capture much more complex relationships between the data- points without having to perform difficult transformations on our own. The downside is that the training time is much longer as it’s much more computationally intensive.
1.4 APRIORI ALGORITHM
Available Online at www.ijpret.com 1768 of an iterative approach known as breath-first search, where k-1 item set are used to search k item sets. There are two main steps in Apriori.
1) Join - The candidates are generated by joining among the frequent item sets level-wise.
2) Prune- Discard items set if support is less than min- imum threshold value and discard the item set if its subset is not frequent.
1.4.1 Algorithm
Let the set of frequent item sets of size k be Fk and their candidates be Ck. Apriori first scans the database and searches for frequent itemsets of size 1 by accumulating the count for each item and collecting those that satisfy the minimum support requirement. It then iterates on the following three steps and extracts all the frequent item sets.
1. Generate Ck+1, candidates of frequent itemsets of size k +1, from the frequent itemsets of size k.
2. Scan the database and calculate the support of each candidate of frequent item sets.
3. Add those itemsets that satisfies the minimum support requirement to Fk+1.
It is evident that Apriori scans the database at most (kmax+1) times when the maximum size of frequent itemsets is set at kmax.
Apriori(T,)
L1 ≺ −large1 − itemsets k ≺ −2
whileLk − 1 = 0
Ck ≺ −a ∩ b|a ∈ Lk − 1 ∩ b ∈ U Lk − 1 ∩ b ∈/ a
for transaction t ∈ T
Ct ≺ −c|c ∈ Ck ∩ c ⊆ t
for candidatesc ∈ Ct
count[c] ≺ −count*c+ + 1
Available Online at www.ijpret.com 1769 k ≺ −k + 1
return S Lk
1.4.2 Advantage
1 .It is very easy and simple algorithm.
2. Its implementation is easy.
1.4.3 Disadvantage
1. It does multiple scan over the database to generate candidate set.
2. The numbers of database passes are equal to the max length of frequent item set.
3. For candidate generation process it takes more mem- ory, space and time.
1.5 EXPECTATION-MAXIMIZATION ALGORITHM
First of all let us see what types of problems can be solved by using this algorithm. We all know the main problem faced in signal processing is the estimation of the mean of a signal in noise. This is where the EM algorithm is best suited. The EM algorithm consists of two major steps:
1. An expectation step: The expectation is done with respect to the unknown underlying variables by using the current estimates of the parameters and conditions upon the observations.
2. Followed by a maximization step: The maximize step then provides new estimates of the parameters. The two steps are iterated until they converge or become same.
1.5.1 Algorithm
Available Online at www.ijpret.com 1770 observed data. The expected value of x(1), given the measurement y(1) and based upon the current estimate of the parameter, may be computed as
x(1)[k + 1] = E[x(1)|y(1), p[k]]
Maximization Step (M-step): Use the data from the expectation step as if it were actually measured data to determine an ML estimate of the parameter. This estimated data is sometimes called”imputed” data. The ML estimation is calculated by the formula:
P [k + 1] = logf (x(1)[k + 1], x(2)[k + 1], x(n)|p)
1.5.2 Application
1. Emission tomography Image reconstruction of body:
Available Online at www.ijpret.com 1771 2. Active noise cancellation:
Active noise cancellation is accomplished by measuring a noise signal and using a speaker driven out of phase with the noise to cancel it. In many traditional ANC techniques, two microphones are used in conjunction with an adaptive filter to provide cancellation. Using the EM algorithm, ANC may be achieved with only one microphone.
3. HMM:
HMM stands for hidden Markov model. It is a non-deterministic model of a process that exhibits features that change over time. It has been applied in a broad variety of sequential pattern recognition problems such as speech recognition and handwriting recognisition. The EM algorithm is used to determine the initial state and transition probabilities. The EM algorithm has also been widely used in econometric, clinical, and sociological studies that have unknown factors affecting the outcomes.
1.5.3 When to use
The EM algorithm may be employed when there is an underlying set with a known distribution function that is observed by means of a many-to-one mapping.
1.6 NAIVE BAYES
The naive Bayes classifier greatly simplify learning by assuming that features are independent of given class. In practice naive Bayes often competes well with more sophisticated classifiers. Bayesian classifiers use Bayes theorem, which says-
1.6.1 Advantage
1. The algorithm is easy to implement. 2. Good results obtained in most of the cases.
1.6.2 Disadvantage
Available Online at www.ijpret.com 1772 1.6.3 When to use
The problem of judging documents as belonging to one category or the other (such as spam or legitimate, sports or politics, etc.) with word frequencies as the features can be solved more competitively with the help of nave bayes other than SVM.
2 CONCLUSION
These classification algorithms can be implemented on different types of data sets like data of patients, financial data according to performances. On the basis of the performance of these algorithms, these algorithms can also be used to detect the natural disasters like cloud bursting, earthquake, etc. If your training set is small, high bias/low variance classifiers (e.g., Naive Bayes) have an advantage over low bias/high variance classifiers (e.g., kNN or logistic regression), since the latter will over fit.
ACKNOWLEDGEMENT
First and foremost, we would like to thank Dr. N. S. Choubey Sir for his constant support and encouragement from deciding the topic to completion of paper. He kindly read the paper and offered some detailed advices on organization of paper. He also helped us in learning latex by providing some videos and lectures. Secondly we would like to thank Prof. Varsha Nemade Ma’am for helping us in coding of Latex. Finally, we sincerely thank our parents, siblings and friends who provided advice.
REFERENCES
1. XindongWu , Vipin Kumar , J. Ross Quinlan ,Joy- deep Ghosh , Qiang Yang ,Hiroshi Motoda , Geof- frey J. McLachlan , Angus Ng , Bing Liu , Philip S ,Yu Zhi-Hua Zhou , Michael Steinbach David J. Hand , Dan Steinberg, ” Top 10 algorithms in data mining” , Springer-Verlag London Limited 2007.
2. Raj Kumar, Dr. Rajesh Verma ,” Classification Al- gorithms for Data Mining: A Survey”, Vol. 1 Issue 2 August 2012.
3. Nitin Bhatia and Vandana,” Survey of Nearest Neighbor Techniques”, Vol. 8, No. 2, 2010, Inter- national Journal of Computer Science and Infor- mation Security.
Available Online at www.ijpret.com 1773 5. Mohammed Sharif and Donald H Burn,” Devel- opment and application of k-nearest neighbour on weather generating model”, Montreal, Qc, Canada, June 16-18 2004.
6. Padraig Cunningham and Sarah Jane Delany,” k- Nearest Neighbour Classifiers”, Technical Report UCD-CSI-2007-4, March 27, 2007.
7. Steve R. Gunn,” Support Vector Machine for Clas- sification and regression”, Faculty of Engineering, Science and Mathematics School of Electronics and Computer Science, 10 May 1998.
8. Ms. Rina Raval, Prof. Indr Jeet Rajput, Prof. Vinitkumar Gupta,” Survey on several improved Apriori algorithms”, Volume 9, Issue 4 (Mar. - Apr. 2013), IOSR Journal of Computer Engineering.
9. Shingyu Leung, Gang Liang, Knut Solna, and Hongkai Zhao,” Expectation-Maximization Algo- rithm with Local Adaptivity” ,Society for Indus- trial and Applied Mathematics,2009.
10.”The Expectation-Maximization Algorithm”, IEEE Signal Processing Magazine, November 1996.
11.Sonali Agarwal, G. N. Pandey, and M. D. Ti- wari,” Data Mining in Education: Data Classifica- tion and Decision Tree Approach”, International Journal of Education, Business, e-Management and e-Learning, Vol. 2, No. 2, April 2012.