Please cite this article as: H. Rahimi Mirazizi, M. Agha Shafiyi, Evaluating Technical Requirements to Achieve Maximum Power Point in PV Powered Z-Source Inverter, International Journal of Engineering (IJE), IJE TRANSACTIONS C: Aspects Vol. 31, No. 6, (June 2018) 921-931
International Journal of Engineering
J o u r n a l H o m e p a g e : w w w . i j e . i rEvaluating Technical Requirements to Achieve Maximum Power Point in
Photovoltaic Powered Z-Source Inverter
H. Rahimi Mirazizi*, M. Agha Shafiyi
Department of Electrical Engineering, SAB Technical College of the SBU, Tehran, Iran
P A P E R I N F O
Paper history:
Received 06 October 2017
Received in revised form 25 October 2017 Accepted 06 February 2018
Keywords:
Maximum Power Point Tracking Algorithm Input Resistance
Z-Source Inverter Photovoltaic Panel Multi-level Inverter
A B S T R A C T
One of the key challenges of employing photovoltaic systems is to extract maximum power of the panels. This problem is known as maximum power point tracking (MPPT) technique. The MPPT stands for establishing situation in which output power of the panels reaches its maximum allowable power. In this context, this paper is to assess the technical requirements to achieve maximum output power of a number of photovoltaic (PV) panels in Z-source inverters. For the sake of simplicity and without loss of generality, a generic 7-level Z-source multi-level inverter to use with the PV panels is considered for our purpose. The conducted assessment is performed in terms of the analysis of the input resistance of the connected inverter. The simulation results showed that achieving the maximum power point (MPP) depends on the various governing factors including components of the inverter (i.e. load, frequency switching, and electric elements value), irradiance level, ambient temperature, and partial shading effect. Also, as the results demonstrate, in a number of combinations of the conditions there is not an optimum situation in terms of achieving MPPT. In addition, major parts of the findings are implemented on a practical system.
doi: 10.5829/ije.2018.31.06c.09
1. INTRODUCTION1
In the past decades, the growing environmental concerns and simultaneously depletion of the fossil fuels have been promoted deployment of the renewable energy resources [1]. In this context, the energy from sun, i.e. solar energy, has been attracted a special focus. The reasons behind this fact is possessing distinguished features including clean electrical energy production, vast and abundant resources on the earth, without any noisy pollution mechanism and less maintenance requirements, with the static power generation equipments, and minimum ecosystem destruction [2]. Photovoltaic (PV) arrays are the most common tools to extract the solar energy. Nowadays, electric energy production from these arrays in various power ratings ranging from some Kilowatts to Megawatts is a common practice as its worldwide deployment demonstrates [3]. Producing electric power in these
*Corresponding Author Email: [email protected] (H. Rahimi
Mirazizi)
arrays is a function of various factors. One of the key challenges of employing photovoltaic systems is to extract maximum power of the panels. This problem is known as maximum power point tracking (MPPT) technique. The main objective of a MPPT algorithm to be used in a PV system is to extract maximum allowable power of the panel by means of in hand parameters and situations [4].
hardware, and accuracy in achieving MPP. For example, The Inc Cond, is only digitally implementable method, P&O and Hill-Climbing methods are the simplest ones in structure, and Fuzzy Logic Control and Neural Network methods have the highest rate of convergence [13, 14].
In the above mentioned techniques, it is not possible to realize the MPPT algorithm at many conditions. To achieve this goal (realization of MPPT algorithm), it is necessary to measure the input resistance of the converters. In order to transfer the maximum power from the panels to the circuit, this resistance should be equal to the inverse slope of the output resistance curve of the panels obtained from the I-V characteristic of the panel intersecting MP point. A few works have been published in this regard. Rosan et al. [15, 16] dicussed the idea of controlling the input resistance of a switching boost converter which is introduced to track the MPP of a PV panels. A novel MPP tracker algorithm for PV systems employing just a single voltage sensor presented in literature [17, 18]. In these works, the MPPT is achieved by taking advantage of the steady state behaviour of the input resistance characteristic of the basic DC-DC converter. A MPPT algorithm based on analysing input resistance is considered while taking into account variable weather parameters [19]. It has been reported in literature [20, 21], input resistance area of the buck, boost, and buck-boost converters are illustrated and by defining a “non-capture zone”, the area in which there is no achievement of the maximum power point is specified. The input resistance of PWM DC-DC conventional converters (buck, boost, and buck-boost converters) in both voltage mode control and current mode control are reported in literature [22].
In all of the surveyed literature in the preceding paragraph for the realization of the maximum power point, other environmental conditions such as level of the sun irradiance, ambient temperature, and partial shading effect are not investigated. Also, the condition in which there is not a feasible situation in terms of MPPT is not addressed. The aim of the current paper is to shed light on these two research gaps. In other words, this paper is to analysis the technical requirements to achieve maximum power point in PV powered Z-source inverters. It is proved that accessibility or inaccessibility to MPP in such inverters depends on the parameters and elements of the circuit as well as the environmental conditions. The inverter considered in this paper is a single-stage one which increases input voltage and also enables achieving maximum power point [23]. The proposed assessment is based on the analysis of the inverter input resistance. To this end, the input resistance of the two ends of inverter-feeding panels using circuit methods and Laplace Transform is calculated. Then, the variations range of resistance
observed from the two ends of the panels under various scenarios and conditions were examined. Also by modelling the I-V curve of the PV panels in presence of environmental changes and partial shading effect and match it with the input conductance area of the Z-source inverter, realization of MPPT algorithm is evaluated. Finally, the proposed method is applied in practical 1kW seven-level Z-source multi-level inverter (7-Z-source MLI) and the results in various circuit scenarios, sun irradiance, ambient temperature conditions, and partial shading effect with and without bypass diodes are discussed.
This paper excluding introduction is organized as follows. In the Section II, analysis of Z-source inverter circuit is demonstrated. In Section III, the input resistance calculation method is detailed. The case study, simulations, testing the model in practical conditions and results are addressed in the Section IV. Finally, the conclusion is drawn in the Section V.
2. ANALYSIS OF Z-SOURCE INVERTER CIRCUIT
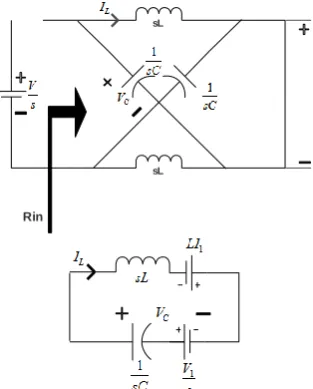
As shown in Figure 1a, in order to analyse the circuit of a Z-source inverter, the input resistance of the circuit should be extracted first [24-26]. In other words, the resistance seen from the terminals of the PV panels should be calculated. The resistance of the Z-source network has two different states including shoot through zero state (STZS) and active state. Analyzing these states is presented in the following. In addition, diagrams of the inductor’s current and the capacitor’s voltage of the Z-source inverter in steady state required for further calculations are presented in Figures 1b and 1c.
2. 1. STZS Resistance Analysis A Z-source
network model in STZS state is shown in Figure 2. As in the figure, the circuit equations in Laplace Transform space at steady state by KVL low are:
(1)
(2)
(3)
(4)
L
L C
C
Cp
P
V
P
a
n
e
ls
-Leg-Inverter Z-Source
Rin Vin
Vout
S
S
S
S R
(a)
(b)
(c)
Figure 1. (a) A Z-source inverter’s circuit schematic (b)
Diagrams of the capacitor’s voltage in steady state (c)
Diagrams of the inductor’s current in steady state
Inverter network and load is equalized with a resistance with a very good approximation for simplicity purposes. Considering that in the actual systems the loads are usually a combination of many resistors and inductors, it should be modelled as an R-L load. This makes the equations complex so that obtaining an exact equation parametrically is not possible. In this case, the equation can be only obtained by the simulation. Thus, obtaining a resistance model can eliminate these difficulties by providing a high accuracy model.
As a result, after simplification of the equations, we have:
(5)
(6)
(7)
sL
sL
Rin
Figure 2. Z-source network model in STZS state
sL
sL
R
Rin
R
Figure 3. Z-source network model in active state
(8)
In order to simplify the equations, we define the following variables:
(10)
Therefore, by placing the limit states of circuit (maximum and minimum values of capacitor’s voltage and inductor’s current), we have:
(11)
(12)
(13)
(14)
Which is a four-variable equation and can be written as a matrix as follows:
(15)
By solving the equation using MATLAB, the unknown values (limits, voltage and current) will be obtained.
3. CALCULATING INPUT RESISTANCE OF THE INVERTER
Using the results from the previous equations, the output voltage and input current of the inverter at any point of time can be obtained according to the following equations:
(16)
So:
(17)
In high frequencies, the output will be:
(18)
which is a well-known equation to model Z-source inverter with very little wave-formed ripples.
To calculate the input resistance of the converter, it is necessary to determine its input current. Thus input current of the inverter is:
(19)
Now, input resistance of the inverter over time can be calculated:
(20)
And conductivity is:
So:
(21)
From Equation (21), minimum and maximum values of the input conductivity are:
(22)
(23)
In the above equation:
(24)
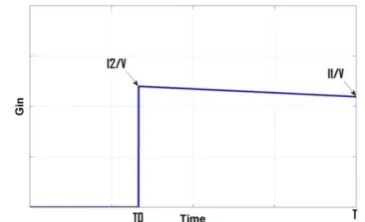
An example of the conductivity observed in the inverter inputs is parametrically illustrated in Figure 4.
The effective conductance seen in the chopper circuits is equal to the average current divided by the source voltage [27]. In other words, it is equal to the average value of the input conductance of Gin curve.
Therefore, MPPT algorithm considers the average value of input conductivity to actualize MPP. So according to Figure 4:
(25)
For simplicity purposes, linear approximation of the hyperbolic equations which carries little error is used. Eventually, we have:
(26)
As the resulting equations indicate, maximum power point by changing D (duty cycle) is achieved. Also, variables G1 and G2 are dependent on D. Therefore, the above equation is a thoroughly nonlinear equation and the achievable D in MPP by numerical methods can be calculated. Figure 5 presents an example of these equations concept as well as conductivity variation range by changing D in Z-source inverter. As indicated by Equation (26), changing conductance will result in to produce an area. It should be noted that the variations in conductance is caused by minimum and maximum duty cycle (Dmin and Dmax). Also, if the MPP of the panel’s I-V curve is within the minimum and maximum conductivity range, achieving maximum power is possible and vice versa. In other words, under certain working conditions of the inverter, there may be a D that MPPT algorithm works accurately or such a D may not exist. In continue simulations and experimental results with different aspects are described.
4. SIMULATIONS AND EXPERIMENTAL RESULTS
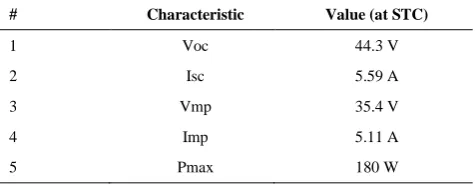
In this section, firstly, the achieved formulas are simulated and then results of the test on a real world system are presented. In the simulations, the actual properties of a PV panel are used. The actual panel’s properties are shown in Table 1.
Figure 5. Typical diagram of conductivity variation range in
Z-source inverter input with panel’s I-V curve
TABLE 1. Electrical Characteristic of Panels (Hanwha Solar
One-Qidong-SF 160-24-1M180)
# Characteristic Value (at STC)
1 Voc 44.3 V
2 Isc 5.59 A
3 Vmp 35.4 V
4 Imp 5.11 A
5 Pmax 180 W
In Table 1, all technical data is at Standard Test Conditions (STC), Irradiance level 1000 W/m2,
spectrum AM 1.5, and cell temperature 25° C.
By using real panel’s data, the nonlinear curve indicating series connection of two panels is (5 point estimations) [28]:
(27)
The above equation is used in all subsequent simulations.
4. 1. Simulation Results The simulation results are described in three parts: 1) simulation in full sun condition at various frequencies 2) simulation in the sun irradiance and ambient temperature changes at constant frequency 3) simulation in partial shading condition with or without bypass diodes at constant frequency.
4. 1. 1. Simulation in Full Sun Condition under
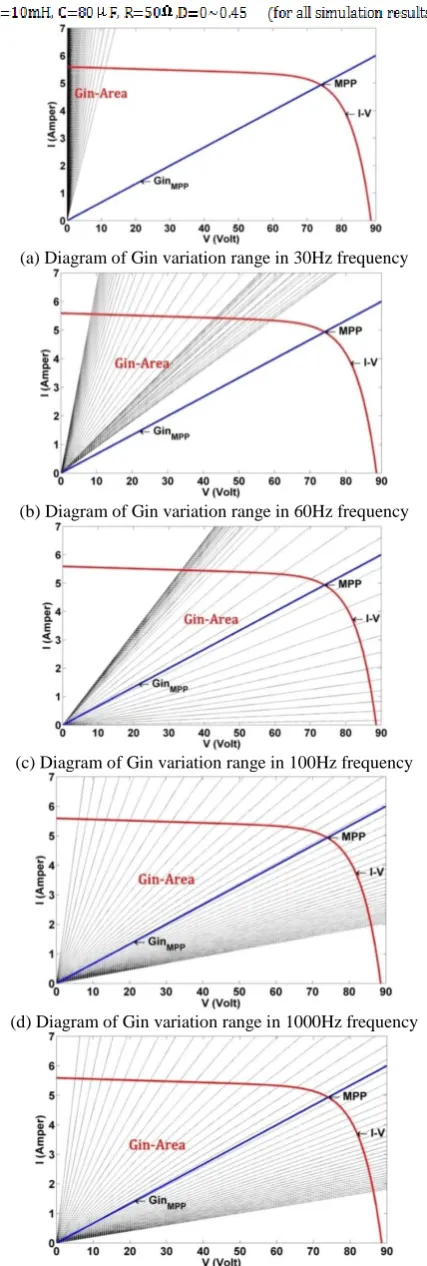
Various Frequencies Figure 6 illustrate Gin
variation range for different Ds for various frequencies under following conditions as simulated in MATLAB for Figure 1a circuit (full sun):
(a) Diagram of Gin variation range in 30Hz frequency
(b) Diagram of Gin variation range in 60Hz frequency
(c) Diagram of Gin variation range in 100Hz frequency
(d) Diagram of Gin variation range in 1000Hz frequency
(e) Diagram of Gin variation range in 10000Hz frequency
(f) Diagram of Gin variation range in 100000Hz frequency
Figure 6. Diagrams of conductivity variation ranges for
various switching frequencies
TABLE 2. Corresponding frequencies, D and maximum power
transfer
# Switching
frequency D-MPPT
Maximum power transmitted to inverter
1 30Hz Does not exist 61 W
2 60Hz Does not exist 315 W
3 100Hz 0.26 360 W
4 1kHz 0.28 360 W
5 10kHz 0.28 360 W
6 100kHz 0.28 360 W
(a)
(b)
Figure 7.(a) Diagram of inverter input conductivity for D in
4. 1. 2. Simulation in the Sun Irradiance and Ambient Temperature Changes at Constant
Frequency When sun irradiance changes, the I-V
curve of the panels change and therefore it may be possible or not to access MPP. Figure 8 shows these conditions.
As
shown in Figure 8, achieving the MPP and implement MPPT algorithm for many irradiance conditions at a certain switching frequency is impossible. In the above example, if the irradiance is less than 0.25 of fully sun, MPP is not possible. Thus, the designer must choose another switching frequency to achieve MPP in low irradiance conditions. Table 3 presents values of D correspond to the transmitted power in various sun irradiances along with maximum power transfer. Similar to the sun irradiance, this also applies to ambient temperature changes. Due to its limited papers’ space, its results have not been shown.(a) Diagram of Gin variation range in 5kHz frequency and full sun (1 sun)
(b) Diagram of Gin variation range in 5kHz frequency and half sun (0.5 sun)
(c) Diagram of Gin variation range in 5 kHz frequency and 0.2 sun
Figure 8. Diagrams of conductivity variation ranges for
various irradiance (1 sun, 0.5 sun, 0.2 sun at 5 kHz switching frequency)
TABLE 3. Corresponding sun irradiances, D and maximum
power transfer
# Sun (100%
sun=1kW/m^2) D-MPPT
Maximum power transmitted to inverter
1 100% 0.28 360 W
2 50% 0.14 164 W
3 20% Does not exist 43
4. 1. 3. Simulation in Partial Shading Conditions
with or Without Bypass Diodes In this part, the
effect of partial shading on the realization of MPPT algorithm is studied. First, the equivalent circuit of the panels is extracted. Then, the MPPT realization simulations will be explained with and without using bypass diodes. The panels are composed of three groups of cells. Each group is made of twelve series parts which each part is a parallel connection of two cells, as shown in Figure 9a. Also, as in this figure, three bypass diodes are used to bypass the cells in shading situation. In Figure 9b, the simplified equivalent circuit of the two series panels is shown. Figure 10a shows the I-V curves, MPPTs, and Gin-Area of the two series panels at partial shading in various conditions and 5 kHz switching frequency.
+
- Vsh
S
ta
g
e
s
(
*
c
e
ll
)
(a)
Panel
Panel
+
-Vsh
(b)
Figure 9. (a) Equivalent circuit of the panels (actual 180W
As shown in Figure 10a, it is impossible in many cases to realize MPPT algorithm (more than 12 shaded cells). In this figure, both parallel cells are considered to be equivalent to one cell (for example: 0.5 cell shaded means that one cell of two parallel cells in Figure 9a is shaded).
In continue, simulation of the partial shading effect in the presence of panel bypass diodes was addressed. As shown in Figure 10b, with the presence of bypass diodes, due to the modification of the I-V curves, the MPP is realized for 12, 24, and 36 cell shaded in Figure 10a. From the simulation, it is concluded that: due to the presence of bypass diodes in the panels, at the many partial effect conditions, realization of maximum power point is achieved.
4. 2. Experimental Results In order to test the
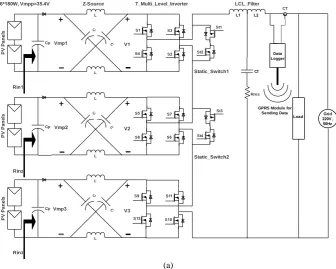
evaluations made in the simulations part, a 1kW 7-Z-source MLI (grid-connected photovoltaic inverter) is used as shown in Figure 11. This inverter is designed to achieve the maximum efficiency by using special switching in each stage. The seven-level waveform of the inverter output (pre-filter) has the minimum total harmonic distortion (THD). The considered load is resistive and off-grid mode is used for the experiment. Values of inverter’s elements are given below:
In Figure 11a, each stage can be equated with Figure 1a and therefore, the obtained equations are valid.
The seven-level produced voltage (before LCL filter) is presented in Figure 12a. Figure12b presents details of this waveform.
(a)
(b)
Figure 10. (a) I-V curves, MPPs, and Gin-Area of the two
series panels in partial shading conditions without bypass diodes (b)I-V curves, MPPs, and Gin-Area of the two series panels in partial shading conditions with bypass diodes
L L C C Cp P V P a n e ls L L C C Cp P V P a n e ls L L C C Cp P V P a n e ls Grid V, Hz Load Cf
L L
Data Logger
GPRS Module for Sending Data
* W, Vmpp= . V Z-Source _Multi_Level_Inverter LCL_Filter
(b) (c) (d)
Figure 11.(a) 7-level Z-source MLI diagram (b, c and d) 7-Level Z-source MLI setup
As indicated in Figure 12b, each stage needs a different D to reach the minimum THD. The inverter in Figure 11a whose details are presented in Figures 12a and 12b and fully sun condition, converged to MPP in all three stages under the following conditions (Table 4).
(a)
(b)
Figure 12. (a) Waveform of the seven-level voltage
(pre-filter) (b) Details of the seven-level waveform
TABLE 4. Values of various parameters in each stage after
reaching MPP
# Switching
frequency Power obtained D-MPPT Gin (mho)
Stage 1 5860Hz 330W 0.25 0.072
Stage 2 5860Hz 335W 0.13 0.072
Stage 3 5860Hz 332W 0.05 0.072
Measurement results of the experiment suggest that the minimum switching frequency for the proposed photovoltaic inverter circuit is 40Hz where any smaller value will not make possible reaching MPPT with the listed elements values in full sun condition (in practice, the switching frequency is much higher than this value so that the proposed scheme is applicable). In low irradiance conditions and 5860 Hz switching frequency, if irradiance is smaller than 0.3 of full sun, then it is not possible to achieve the MPP (the total output power is about 150 watts and this is an undesirable state). Also, due to the use of the bypass diodes, at most cases of the partial shading in this structure, maximum power point of the panels was achieved. In general, for this inverter, the amount of sun irradiance is the most important issue for achieving the maximum power point.
5. CONCLUSIONS
6. REFERENCES
1. Majid, A.J., "The new role of renewable energy systems in developing gcc electricity market", International Journal of
Engineering (IJE), Vol. 4, No. 6, (2011), 507-515.
2. Kalogirou, S.A., "Environmental benefits of domestic solar energy systems", Energy Conversion and Management, Vol. 45, No. 18-19, (2004), 3075-3092.
3. Han, X., Ai, X. and Sun, Y., "Research on large-scale dispatchable grid-connected pv systems", Journal of Modern Power Systems and Clean Energy, Vol. 2, No. 1, (2014), 69-76.
4. Joshi, P. and Arora, S., "Maximum power point tracking methodologies for solar pv systems–a review", Renewable and
Sustainable Energy Reviews, Vol. 70, (2017), 1154-1177.
5. Alajmi, B.N., Ahmed, K.H., Finney, S.J. and Williams, B.W., "Fuzzy-logic-control approach of a modified hill-climbing method for maximum power point in microgrid standalone photovoltaic system", IEEE Transactions on Power
Electronics, Vol. 26, No. 4, (2011), 1022-1030.
6. Ahmad, J., "A fractional open circuit voltage based maximum power point tracker for photovoltaic arrays", in Software Technology and Engineering (ICSTE), 2010 2nd International Conference on, IEEE. Vol. 1, (2010), V1-247-V241-250.
7. Abdelsalam, A.K., Massoud, A.M., Ahmed, S. and Enjeti, P.N., "High-performance adaptive perturb and observe mppt technique for photovoltaic-based microgrids", IEEE Transactions on Power Electronics, Vol. 26, No. 4, (2011), 1010-1021.
8. Elgendy, M.A., Atkinson, D.J. and Zahawi, B., "Experimental investigation of the incremental conductance maximum power point tracking algorithm at high perturbation rates", IET
Renewable Power Generation, Vol. 10, No. 2, (2016), 133-139.
9. Sher, H.A., Murtaza, A.F., Noman, A., Addoweesh, K.E., Al-Haddad, K. and Chiaberge, M., "A new sensorless hybrid mppt algorithm based on fractional short-circuit current measurement and p&o mppt", IEEE Transactions on Sustainable Energy, Vol. 6, No. 4, (2015), 1426-1434.
10. Larbes, C., Cheikh, S.A., Obeidi, T. and Zerguerras, A., "Genetic algorithms optimized fuzzy logic control for the maximum power point tracking in photovoltaic system",
Renewable Energy, Vol. 34, No. 10, (2009), 2093-2100.
11. Elobaid, L.M., Abdelsalam, A.K. and Zakzouk, E.E., "Artificial neural network-based photovoltaic maximum power point tracking techniques: A survey", IET Renewable Power
Generation, Vol. 9, No. 8, (2015), 1043-1063.
12. Trivedi, A., Gupta, A., Pachauri, R.K. and Chauhan, Y.K., "Comparison of perturb & observe and ripple correlation control mppt algorithms for pv array", in Power Electronics, Intelligent Control and Energy Systems (ICPEICES), IEEE International Conference on, IEEE., (2016), 1-5.
13. Esram, T. and Chapman, P.L., "Comparison of photovoltaic array maximum power point tracking techniques", IEEE Transactions on Energy Conversion, Vol. 22, No. 2, (2007), 439-449.
14. Salas, V., Olias, E., Barrado, A. and Lazaro, A., "Review of the maximum power point tracking algorithms for stand-alone photovoltaic systems", Solar Energy Materials and Solar Cells, Vol. 90, No. 11, (2006), 1555-1578.
15. Roshan, Y.M. and Moallem, M., "Maximum power point tracking using boost converter input resistance control", in Industrial Electronics (ISIE), 2012 IEEE International Symposium on, IEEE., (2012), 1795-1800.
16. Roshan, Y.M. and Moallem, M., "Maximum power point tracking using boost converter input resistance control by means of lambert w-function", in Power Electronics for Distributed Generation Systems (PEDG), 2012 3rd IEEE International Symposium on, IEEE., (2012), 195-199.
17. Zanotti, J.W., dos Santos, W.M. and Martins, D.C., "The new mppt method for pv systems employing input characteristic impedance", in Power Electronics Conference (COBEP), 2013 Brazilian, IEEE., (2013), 556-562.
18. dos Santos, W.M. and Martins, D.C., "Digital mppt technique for pv panels with a single voltage sensor", in Telecommunications Energy Conference (INTELEC), 2012 IEEE 34th International, IEEE., (2012), 1-8.
19. Li, S., "A maximum power point tracking method with variable weather parameters based on input resistance for photovoltaic system", Energy Conversion and Management, Vol. 106, (2015), 290-299.
20. Kotak, V. and Tyagi, P., "Dc to dc converter in maximum power point tracker", International Journal of Advanced Research in
Electrical, Electronics and Instrumentation Engineering, Vol.
2, No. 12, (2013), 6115-6125.
21. Husain, M.A., Tariq, A., Hameed, S., Arif, M.S.B. and Jain, A., "Comparative assessment of maximum power point tracking procedures for photovoltaic systems", Green Energy &
Environment, Vol. 2, No. 1, (2017), 5-17.
22. Pidaparthy, S.K. and Choi, B., "Input impedances of pwm dc-dc converters: Unified analysis and application example", J. Power Electron., Vol. 16, No. 6, (2016), 1-12.
23. Nandhini, G.M. and Ganimozhi, T., "New hybrid cascaded multilevel inverter", International Journal of Engineering-Transactions B: Applications Vol. 26, No. 11, (2013), 1377-1383.
24. Peng, F.Z., "Z-source inverter", IEEE Transactions on Industry
Applications, Vol. 39, No. 2, (2003), 504-510.
25. Pilehvar, M.S., Mardaneh, M. and Rajaei, A., "An analysis on the main formulas of z-source inverter", Scientia Iranica. Transaction D, Computer Science & Engineering, Electrical, Vol. 22, No. 3, (2015), 1077-1083.
26. Cespedes, M. and Sun, J., "Impedance modeling and analysis of grid-connected voltage-source converters", IEEE Transactions
on Power Electronics, Vol. 29, No. 3, (2014), 1254-1261.
27. Rashid, M.H., "Power electronics handbook, Butterworth-Heinemann, The third edition, Florida, USA: Academic Press; 2011.
28. Pan, L., "Analysis of photovoltaic module resistance characteristics", International Journal of
Engineering-Transactions B: Applications Vol.26, No. 11 (2013),
Evaluating Technical Requirements to Achieve Maximum Power Point in
Photovoltaic Powered Z-Source Inverter
H. Rahimi Mirazizi, M. Agha Shafiyi
Department of Electrical Engineering, SAB Technical College of the SBU, Tehran, Iran
P A P E R I N F O
Paper history:
Received 06 October 2017
Received in revised form 25 October 2017 Accepted 06 February 2018
Keywords:
Maximum Power Point Tracking Algorithm Input Resistance
Z-Source Inverter Photovoltaic Panel Multi-level Inverter
هدیکچ
اب مهم نیا .دشاب یم اهلناپ زا ناوت رثکادح لاصحتسا هلئسم ،کیئاتلووتوف یاهمتسیس لئاسم زا یکی اونع
متیروگلا ن
MPPT
قحت هلاقم نیا رد .دشاب یم یدیشروخ یاهلناپ ناوت رثکادح یریگهر یانعم هب و دوش یم هتخانش ذپ ق
نیا یری
دیشروخ رترونیا رد متیروگلا یحطس تفه ی
Z-source
ریذپ ققحت .دوش یم یسررب یعون هبساحم یانبم رب متیروگلا ی
روگلا ققحت هک دهد یم ناشن یزاس هیبش جیاتن .دشاب یم لدبم رس ود زا هدش هدید تمواقم زیلانآ و متی
MPPT
هب
امد ،شبات حطس ،رادم رصانع ریداقم ،گنیچیئوس سناکرف ،راب :دننام یفلتخم یاهرتماراپ رثا و طیحم ی
یاس ئزج یگدز ه ی
تسین نکمم روکذم متیروگلا ققحت طیارش زا یرایسب رد هک تسنآ زا یکاح جیاتن نینچمه .دراد یگتسب نمض .
یرایسب ًا ا ز
.تسا هدش هسیاقم ،زین متسیس یلمع تست اب هلصاح جیاتن
doi: 10.5829/ije.2018.31.06c.09