Single Phase Grid-Connected Inverter for
Photovoltaic System with Maximum Power
Point Tracking
Almas Hossain Mollah1, Prof. G KPanda2, Prof. P KSaha3
PG Scholar, Dept. of Electrical Engineering, Jalpaiguri Government Engineering College, Jalpaiguri, West Bengal,
India1
HOD and Professor, Dept of EE, JGEC, Jalpaiguri, West Bengal, India2
Professor, Dept of EE, JGEC, Jalpaiguri, West Bengal, India3
ABSTRACT: This paper proposes a single-phase two stage inverter for grid-connected photovoltaic systems for residential applications. This system consists of a switch mode DC-DC boost converter and a H-bridge inverter.The switching strategy of proposed inverter consists with a combination of sinusoidal pulse width modulation (SPWM) and square wave along with grid synchronization condition. The performance of the proposed inverter is simulated under grid-connected scenario using MATLAB. Furthermore, the intelligent PV module system is implemented using a simplemaximum power point tracking (MPPT) method utilizing power balance is also employed in order to increase the systems efficiency.
KEYWORDS: Photovoltaic; DC-DC Boost Converter; MPPT;SPWM; Square Wave; Power Electronics; Grid Tie Inverter(GTI)
I.INTRODUCTION
In the present scenario of world energy sector renewable sources are growing their importance day by day. This is mainly because of limited resource and bad environmental impacts of the conventional energy. Among the all renewable energy resources available, solar energy seems to be a major competitor as it is abundant in nature and its conversion to electricity through photovoltaic (PV) process is pollution-free. Increasing interest in PV systems, demands growth in research and development activities in various aspects such as Maximum Power Point Tracking (MPPT), PV arrays, anti-islanding protection, stability and reliability, power quality and power electronic interface. With increase in penetration level of PV systems in the existing power systems, these issues are expected to become more critical in time since they can have remarkable impact on the overall system performance. More efficient and cost-effective PV modules are being developed and manufactured, in response to the concerns raised by the PV system developers, utilities and customers.
Tracking the maximum power point (MPP) of a photovoltaic (PV) array is usually an essential part of a PV system. As such, many MPP tracking (MPPT) methods have been developed and implemented. The overall simplicity and efficiency of PV system depends on the MPPT technique employed. Various alternatives architectures for grid connected PV system configurations are available, such as centralized module, AC module and modular configuration where the last topology perfectly fits with an intelligent PV module concept. The AC module configuration, which is a simplified version of the centralized inverter topology. Here a single string of PV module is connected with an inverter. Each string can be applied with a separate MPPT, as there is no loss attributed to string diodes. In comparison to the centralized inverter the overall efficiency is increased. A common inverter is joined with multiple strings connected to individual DC-DC converter. The benefit of this modular configuration over centralized system is that each string can be controlled individually and ensure less cabling loss thereby enhancing the overall system efficiency.
converter for MPPT tracking which ensures optimal operations of PV module. Various MPPT algorithms exist in different literatures. In this research, we propose perturb and observe (P&O) method to extract maximum possible power from solar panel. In this article, a two-stage PV system is proposed which consists of a DC-DC boost converter with MPPT, and a DC-AC inverter to convert photovoltaic DC voltage into line 50 Hz AC voltage as shown in Fig. 1.2. In order to minimize the switching losses and to achieve better performance of the inverter, a combination of SPWM and a square wave signal is used for switching the inverter circuit.
Fig.1 Block diagram of two-stage grid-connected PV system
Fig.1 shows diagram of two-stage grid-connected PV system
II. MODEL OF PHOTOVOLTAIC
PV array is made of p-n junction semiconductors that convert sunlight into electricity. Photons are absorbed to produce electricity when incoming solar energy exceeds band gap energy of the PV module. The I-V characteristic also known as current voltage relationship is a complex non-linear function. Several mathematical models exist to describe behavior of the solar panel. In this paper the following model is used for describing the photovoltaic panel
I= / − ...(1)
P=VI= / − ...(2)
b(n+1) =
( )
...(3)
where, Ix is the short circuit current under Standard Test Conditions (STC), and Vx is the open circuit voltage under STC, and b is the characteristic constant of the panel and can be approximated by equation (3) with Vop is the voltage at
III. CONTROL STRATEGY OF MPPT BASED ON DC-DCBOOST CONVERTER
A.MPPT
A typical solar panel converts only 30 to 40 percent of the incident solar irradiation into electrical energy. Maximum power point tracking technique is used to improve the efficiency of the solar panel. According to Maximum Power Transfer theorem, the power output of a circuit is maximum when the Thevenin impedance of the circuit (source impedance) matches with the load impedance. Hence our problem of tracking the maximum power point reduces to an impedance matching problem. In the source side we are using a boost convertor connected to a solar panel in order to enhance the output voltage so that it can be used for different applications like motor load. By changing the duty cycle of the boost converter appropriately we can match the source impedance with that of the load impedance.
The Perturb & Observe algorithm states that when the operating voltage of the PV panel is perturbed by a small increment, if the resulting change in power ∆P is positive, then we are going in the direction of MPP and we keep on perturbing in the same direction. If ∆P is negative, we are going away from the direction of MPP and the sign of perturbation supplied has to be changed
Fig.2 Solar panel characteristics showing MPP and operating points A and B
Fig.2 shows the plot of module output power versus module voltage for a solar panel at a given irradiation. The point marked as MPP is the Maximum Power Point, the theoretical maximum output obtainable from the PV panel. Consider A and B as two operating points. As Fig.2 shown in the figure above, the point A is on the left hand side of the MPP. Therefore, we can move towards the MPP by providing a positive perturbation to the voltage. On the other hand, point B is on the right hand side of the MPP. When we give a positive perturbation, the value of ∆P becomes negative, thus it is imperative to change the direction of perturbation to achieve MPP.
B. DC-DC Converter
Fig.3 DC-DC Boost converter’s output
Fig.3shows DC-DC Boost converter’s output. Output of converter become constant to 312V .
V. PROPOSED INVERTER DESIGN
A. Power Circuits
The schematic circuit diagram of the proposed inverter, which consists of a DC-DC boost converter and a DC-AC inverter, is shown in Fig. 3. A DC-DC boost converter is employed to step up photovoltaic (PV) output voltage 24V DC into 312V DC that is shown in Fig. 4. The use of boost converter in our proposed design ensures high voltage gain from PV array voltage, and it has several advantages like lightweight, high efficiency etc. This inverter power circuit design contains a pair of two parallel MOSFET gates. The control circuit combines an analog circuit. Analog circuit is used to produce switching signal for inverter power circuit.
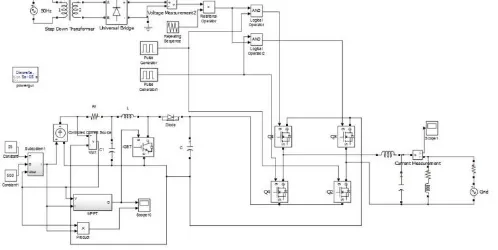
Fig. 4 Block diagram of grid connected PV inverter for simulation in MATLAB
Fig. 4 represents Block diagram of grid connected PV inverter for simulation in MATLAB
B. Switching/Control circuit
.
Fig. 5 Control circuit of proposed inverter design Fig. 6 Rectified sine wave
In addition, a high frequency triangle wave of 10 KHz frequency is used. Then the two signals are passed through a comparator to produce the SPWM signal as shown in Fig. 7. A square wave signal is used as the line frequency (50Hz for India) and is in phase with the SPWM as shown in Fig. 8. The square wave is transmitted through a NOT gate to produce a signal that is 180 degree out of phase of the original Signal
Fig.7 SPWM signal Fig.8 Square wave signal
The inverter requires four switching signals since it has four MOSFET switches. To create four signals an AND operation is performed between two sets of square wave signals and the SPWM. The four sets of switching signals can be categorized in two groups. The first group contains MOSFETs Q1 & Q2 while the second group contains MOSFETs
Q3 & Q4. The gate pulses for switching of MOSFETs are illustrated in Figs.9. When Q2 is turned ON, Q1 is switched
with SPWM signal and both Q3, Q4 are turned OFF. This creates positive output voltage at inverter. For negative part of
output voltage Q1 and Q2 are forced to be OFF and Q4 is ON while Q3 is switched by SPWM.
C. Design Operations of GTI
Inverter operation can be divided into two parts: First part is synchronizing and the second part is power transmitting. During synchronization, the inverter will produce the output in phase with the grid. This is performed by sampling the sine wave and setting phase shift to zero. This un-shifted sine wave is rectified and compared with high frequency triangle wave to generate SPWM signal. An AND operation is performed between the SPWM and the square wave signal to produce four sets of switching signal. With this type of switching and zero phase shifts occurring the inverter output voltage will be controlled by the same phase as the grid. With inverter and grid voltage in phase the zero crossing of both voltages is detected. Once zero crossing is found contact between grid and inverter is activated and connects the grid and inverter together. After both voltages are connected the inverter begins to transmit power into the grid. In situations where the grid is down (off), the circuit breaker between grid and inverter trips.This prevents the grid having power from the inverter when it is down and cause unwanted accidents. The circuit breaker is shunt tripped by relay, which censors the grid with a current transformer (CT). After the grid loses power the relay activates and shunt trips the circuit breaker.
VI. SIMULATION RESULTS
The proposed inverter is simulated using MATLAB software to verify the operation. The switching frequency is fixed at 10 kHz. The boost converter circuit step up 24V PV arrays output into 312V DC and the inverter convert it into sinusoidal ac voltage. Since, we eliminate the use of line frequency transformer at the inverter output terminal and thereby it reduced additional power losses. Fig. 10 shows the output voltage without filtering. The simulation result shows that the output voltage of the inverter is distorted, non-sinusoidal, and contains harmonic that occurs additional power losses.
Fig.10 Output voltage of the inverter without filtering Fig.11 Output current of the inverter
A low pass L-C filter is employed in order to eliminate harmonic influence in output waveform. After filtering we obtain a better sinusoidal output waveform that is similar our grid. Fig. 11 shows output current waveform of our proposed grid-connected inverter. Fig. 12 shows the sinusoidal output voltage waveform 220V rms and 50Hz after connecting the inverter to grid line. It is observed that the total harmonic distortion (THD) of 7.03 %. Before filtering THD was 46.21%. When inverter is connected to grid it takes few second to become stable.This transition period is caused by sudden addition of power into the grid. The magnitude and period of this transition current depends on impedance of power grid.
Fig. 13 shows the output real power of GTI. On the transition period the real power will fluctuate a lot and the real power come stable near at 700W.
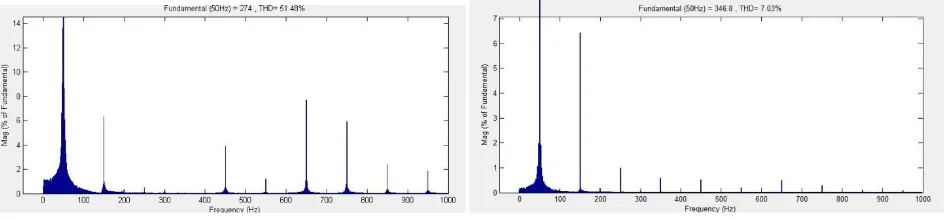
Fig.14. Output voltage’s FFT (a) before filtering and (b) after filtering
Fig. 14 shows the First Fourier Transform (FFT) of output voltage (a) before filtering and (b) after filtering. FFT demonstrates that before filtering fundamental harmonics component lies at 50 Hz and also contains additional harmonics spectra. But after filtering FFT demonstrates that the fundamental harmonic component lies at 50 Hz and rest of the harmonic components are negligible
VII.CONCLUSION
The main purpose of this paper is to establish a model for the grid-connected photovoltaic system with maximum power point tracking function for residential application. A single phase two-stage grid-connected photovoltaic inverter with a combination of SPWM and square-wave switching strategy is designed using MATLAB. In the proposed design, an MPPT algorithm using a boost converter is designed to operate using (P&O) method to control the PWM signals of the boost converter, which is adapted to the maximum power tracking in our PV system. Instead of using line frequency transformer at the inverter output terminals, a DC-DC boost converter is used between solar panel and inverter that efficiently amplify the 24V PV arrays output into 312V DC, which is then transformed into line frequency (50Hz) sinusoidal ac 220V rms voltage by the inverter and thereby reducing the system losses and ensures high voltage gain and higher efficiency output. The simulation results show that the proposed grid connected photovoltaic inverter trace the maximum point of solar cell array power and then converts it to a high quality ripple free sinusoidal ac power with a voltage THD below 8%. The simulation also confirms the proposed photovoltaic inverter can be applied as a GTI and able to supplies the AC power to utility grid line.
REFERENCES
[1] Hiren Patel and Vivek Agarwal ,ʽʽ MATLAB-Based Modeling to Study the Effects of Partial Shading on PV Array Characteristicsʼʼ, IEEE TRANSACTIONS ON ENERGY CONVERSION, VOL. 23, NO. 1, MARCH 2008
[2] Marcelo G. Villalva, Ernesto Ruppert F,“ Analysis and Simulation of the P&O MPPT Algorithm Using a Linearized PV Array Model”, 978-1-4244-4649-0/09/$25.00 ©2009 IEEE [3] Aron P. Dobos,“ Modeling of Annual DC Energy Losses due to Off Maximum Power Point Operation in PV Arrays”, 978-1-4673-0066-7/12/$26.00 ©2011 IEEE
[4] R.Chedid, R.Tajeddine, F. Chaaban and R. Ghajar,“ Modeling and Simulation of PV Arrays under Varying Conditions”,978-1-4799-2337-3/14/$31.00©2014IEEE
[5] Jaime Alonso-Martínez, Santiago Arnaltes,“ A Three-Phase Grid-Connected Inverter for Photovoltaic Applications Using Fuzzy MPPT”, Dpt. of Electrical Engineering, Univ. Carlos III de Madrid
[6] Ben York and Wensong Yu,“ An Integrated Boost Resonant Converter for Photovoltaic Applications”, IEEE TRANSACTIONS ON POWER ELECTRONICS, VOL. 28, NO. 3, MARCH 2013
BIOGRAPHY
Almas Hossain Mollah was born in West Bengal, India on April 4, 1991. He has received his B.Tech degree in Electrical Engineering from Netaji Subhash Engineering College Kolkata West Bengal in 2012. Currently he is persuing hisM.Tech degree in Power Electronics and Drives from Jalpaiguri Govt.EngineeringCollege,Jalpaiguri,WestBengal
Prof.Gautam Kumar Panda, Professor and Head, Department of Electrical Engineering, Department of Electrical Engineering, Jalpaiguri Government Engineering College, Jalpaiguri,WB- 735102,BE (Electrical) from J.G.E. College, Jalpaiguri, M.E.E(Electrical) Specialization: Electrical Machines & drives from JadavpurUniversity.PhD from University of North Bengal. FIE, MISTE, Certified Energy Auditor.