Volume 2, Issue 4, April 2013
Page 46
ABSTRACT
In this paper the comparison of FE Analysis with actual experimental data of shell core drum is presented for the validation. Shell Core Drum is the Product of Mehtex Engineering Pvt. Ltd. (Naroda – GIDC, Ahmedabad). During the production of Shell Core Drum Company suffers of defects regarding porosity. Experimental results are investigated by using Tool Maker Microscope. The model of the drum is developed in solid works 2009 and porosity analysis is done in ProCAST. The results indicate that the ProCAST analysis is quite nearer to Experimental results.
Keywords:Gravity Die Casting, Design of Experiment, ProCAST
1.
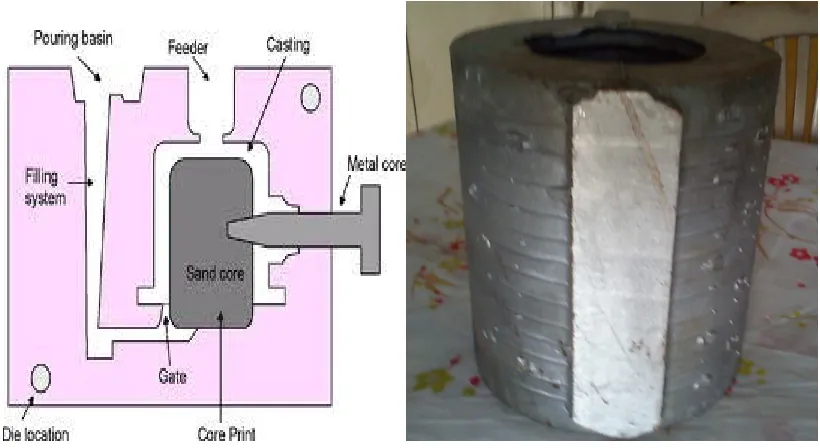
INTRODUCTIONGravity die casting used for non-ferrous casting applications is increasingly used in the foundries today as an economically viable casting process. The conventional trial and error based die design and process development is expensive and time consuming. Such a procedure also might lead to higher rejections and lower casting yield. Computer simulation procedure based process development and die design can be used for rapid process development and die design in a shorter time. Such a computer simulation based procedure, often using state of the art FINITE ELEMENT ANALYSIS based software systems, can improve the quality and enhance productivity of the enterprise by way of faster development of new product. FEM based simulation software systems help the designer to visualize the metal flow in the die cavity, the temperature variations, the solidification progress, and the evolution of defects such as shrinkage porosities, cold shuts, hot tears and so on. The common defected gravity die cast components are shown in fig.1.2.
Fig. 1.1 Gravity die casting Fig. 1.2 Defected Shell Core Drum
Analysis and Validation of
Gravity Die Casting Process using ProCAST
Mr. Ankit D. Oza1, Prof. Tushar M. Patel2
1
M.E. Scholar L.D.R.P.-I.T.R. Sector – 15, Gandhinagar. Gujarat
2
Volume 2, Issue 4, April 2013
Page 47
Casting process is also known as process of uncertainty. Even in a completely controlled process, defects in casting are found out which challenges explanation about the cause of casting defects. The complexity of the process is due to the involvement of the various disciplines of science and engineering with casting. The cause of defects is often a combination of several factors rather than a single one. When these various factors are combined, the root cause of a casting defect can actually become a mystery. It is important to correctly identify the defect symptoms prior to assigning the cause to the problem. False remedies not only fail to solve the problem, they can confuse the issues and make it more difficult to cure the defect. Unfortunately, this is not an easy task, since casting process involves complex interactions among various parameters and operations related to metal composition, methods design, molding, melting, pouring, shake-out, fettling and machining. The proper classification and identification of a particular defect is the basic need to correct and control the quality of casting. To enhance the quality of cast component the solid model is analyzed and experimental results are compared with the finite element analysis results to optimize the design specification and parameter. Therefore this paper concentrates on the comparison of actual modeled and analyzed die cast model.2.
REVIEW
Feng Liu et al [1] in this paper, with the aid of parametric modeling technology of runner and riser are modeled parametrically. By varying each parameter, it is easy to get different casting CAD models. These models output data populate the orthogonal matrix, which is used in the orthogonal array testing strategy to define the most suitable combinations of runners and risers parameters. After inputting the completed orthogonal matrix data and all CAD models into the simulation software the simulation result can be obtained. Marco Aloe et al [2] observed that Gating systems, overflows, venting channels can be optimized using numerical simulation. Solidification related defects can also be predicted taking into account cooling channels and die cycling so as to accurately reproduce production conditions. ProCAST readily addresses all these issues but also includes advanced features to better assess the casting quality. Mohammad Sadeghi et al [3] observed that ProCAST software used to simulate the fluid flow and solidification step of the part, and the results were verified by experimental measurements. By this Paper he concludes that 1) Comparison of the experimental and simulation results indicates that defects in the pieces are placed at the predicted places by simulation. 2) If the die temperature is reduced from the optimum temperature range, probability of cold flow defects and air porosities increase. 3) Determination of optimized places of overflows by simulation led to decrease of some casting defects such as cold shots and air porosities.Dr. S. Shamasundar et al [4] observed that in gravity die casting of Aluminum parts, computer simulation can be a useful tool for rapid process development. Limitation of the conventional die design and gating design has been elaborated. Advantages of computer simulation based design enumerated. The procedures thus described have been demonstrated with two case studies of application of ProCAST simulation at Ennore Foundries. It is demonstrated that the foundries can derive mileage by resorting to FEM simulations of the casting process for process development and optimization.
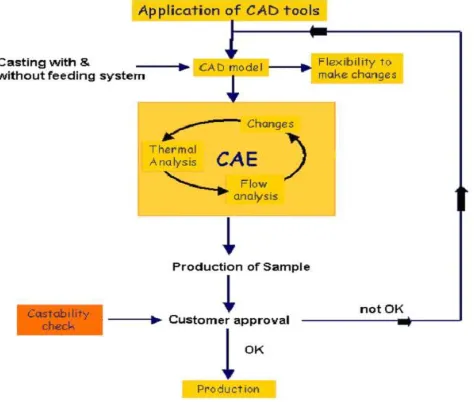
Fig. 2.1 Flow pattern of computer simulation
Volume 2, Issue 4, April 2013
Page 48
sufficient for completely eliminating the defects, since parameters related to part, tooling and methods design also affect casting quality, and these are not considered in conventional defect analysis approaches.3.
FE Analysis using ProCAST
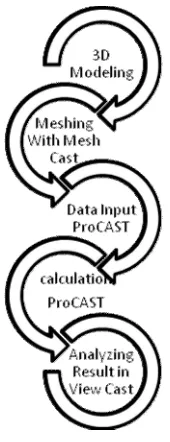
Figure 3.1 shows a flowchart, in which 3D CAD and simulation tools are utilized to improve the systemdesign of the casting.The castings geometries presented here were meshed with MeshCAST, which requires theGeneration of a surface mesh before meshing the enclosed region with tetrahedral elements.
Fig.3.1Steps needed to make a simulation. STEP 1. 3D CAD Modeling:
The modeling has been performed on the Solid works 2009 version and then after the analysis works has been performed on the ANSYS 12.0 version.
Fig. 3.2 Model of Shell Core Drum Fig. 3.3 Die & Casting
STEP 2.Meshing with MeshCAST:
Volume 2, Issue 4, April 2013
Page 49
Fig. 3.4 Meshing in MeshCAST Import meshing file in PRE CAST:
Fig. 3.5 Import Meshing File in PRE-CAST Apply Aluminium Casting Initial temperature:
Fig. 3.6 Initial Temperature
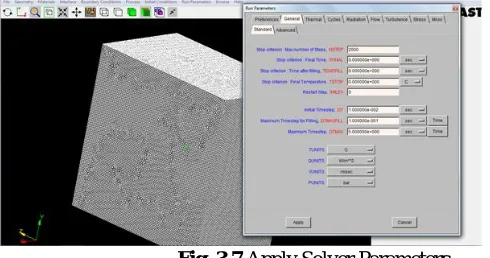
STEP 3. Data Input to ProCASTDefine Run Parameter for Aluminium Die Casting Simulation.
Volume 2, Issue 4, April 2013
Page 50
Fig. 3.8 Molten state of pouring metalSTEP 5. Analyzing Result:
Fig. 3.9 Fraction solid Contour
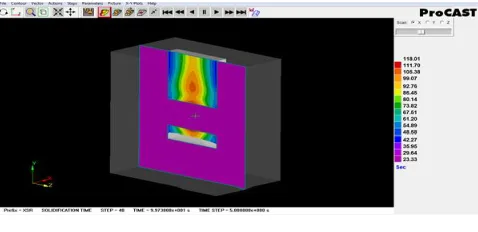
In this solidification Time Contour diagram the highest temperature at a yellow shade. So at that region the maximum chances of occurring porosity because of the upper side of die molten metal are starts to solidify. So the hot gases do not pass through the upper region of the die.
Fig. 3.10 Solidification Time Contour
Figure indicates the temperature distribution over entire part. Maximum temperature at the centre of the part so that the maximum chances of porosity occurs at that region.
Volume 2, Issue 4, April 2013
Page 51
4.
Experimental Investigate
Tool Maker Microscope is used to measure the location and size of porosity.
Fig. 4.1 Tool Maker Microscope Experimental Procedure:
• 1st Put the work piece on the table of microscope. • 2nd set the lens of microscope at starting of defect.
• 3rd start the light and rotate the table as per the defect geometry. • 4th rotate the screw of table as per defect.
• 5th Get the result.
Tool Maker Microscope automatically generates the graph of defect as well as the perfect location of defect with respect to X-Y-Z axis.
5.
Comparison of Experimental result and ProCast Result
Figure shows that the location and size of shrinkage porosity is nearer to similar in Experiment and ProCast. By Measuring Porosity Location and size in Microscope we get the nearer result as in ProCAST
6.
Conclusion
Experimental results are taken by using Tool Maker Microscope we get the % of porosity is 12.30% and in FE Analysis by using ProCAST we get the % of Porosity is 13.86% as shown in table 7.1
Table no. 6.1 Comparison of experimental result and ProCAST Result
PARAMETER EXPERIMENTAL
RESULT
PROCAST RESULT PERCENTAGE
VARIATION
POROSITY % 12.30% 13.86% 0.126%
7.
Acknowledgment
Volume 2, Issue 4, April 2013
Page 52
REFERENCES
[1] Feng Liu, worcester polytechnic institute, December 2008
[2] Marco Aloe, Calcom ESI, Switzerland Mark Samonds, ESI Software, France Lorenzo Valente, ECOTRE sas, Italy [3]Mohammad Sadeghi and Jafar Mahmoudi, HST Department, M¨Alardalen University, V¨aster˚as, Sweden
[4] Dr.S.Shamasundar, V.Gopalakrishna, Manjunatha, BadrinathProSIM- AFTC, 326, III Stage IV Block, Basaveshwara Nagar, Bangalore 560079
[5] Ravneetkakria, Chandandeep Singh, PriyavratThareja, quality improvement of aluminium alloy (lm-6) casting using taguchi method
[6] M. Y. Khire, V.V.Mane, AmitSata “New Approach to Casting Defects Classification and Analysis Supported by Simulation”.
AUTHOR
Mr. Ankit D. Oza received the B.E. degree in Mechanical Engineering from L.D.R.P. – I.T.R., Sector – 15,Gandhinagar in 2011. He now is perusingM.Tech. In production Engineering at L.D.R.P.- I.T.R. Gandhinagar, Gujarat, India.