WELD POROSITY CONTROL USING DIAGNOSTIC CASE STATISTICS FOR
PERCENTAGE DILUTION IN A GAS TUNGSTEN ARC WELDING PROCESS
Q. A. Kingsley-Omoyibo
DEPT. OF MECHANICAL ENGINEERING, COLLEGE OF ENGINEERING, IGBINEDION UNIVERSITY OKADA, EDO STATE, NIGERIA Email address: [email protected]
ABSTRACT
Welding within forty eight (48) hours of joint preparation will help to prevent porosity in weld deposited at a Gas Tungsten Arc Welding (GTAW) process. This research aims at preventing weld porosity and improving weld quality using diagnostic case statistics for percentage dilution. Poor process conditions due to faulty operator error, use of wrong techniques, use of incorrect consumables and the use of bad weld grooves, are the common causes of porosity in weld deposits. In order to achieve the objectives of this research, the response: percentage dilution is used with four input process parameters such as current, voltage, speed and gas flow rate to optimize percentage dilution. Eradication of weld porosity was achieved using a current of 160.5 Amperes, voltage 17.5Volts, speed 100.6mm/min and gas flow rate of 16.07 Lit/min with a value of 46.9% percentage dilution. An established result from literature survey corresponds with the results in this study.
Keywords: Weld Porosity, diagnostic case statistics, Percentage dilution (D), Gas Tungsten Arc Welding process.
1. INTRODUCTION
A few of the most common causes of porosity in weld deposits and proffered solutions that can be used to limit porosity in weld deposits during and after welding, was investigated [1]. Problems associated with weld were addressed and fixed in order to reduce the occurrence of porosity. Some other areas researched were causes of porosity, types of porosity, detecting porosity using the non-destructive test method (NDT) and solutions to porosity defects [1].
The quality of welded joint at a MAG welding process with analysis of welding parameter influence on joint geometry was investigated using a process selection of welding parameters with regards to current, voltage, speed, and gas flow rate with values of 150 amperes, 18volts, 95mm/min and 17lit/min respectively with the tittle “MAG welding process analysis of welding parameter influence on joint geometry “. The mutual effect of welding speed and gas flow rate on the bead- on – plate, were investigated using analysis of variance (ANOVA) for
two cases: welding using the flux core wire with shielding gas Krystal 18 and welding using solid wire with shielding gas CO2.The result of the analysis showed that both cases using the shielding gas CO2 with solid wire and shielding gas Krystal 18 with flux core, to produce a significant influence on welding speed and had a mutual effect on welding speed and gas flow rate [2].
Researches on dilution control by advanced submerged arc welding, showed the effect of process variables such as wire feed rate (w), and the welding current (I) on dilution, using stainless steel 308L electrode wire on mild steel substrate in order to study the effect of preheating on percentage dilution. Results obtained showed that Advanced Submerged Arc Welding (ASAW) process, significantly reduced the percentage dilution. As compared with the conventional submerged arc welding (SAW) process that reduced the heat input but increased the productivity. Indicating an advantage of ASAW over the conventional SAW process. The optimal value of percentage dilution recorded was 47 % [3].
Nigerian Journal of Technology (NIJOTECH)
Vol. 38, No. 1, January 2019, pp.
127 – 133
Copyright© Faculty of Engineering, University of Nigeria, Nsukka, Print ISSN: 0331-8443, Electronic ISSN: 2467-8821
Porosity as a defect was critically examined in the topic “welding defects and welding faults”. Bubbles in the weld were investigated and to a certain degree, porosity was accepted. Porosity is visible by non - destructive test. Uncontrolled current applied during welding results in occurrence of porosity, hence, choosing the proper input process parameters, using dry electrode, will prevent occurrence of porosity in weld deposits. Welding current applied, was recorded at 160 amperes with 18 volts welding voltage[4]. Experimental investigation of process parameters on weld bead geometry for aluminum using GTAW” process where weld runs were carried out using an Automatic Gas Tungsten Arc welding (GTAW) setup was used to investigate the effect of percentage dilution on welds. Models were used to investigate the experiment. Regression analysis and the design of experiment (DOE) were used. Constraints were formulated to optimize the problem that was used to minimize weldment area, with a percentage dilution of 45% [5].
A factorial experiment was designed using AA 5083 (aluminum alloy) weld to study different gas flow rate as it affects percentage dilution and the effect of shielding gas flow rate on mechanical properties of the heat affected zone (HAZ) and the fusion zone as it affects the percentage dilution ,were studied. Results obtained were 6lit/min, 10lit/min and at 14 lit/min. Optimal value of percentage dilution was recorded at 47.2%, optimal gas flow rate at 14 lit/min was the most effective at the heat affected zone in achieving a porosity-free weld [6].
2. GAPS OF PRESENT RESEARCH
Welding engineering and technology sector has a common goal of preventing welding defects at joints welded, during any welding technique used. Presence of porosity defect in a weld pool at a very high welding current causes premature solidification that results in the presence of gas pockets. A poor selection of input process parameters such welding current, welding voltage, welding speed and gas flow rate can result in fatigue performance, reduction of weld integrity and reduction in the load bearing capability of welded joints. Wastage of gas during a GTAW process can lead to porosity in welded deposit hence the basis for this research. The aim of this research is to prevent porosity in weld deposit using Gas Tungsten Arc Welding (GTAW) process to obtain a defined quantity of percentage dilution that will eradicate porosity defects in welds and also, establish
optimum input parameter values for welding current, welding voltage, welding speed and shielding gas flow rate that will be used to evaluate percentage dilution and prevent weld porosity.
3. METHODOLOGY
Experimental details
The experiments were conducted using four input process parameters which were welding current, welding voltage, welding speed and gas flow rate and were used to produce weldments at a gas tungsten arc welding process after sectioning, grinding, polishing, etching and tracing the profiles of the welded joints. Percentage dilution was determined, using the values obtained for each weld produced. using a bead-on-plate procedure, a dimension of 150mm x 100mm x 10mm mild steel plate was sectioned into 16 specimens with a groove of 30 0 on each end of the plate created with a root face of 3mm at a groove angle of 60 0 on joining two specimen.
A total of four beads resulted from the process, they were root pass, hot pass, fill pass and cap pass to cover the groove. Using a profile projector, values of bead height, bead width and reinforcement area were recorded and used to percentage dilution. Percentage dilution was expressed as:
Where weight of parent metal = reinforcement area Total weight of weld = reinforcement area + penetration area.
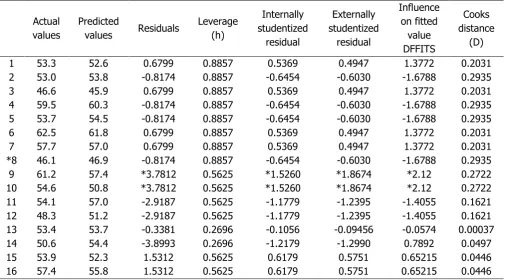
Using a design matrix as a guide and establishing the ranges of input process parameters based on a 16 experimental run, a diagnostic case statistics based on residual analysis comprising of (i) predicted responses (ii) estimated slope coefficient and hypothesis test result used a standard order to analyze the actual versus predicted values of the data presented with the residuals recorded alongside the leverages. The Cooks distance was used to find influential outliers was used to check for validity of the model for the response: percentage dilution. The leverage determined the degree of noise in the model as it is bounded on 0 < hii < 1 (Everitt, 2016) where hii represents leverage. It was used
significant. The differential functioning of items and texts (DFFITS) column help to determine the influence on fitted values.
The experiment was carried out using a miller multipurpose machine, argon shielding gas, GTAW machine set up, ER 70 5 – 6 electrodes, 10mm mild steel plate measuring 150mm by 100mm by 10mm. A diagnostic case statistics for residual analysis using the response surface methodology (RSM) explanatory variable, cooks distance (D), leverage (h), DFFITS, internally and externally studentized residuals were used to determine the suitability of the model showing error distribution and outliers. welding current among other input process parameters, was the most significant variable as it affected the melting rate of the filler metal and the percentage dilution as regards metal solidification[6].
4. RESULTS AND ANALYSIS
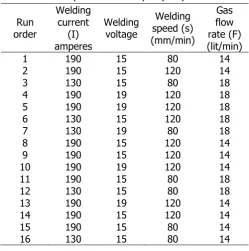
Welding input process parameters: current , voltage, speed and gas flow rate (I, V, S, F) using a manually operated GTAW machine, was used to achieve the objectives of the research guided by an experimental set up which obtained results for the experiments performed using design of experiment (DoE) in
Response Surface Methodology (RSM) with the results presented in Table 1.
Table 1: Results From Welding Experiment From full experimental analysis (FEA)
Run order
Welding current
(I) amperes
Welding voltage
Welding speed (s) (mm/min)
Gas flow rate (F) (lit/min)
1 190 15 80 14
2 190 15 120 14
3 130 15 80 18
4 190 19 120 18
5 190 19 120 18
6 130 15 120 18
7 130 19 80 18
8 190 15 120 14
9 190 15 120 14
10 190 19 120 14
11 190 15 80 18
12 130 15 80 18
13 190 19 120 14
14 190 15 120 14
15 190 15 80 14
16 130 15 80 14
Table 2: Percentage Dilution Actual Values versus Predicted Values
Run order Actual values Predicted value
1 53.3 52.6
2 53.0 53.8
3 46.0 45.9
4 59.5 60.3
5 53.7 54.5
6 62.5 61.8
7 57.7 57.02
*8 46.1 46.9
9 61.2 57.4
10 54.6 50.8
11 54.1 57.0
12 48.3 51.2
13 53.4 53.7
14 50.6 54.4
15 53.9 52.3
16 57.4 55.8
4.1 Effect of leverage point on percentage dilution and preventing of porosity in weld deposits.
Table 3 shows leverage (h) values of 0.8857 from standard order 1 – standard order 8 and 0.5625 for standard order 9, 10, 11, 12, 15 and 16 while 13 and 14 had values of leverages 0.2696. bounds on leverage to determine the degree of noise is 0 < h <
1 (Everitt 2016).Values of 0.8857, 0.5625 and 0.2696 are less than 1, hence the mode is significant, have low residuals with low influential points, with the data points clustering around the mean and the model is valid and can be used to navigate the design space. An optimal value of 46.9% for percentage dilution, with a residual of -0.8174, a leverage value of 0.8857, internally students residual of – 0.6454, externally studentized residual of – 0.6030 with influence on fitted value DFFIT of -1.6788, and a cooks distance of 0.2935 were established.
Fig.5, represents leverage versus run and identifies the influencial observations of a fitted regression model. Leverages with values less than 1 have low degree of noise,hence a value of 0.583333 showed a low degree of noise in the model. The observation was less than one, leverage had low leverage point with less influential observations.
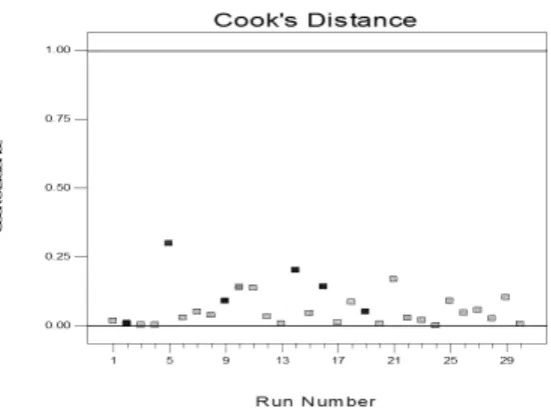
Cook’s distance measured changes in regression coefficient when an observation was deleted. Data points with large residual cut-off value had Cook distance greater than 1. Data points with low residual cut-off value had Cook distance less than 1. Hence, residual values were minimal . from Table 3 , residuals Cook’s distance value was 0.08963 showing that the model is significant.
Table 3:Diagnostic Case Statistics For Percentage Dilution
Actual values
Predicted
values Residuals
Leverage (h)
Internally studentized
residual
Externally studentized
residual
Influence on fitted
value DFFITS
Cooks distance
(D)
1 53.3 52.6 0.6799 0.8857 0.5369 0.4947 1.3772 0.2031
2 53.0 53.8 -0.8174 0.8857 -0.6454 -0.6030 -1.6788 0.2935
3 46.6 45.9 0.6799 0.8857 0.5369 0.4947 1.3772 0.2031
4 59.5 60.3 -0.8174 0.8857 -0.6454 -0.6030 -1.6788 0.2935
5 53.7 54.5 -0.8174 0.8857 -0.6454 -0.6030 -1.6788 0.2935
6 62.5 61.8 0.6799 0.8857 0.5369 0.4947 1.3772 0.2031
7 57.7 57.0 0.6799 0.8857 0.5369 0.4947 1.3772 0.2031
*8 46.1 46.9 -0.8174 0.8857 -0.6454 -0.6030 -1.6788 0.2935
9 61.2 57.4 *3.7812 0.5625 *1.5260 *1.8674 *2.12 0.2722
10 54.6 50.8 *3.7812 0.5625 *1.5260 *1.8674 *2.12 0.2722
11 54.1 57.0 -2.9187 0.5625 -1.1779 -1.2395 -1.4055 0.1621
12 48.3 51.2 -2.9187 0.5625 -1.1779 -1.2395 -1.4055 0.1621
13 53.4 53.7 -0.3381 0.2696 -0.1056 -0.09456 -0.0574 0.00037
14 50.6 54.4 -3.8993 0.2696 -1.2179 -1.2990 0.7892 0.0497
15 53.9 52.3 1.5312 0.5625 0.6179 0.5751 0.65215 0.0446
Fig 5: Measure of Leverage vs Run for percentage dilution
Fig. 6. Measure of Cook’s distance for Percentage dilution
An observation was deleted, and a change in regression coefficient was measured as the Cooks distance. As a rule of thumb Cooks distance for significant model D is:
n
4
∑ ( ̂ ̂ )
From Table 3, it can be seen that:
Effect of percentage dilution: A low percentage dilution of 46.9% had low residuals of 0.817 and a leverage of 0.885 with a low Cook’s distance of 0.293 in order to ensure minimum percentage dilution. The
welded area was free from porosity based on use of the optimal parameters of GTAW process current, voltage, speed and gas flow rate.
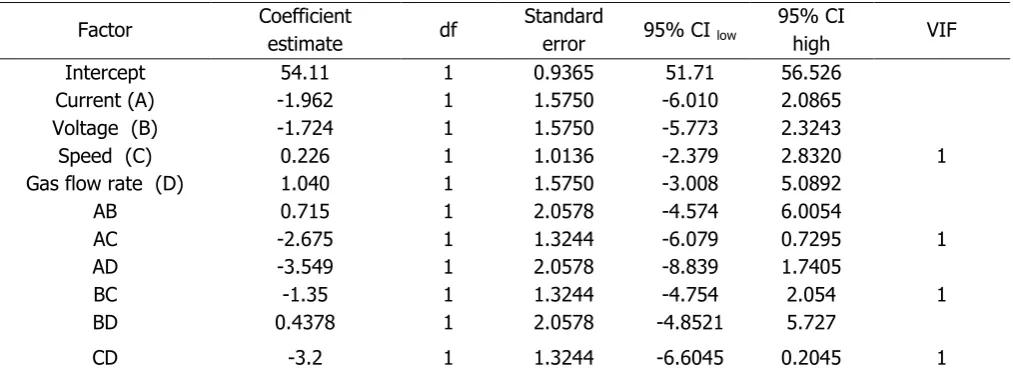
4.2 ANOVA co-efficient estimate confidence interval (CI) and variance inflation factor (VIF)
Table 4: ANOVA Co-Efficient Estimate for Percentage Dilution
A. Final equation in terms of coded factors
46.09 is the free regression coefficient and when reduced by 1.962 unit of current in unity, the value for percentage dilution become 44.12%. as the value of 46.09 is reduced by 1.724 unit of voltage, the percentage dilution value becomes 44.36 %. as the value 46.09 is increased by 0.22 units of speed in unity, the value of percentage dilution is increased to 46.31% . Also increased gas flow rate, added to the value of 46.09% to give 47.13 % by adding 1.040units, optimized value of percentage dilution or estimator value becomes 47.13%. This value was obtained from a high speed, high Gas flow rate, low current and low voltage. The Estimator = Ɛ = 46.9 %.
B. Constraints
Subject to the condition that % D takes the minimum value and
* Fmin < F < Fmax i.e. 14 < F < 18 lit/min *Smin < S < Smax i.e. 80 < 5 < 120 mm/min Vmin < V < Vmax i.e. 15 < V < 19 volts
Imin < I < Imax i.e. 130 < I < 190 Amperes
5. VALIDATION OF RESULTS
The results obtained from optimization were validated using the diagnostic case statistics with a maximum error of 1% found between the predicted weld geometry parameters and measured/actual weld geometry parameters.
6. CONCLUSIONS
The diagnostic case statistics model, has proved efficient in the determination of a defined quantity of percentage dilution and the correct shielding gas flow rate that will conserve gas usage at a gas tungsten arc welding to prevent porosity in welded joints. These are the conclusions made from the investigations carried out:
i. Optimized values of gas flow rate was determined at a value of 16.07 lit/min and should be used as the correct amount of shielding gas at a GTAW process to avoid gas wastage and porosity occurrence.
ii. a defined quantity of percentage dilution value of 46.9% was established in this study. This value should be used at a GTAW process to provide sufficient amount of dilution for rapid solidification of molten metal during welding operation in order to produce porosity-free welds.
iii. optimized values of input process parameters of current with a value of 160.5 amperes, voltage value of 17.5 volts and welding speed value of 100.6 mm/min was obtained from the study and should be used at a GTAW process on a 10mm mild steel plate for a bead-on-plate procedure to prevent porosity in welds.
iv. a model that will optimize percentage Dilution for a bead-on-plate procedure at a Gas Tungsten Arc Welding (GTAW) process using a 10mm mild steel plate in order to improve the quality of welded components free from weld Porosity and also improve the reliability and
Factor Coefficient
estimate df
Standard
error 95% CI low
95% CI
high VIF
Intercept 54.11 1 0.9365 51.71 56.526
Current (A) -1.962 1 1.5750 -6.010 2.0865
Voltage (B) -1.724 1 1.5750 -5.773 2.3243
Speed (C) 0.226 1 1.0136 -2.379 2.8320 1
Gas flow rate (D) 1.040 1 1.5750 -3.008 5.0892
AB 0.715 1 2.0578 -4.574 6.0054
AC -2.675 1 1.3244 -6.079 0.7295 1
AD -3.549 1 2.0578 -8.839 1.7405
BC -1.35 1 1.3244 -4.754 2.054 1
BD 0.4378 1 2.0578 -4.8521 5.727
service life of welds produced has been developed.
7. ACKNOWLEDGEMENT
The author is grateful to the management of University of Benin, Benin City, Edo State, Nigeria for the platform provided for this research. For valuable assistance in this research, we wish to thank Prof. K.U. Omoyibo, Prof. G.C. Ovuworie and Prof. J.I. Achebo for valuable endless collaboration. I am grateful to Petroleum Training Institute (PTI) Warri, Delta State, Nigeria for permission granted to conduct this research in the welding workshop of the institution for the benefit of welding Engineering and the society at large.
8. REFERENCES
[1]. Achebo J. I. and Odinikuku W. E. optimization of Gas Metal Arc Welding (GMAW) process parameters using standard deviation (SDV) and multi objective optimization on the basis of ratio analysis (MOORA). Journal of Minerals and Materials Characterization and Engineering 3, pp. 298 – 308, 2015.
[2]. Achebo J. I. and Salish S. (2015) Reduction of undercuts in fillet welded joints using Taguchi optimization method. Journal of Minerals and Materials Characterization and Engineering 3: 171-179
[3]. Adams, R. D.; NDT of Adhesively Bonded joints, welding and metal fabrication, vol. 57, August – September, pp 303 – 311, 1989.
[4]. Anon; Basic welding Data No. 15 welding and Metal fabrication, vol. 58, No. 5, June, pp 277 – 282, 1990.
[5]. Anon; Basic welding Data No.9 Joint design, welding and metal fabrication1989, August – September, vol. 57 No. 7, pp 322 – 324, 1989. [6]. ASM publications: Metals Handbook, 9th Edition
vol. 11, failure Analysis and prevention,
American Society for Metals, Metals Park, Ohio, USA, 1986.
[7]. AWS Designation: E837 – 89, stand to method for Determining Residual stress by the Hole – Drilling Strain – gage method, pp 713 – 718 [8]. AWS, welding Handbook, Vol. 1 Fundamentals
of Welding, American Welding Society, Miami, Florida, USA , 1976.
[9]. Bull steve , Welding faults and welding defects International Journal of Computational Engineering Research 29(2) : 6 – 10,2013. [10]. Dinesh,K.S and Sunil, P. Dilution control by
Advanced arc welding, Journal of Advanced Material Research 48(8);1737 -1741. 2012. [11]. Guo, W., Crowther. D, Franas J. A 2015.
Microstructure and Mechanical Properties of Laser Welded S960 High Strength Steel. International Journal for Engineering and Innovative Technology, 85 (1): 534-548 2015. [12]. Kenyon, W. I. Welding and Fabrication
Technology, Pitman Books Ltd London. 1982 [13]. Mostafa, N. B and Khajava, M. N., Optimization
of welding parameters for weld penetration in Flux Core Arc welding. Journal of Material and Manufacturing Engineering, 16: 1-8, 2006. [14]. Osayi, A.O; Egbe, A. P and Lawal, S. A.
Optimization of Process Parameters of Manual Arc Welding of Mild Steel Using Taguchi Method. American Journal of Mechanical Engineering 3(1): 93-97. 2015.
[15]. Parthiv. J. T and Ashwin .P. B., Experimental Investigation of process parameter on weld bead geometry for Aluminium using GTAW. International Journal of Science and Research 3(5): 803 – 805, 2013.