Scientific Journal Impact Factor: 3.762
International Journal of Applied And Pure Science and
@IJAPSA-2016, All rights Reserved
Maximum Entropy (MaxEnt) modelling approach for predicting potential
climate suitable locations of popular banana varieties in India: I. Poovan
N. Sivaraj, K. Rameash 1
ICAR-National Bureau of Plant Genetic Resources, Regional Station, Hyderabad 500 030,
Maximum Entropy modelling approach for predicting the potential climate suitable region for the sustainable cultivation of Poovan banana variety
present and future climate (2050) scenario.
KEY WORDS: Poovan variety, banana, GIS, MaxEnt modelling
The Banana is the world’s most popular fruit and a staple crop for more than 400 million people. India ranks first in terms of area and production, growing in about 4
ha with an annual production of 168
Among the states in India, Tamil Nadu, Karnataka and Maharashtra possesses major share in area and production of banana in the country. Poovan variety (AAB) is one of the leading commercial banana cultivars grown perennially throughout the country. Poovan has region specific ecotypes viz., Palayankodan
Tamil Nadu is the leading producer of Poovan cultivar owing to its climatic and marginal soil condition. Poovan is also commercially
and in certain parts of Kerala. It produces
12 hands yielding more than 200 fruits of medium size. Fruit possess thin skin which peels off easily. It is slightly acidic, firm and has typical sour
between 11 and 14 months. Fruits turn having closely packed fruits with
plus points. Considering its importance, an attempt has been made to suitability regions in India for the sustainable cultivation of
climate change regime. We have used Maximum Entropy modelling for delineating the potential regions for the cultivation of
II. MATERIALS AND METHOD
MaxEnt 3.3.3k software (www.cs.princeton.edu/~schapire) was used as it requires only presence records and its efficacy has been well documented
(geographical coordinates) were drawn from
Arunachal Pradesh, Meghalaya, Tripura, Mizoram, Jharkhand, Andamans, Kerala, Karnataka and Tamil Nadu. For the MaxEnt model, 19 bioclimatic variables [B
temperature); bio2 (Mean diurnal range);
seasonality); bio5 (Max temperature of warmest month); month); bio7 (Temperature annual range);
(Mean temperature of driest quarter); (Mean temperature of coldest quarter);
wettest month);bio14 (Precipitation of driest month); (Precipitation of wettest quarter);
Scientific Journal Impact Factor: 3.762
International Journal of Applied And Pure Science and
Agriculture
www.ijapsa.com
2016, All rights Reserved e- ISSN: 2394 p- ISSN: 2394
Maximum Entropy (MaxEnt) modelling approach for predicting potential
climate suitable locations of popular banana varieties in India: I. Poovan
(AAB)
N. Sivaraj, K. Rameash and B. Sarath Babu
National Bureau of Plant Genetic Resources, Regional Station, Hyderabad 500 030, Telangana State
Abstract
Maximum Entropy modelling approach for predicting the potential climate suitable region for the sustainable cultivation of Poovan banana variety described in this article for the present and future climate (2050) scenario.
: Poovan variety, banana, GIS, MaxEnt modelling
I. INTRODUCTION
The Banana is the world’s most popular fruit and a staple crop for more than 400 India ranks first in terms of area and production, growing in about 4
ha with an annual production of 168, 13,500 mt sharing about 17% of global production. Among the states in India, Tamil Nadu, Karnataka and Maharashtra possesses major share in area and production of banana in the country. Poovan variety (AAB) is one of the leading commercial banana cultivars grown perennially throughout the country. Poovan has region
Palayankodan (Kerala), Karpura Chakkarakeli (Andhra
Tamil Nadu is the leading producer of Poovan cultivar owing to its climatic and marginal soil condition. Poovan is also commercially cultivated for leaf industry throughout Tamil Nadu It produces medium sized bunch (weighing around 25 kg) with more than 200 fruits of medium size. Fruit possess thin skin which peels slightly acidic, firm and has typical sour-sweet aroma. Crop duration is
Fruits turn to attractive golden yellow on ripening.
having closely packed fruits with good keeping quality and resistant to fruit cracking is its Considering its importance, an attempt has been made to map the climate
for the sustainable cultivation of Poovan banana variety
We have used Maximum Entropy modelling for delineating the potential regions for the cultivation of Poovan, a popular banana variety.
MATERIALS AND METHODS
MaxEnt 3.3.3k software (www.cs.princeton.edu/~schapire) was used as it requires only presence records and its efficacy has been well documented [1][2][3]. Presence records (geographical coordinates) were drawn from Poovan growing regions in India
nachal Pradesh, Meghalaya, Tripura, Mizoram, Jharkhand, Andamans, Kerala, Karnataka . For the MaxEnt model, 19 bioclimatic variables [Bio1 (Annual mean
Mean diurnal range); bio3 (Isothermality); bio4 (
Max temperature of warmest month); bio6 (Min temperature of coldest Temperature annual range); bio8 (Mean temperature of wettest quarter); Mean temperature of driest quarter); bio10 (Mean temperature of warmest quart
Mean temperature of coldest quarter); bio12 (Annual precipitation); bio13 (Precipitation of Precipitation of driest month); bio15 (Precipitation seasonality); Precipitation of wettest quarter); bio17 (Precipitation of driest quarter); bio18 (
International Journal of Applied And Pure Science and
270 ISSN: 2394-5532 ISSN: 2394-823X
Maximum Entropy (MaxEnt) modelling approach for predicting potential
climate suitable locations of popular banana varieties in India: I. Poovan
National Bureau of Plant Genetic Resources, Regional Station, Hyderabad 500 030,
Maximum Entropy modelling approach for predicting the potential climate suitable region described in this article for the
The Banana is the world’s most popular fruit and a staple crop for more than 400 India ranks first in terms of area and production, growing in about 4, 90,700 mt sharing about 17% of global production. Among the states in India, Tamil Nadu, Karnataka and Maharashtra possesses major share in area and production of banana in the country. Poovan variety (AAB) is one of the leading commercial banana cultivars grown perennially throughout the country. Poovan has region (Andhra Pradesh).
Tamil Nadu is the leading producer of Poovan cultivar owing to its climatic and marginal soil cultivated for leaf industry throughout Tamil Nadu bunch (weighing around 25 kg) with more than 200 fruits of medium size. Fruit possess thin skin which peels Crop duration is to attractive golden yellow on ripening. The bunch is good keeping quality and resistant to fruit cracking is its map the climate banana variety in the We have used Maximum Entropy modelling for delineating the
International Journal of Applied and Pure Science and Agriculture (IJAPSA) Volume 02, Issue 2, [February - 2016] e-ISSN: 2394-5532, p-ISSN: 2394-823X
@IJAPSA-2016, All rights Reserved 271 of warmest quarter); bio19 (Precipitation of coldest quarter)] with the 2.5 arc’ resolution were available from the Worldclim website (www. worldclim.org), which was used to describe the climate suitable regions for red banana in India. This database comprises many derived variables based on long-term temperature and rainfall that are often used for species niche modelling. Twelve candidate variables were selected by use of correlation tests to eliminate highly correlated variables and by assessment of their ecological relevance, given current knowledge of the target species. MaxEnt was used to evaluate the habitat suitability of Poovan variety based on its current range. Because species distribution models do not perform well if the climate in the target area is very different from the native and invaded ranges, a multivariate environmental similarity surface (MESS) was performed to determine the degree of model extrapolation in the areas of interest. DIVA-GIS version 7.5 [4] was used to generate maps by importing ASCI output files from MaxEnt. The Jacknife analysis was performed to indicate the most illuminating variables. The accuracy and performance of species distribution model was evaluated using threshold-independent receiver operation characteristic (ROC) analysis [2] [3] and threshold dependent binomial test of omission [3]. The area under the (AUC) ranges between 0 and 1. Models with an AUC value higher than 0.75 are acceptable ROC curve models [5]. Omission rates in optimal models are less than 0.05 [6].
Climate data for Future conditions were obtained from http://www.worldclim.org that
was downscaled global climate model (GCM) data from CMIP5 (IPPC Fifth Assessment). The ACCESS1-0 climate model developed by CSIRO (Commonwealth Scientific and Industrial Research Organisation, Australia) in collaboration with BOM (Bureau of Meteorology, Australia) was used for the analysis at a special resolution of 2.5-minute (of a longitude/latitude degree) that is about 4.5 km at the equator. The greenhouse gas scenario was kept as RCP 4.5 (representative concentration pathway) for the year 2050 (average for 2041-2060). The RCPs are consistent with a wide range of possible changes in future anthropogenic (i.e., human) greenhouse gas (GHG) emissions. RCP 4.5 assumes that global annual GHG emissions (measured in CO2-equivalents) peak around 2040, then with emissions declining substantially thereafter.
III. RESULTS AND DISCUSSION
Species distribution modelling techniques produce maps of the potential distribution of species [7]. MaxEnt [2][3] is a predictive biogeography programme that uses a maximum entropy algorithmto match known locality points for a species to potential localities, based on theirenvironmental characteristics. It is a useful technique as it does not require absence records tobuild a predictive model. We have used this technique to identify suitable locations to grow red banana in the changed climate regime.
International Journal of Applied and Pure Science and Agriculture (IJAPSA) Volume 02, Issue 2, [February
@IJAPSA-2016, All rights Reserved
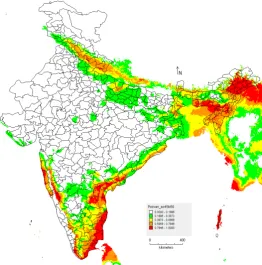
Fig.1. MaxEnt model generated for Poovan banana variety using current climate data
Fig.2 shows the omission rate and predicted area as a function of the cumulative threshold. The omission rate is calculated both on the training presence records, and (if test data are used) on the test records. The omission rate should be
omission, because of the definition of the cumulative threshold. the jackknife test of variable importance.
used in isolation is bio13, which therefore app
itself. The environmental variable that decreases the gain the most when it is omitted is bio19, which therefore appears to have the most information that isn't present in the other variables.
Fig.2. Omission and predicted area for Poovan variety in the MaxEnt model
International Journal of Applied and Pure Science and Agriculture (IJAPSA) Volume 02, Issue 2, [February - 2016] e-ISSN: 2394-5532,
p-2016, All rights Reserved
Fig.1. MaxEnt model generated for Poovan banana variety using current climate data
shows the omission rate and predicted area as a function of the cumulative threshold. The omission rate is calculated both on the training presence records, and (if test data are used) on the test records. The omission rate should be close to the predicted omission, because of the definition of the cumulative threshold. Fig.3 shows the results of the jackknife test of variable importance. The environmental variable with highest gain when used in isolation is bio13, which therefore appears to have the most useful information by itself. The environmental variable that decreases the gain the most when it is omitted is bio19, which therefore appears to have the most information that isn't present in the other
Fig.2. Omission and predicted area for Poovan variety in the MaxEnt model
International Journal of Applied and Pure Science and Agriculture (IJAPSA) -ISSN: 2394-823X
272
Fig.1. MaxEnt model generated for Poovan banana variety using current climate data
shows the omission rate and predicted area as a function of the cumulative threshold. The omission rate is calculated both on the training presence records, and (if test close to the predicted shows the results of The environmental variable with highest gain when ears to have the most useful information by itself. The environmental variable that decreases the gain the most when it is omitted is bio19, which therefore appears to have the most information that isn't present in the other
International Journal of Applied and Pure Science and Agriculture (IJAPSA) Volume 02, Issue 2, [February
@IJAPSA-2016, All rights Reserved
Fig.3. Result of Jackknife
Table 1 gives estimates of relative contributions of the environmental variables to the Maxent model. To determine the first estimate, in each iteration of the training algorithm, the increase in regularized gain is added to the contribution of the corresponding variable, o subtracted from it if the change to the absolute value of lambda is negative. For the second estimate, for each environmental variable in turn, the values of that variable on training presence and background data are randomly permuted. The model is reeva
permuted data, and the resulting drop in training AUC is shown in the table, normalized to percentages. As with the variable jackknife, variable contributions should be interpreted with caution when the predictor variables are correlated.
Table 1. Estimates of relative contributions of environmental variables to the Maxent model on
Variable
Precipitation of wettest month (bio13)
Precipitation of coldest quarter (bio19)
Isothermality (bio3)
Precipitation seasonality (bio15)
Mean temperature of wettest quarter (bio18)
Minimum temperature of the coldest month
Precipitation of wettest quarter (bio16)
Precipitation of driest month (bio14)
Min Temperature of coldest quarter (bio11)
Mean diurnal range (bio2)
Temperature seasonality (bio4)
Mean Temperature of Driest Quarter (bio9)
Annual mean temperature (bio1)
Mean temperature of the wettest quarter (bio8)
Mean Temperature of Warmest Quarter (bio10)
Annual Precipitation (bio12)
Precipitation of driest quarter (bio17)
Max temperature of warmest month (bio5)
Temperature annual range (bio7)
International Journal of Applied and Pure Science and Agriculture (IJAPSA) Volume 02, Issue 2, [February - 2016] e-ISSN: 2394-5532,
p-2016, All rights Reserved
Fig.3. Result of Jackknife test performed on Poovan banana variety
mates of relative contributions of the environmental variables to the Maxent model. To determine the first estimate, in each iteration of the training algorithm, the increase in regularized gain is added to the contribution of the corresponding variable, o subtracted from it if the change to the absolute value of lambda is negative. For the second estimate, for each environmental variable in turn, the values of that variable on training presence and background data are randomly permuted. The model is reevaluated on the permuted data, and the resulting drop in training AUC is shown in the table, normalized to percentages. As with the variable jackknife, variable contributions should be interpreted with caution when the predictor variables are correlated.
Estimates of relative contributions of environmental variables to the Maxent model on Poovan banana variety
Percent contribution Permutation importance
35.6 12.8 10.9 10.7
(bio18) 7.4
Minimum temperature of the coldest month (bio6) 5.5
4.7 3.5
(bio11) 2.9
2.9 1.7
(bio9) 0.8
0.5
(bio8) 0.1
(bio10) 0
0 0
(bio5) 0
0
International Journal of Applied and Pure Science and Agriculture (IJAPSA) -ISSN: 2394-823X
273 mates of relative contributions of the environmental variables to the Maxent model. To determine the first estimate, in each iteration of the training algorithm, the increase in regularized gain is added to the contribution of the corresponding variable, or subtracted from it if the change to the absolute value of lambda is negative. For the second estimate, for each environmental variable in turn, the values of that variable on training luated on the permuted data, and the resulting drop in training AUC is shown in the table, normalized to percentages. As with the variable jackknife, variable contributions should be interpreted with
Estimates of relative contributions of environmental variables to the
International Journal of Applied and Pure Science and Agriculture (IJAPSA) Volume 02, Issue 2, [February - 2016] e-ISSN: 2394-5532, p-ISSN: 2394-823X
@IJAPSA-2016, All rights Reserved 274 Fig. 4 represents the MaxEnt model for red banana generated for future climatic conditions (2050). The model indicates that potential climate suitable regions could be available in 2050 for the cultivation of Poovan banana variety in the states of Tamil Nadu, Western Ghats region (Kerala & Karnataka), Parts of North Eastern States, Uttarakhand, Himachal Pradesh, Andhra Pradesh, Odisha and West Bengal. However, Bihar and Jharkhand would be wiped out from cultivation of this Poovan variety in 2050 as these areas are falling under low probability. It is advised that alternative crops suitable for that period’s climatic conditions should be taken up for cultivation.
Fig.4. MaxEnt model generated for Poovan variety using future climate (year 2050)
MaxEnt integrates species occurrences with background data (i.e., randomly selected points) from spatial environmental variables representing different environmental gradients in the study area and generates probability of species’ presence[3]. It identifies areas that have conditions most similar to species’ current known occurrences and ranks them from 0 (unsuitable or most dissimilar) to 1 (most suitable or most similar). MaxEnt generates a set of feature classes (i.e., linear [L], quadratic [Q], product [P], threshold [T], and hinge [H]) using environmental variables. It uses a regularization multiplier (RM) to reduce the number of parameters and thus automatically controls the model complexity[3] [1]. The default RM value is 1; a smaller value of RM (1) may potentially overfit the model and produce more restricted distribution whereas a higher value (>1) would result in simpler models with less discriminating power and broader species potential distribution [2]. Therefore, tuning of MaxEnt model settings has been suggested for selecting an optimal model to enhance predictions[9][10].
International Journal of Applied and Pure Science and Agriculture (IJAPSA) Volume 02, Issue 2, [February - 2016] e-ISSN: 2394-5532, p-ISSN: 2394-823X
@IJAPSA-2016, All rights Reserved 275 climate change that may affect the crop growing conditions. It executes well on small sample sizes [34], which indicates that the multiplicative methods used in MaxEnt give better predictions than the discriminative methods employed by other techniques[1][3]. However, we have attempted to identify suitable locations for sustainable Poovan banana variety cultivation in our country in the changed climatic regime.
BIBLIOGRAPHY
[1] Elith J, Graham C H, Anderson R P, Dudík M, Ferrier S, Guisan A, Hijmans R J, Huettmann F, Leathwick R, Lehmann A, Li J, Lohmann L G, Loiselle B A, Manion G, Moritz C, Nakamura M, Nakazawa Y, Overton J Mc C, Peterson A T, Phillips J, Richardson K, Scachetti-Pereira R, Schapire E, Soberon J, Williams S, Wisz M and Zimmermann E 2006. Novel methods improve prediction of species' distributions from occurrence data. Ecography29: 129-151.
[2] Phillips S J and Dudik M 2008. Modeling of species distributions with Maxent: new extensions and a comprehensive evaluation. Ecography31: 161-175.
[3] Phillips S, Anderson R and Schapire R 2006. Maximum entropy modeling of species geographic distributions. Ecological Modelling190: 231-259.
[4] Hijmans R J, Guarino L and Mathur P 2012. DIVA-GIS Version 7.5, Manual. Available at: www.diva-gis.org.
[5] Pearce J and Ferrier S 2000. Evaluating the predictive performance of habitat models developed using logistic regression. Ecological Modelling133: 225-245.
[6] Anderson RP, Lew D, Peterson AT. 2003. Evaluating predictive models of species' distributions: criteria for selecting optimal models. Journal of Ecological Modelling 162: 211-232.
[8] Elith J and Leathwick J R 2009. Species Distribution Models: Ecological Explanation and Prediction Across Space and Time. AnnualReview ofEcologyand Systematics 40: 677-697.
[9] Shcheglovitova M and Anderson R P 2013. Estimating optimal complexity for ecological niche models: A jacknife approach for species with small sample size. Ecological Modelling 269: 9-17.
[10] Boria RA, Olson LE, Goodman SM, Anderson RP 2014. Spatial filtering to reduce sampling bias can improve the performance of ecological niche models. Ecol Modell275: 73-77.
[11] Villordon A, Njugana W, Simon G, Philip N, Heneriko K, Simon C J, Don L B.,Bernard Y, Phinehas T and Robert OMM 2006. Using GIS based tools and distribution modelling to determine sweet potato exploration and documentation priorities in Sub-Saharan Africa. Hort Science41: 1377-1381.
[12] Yost A C, Petersen S L, Gregg M and Miller R 2008. Predictive modeling and mapping sage grouse (Centrocercus urophasianus) nesting habitat using maximum entropy and a long-term dataset from
Southern Oregon. Ecological Informatics 3: 375-386.
[13] Klopfenstein N B, Kim M S, Hanna J W, Richardson B A and Lundquist J E 2009. Approaches to predicting potential impacts of climate change on forest disease: an example with Armillaria root disease. Res. Pap. RMRS-RP-76. Fort Collins, CO: U.S. Department of Agriculture, Forest Service, Rocky Mountain Research Station. 10 p.
[14] Kraft K H 2009. The domestication of the chile pepper, Capsicum annuum: genetic, ecological, and anthropogenic patterns of genetic diversity. Ph.D. Thesis. University of California, Davis, USA.
[15] Chamaille L, Tran A, Meunier A, Bourdoiseau G, Ready P and Dedet J P. 2010. Environmental risk mapping of Canine leishmaniasis in France. Parasites and Vectors3: 31. Doi: 10.1186/17563305-3-31.
[16] Kulkarni, M.A., Desrochers, R.E. & Kerr, J.T. 2010. High resolution niche models of malaria vectors in northern Tanzania: a new capacity to predict malaria risk? PLos One 5(2): e9396. Doi: 10.1371/
journal.pone.0009396.
[17] Ali Abdullah S.2011. cogeographic, genetic and taxonomic studies of the genus Lathyrus L. Ph.D. Thesis.
University of Birmingham, UK.
[18] Fischer D, Moeller P, Thomas S M, Naucke J T and Beierkuhnlein C 2011. Combining climatic projections and dispersal ability: a method for estimating the responses of sandfly vector species to climate change. PLos Neglected Tropical Diseases5: e1407. Doi: 10.1371/journal. pntd.0001407.
[19] Gormley A M, Forsyth D M, Griffioen P, Lindeman M, Ramsey D S L, Scroggie M P and Woodford L 2011. Using presence-only and presence-absence data to estimate the current and potential distributions of established invasive species. Journal of Applied Ecology 48: 25-34.
[20] Theissinger K 2011. Comparative phylogeography of two co-distributed arctic-alpine fresh water insect species in Europe. Ph.D. Thesis. Johannes Gutenberg-University Mainz, Germany.
[21] Advani N K 2012. Thermal ecology of the Glanville Fritillary butterfly (Melitaea cinxia). Ph.D. Thesis.
International Journal of Applied and Pure Science and Agriculture (IJAPSA) Volume 02, Issue 2, [February - 2016] e-ISSN: 2394-5532, p-ISSN: 2394-823X
@IJAPSA-2016, All rights Reserved 276 [22] David A.K, Keith L, Mc Dougall, Christopher CS and Jillian LW 2012. Spatial Analysis of Risks Posed by
Root Rot Pathogen, Phytophthora cinnamomi: Implications for Disease Management. Proceedings of Linnean Society of New South Wales134: 147-180.
[23] Gurgel-Gonqalves R, Galväo C, Costa J and Peterson A T 2012. Geographic distribution of Chagas disease vectors in Brazil based on ecological niche modelling. Journal of Tropical Medicine. Doi:
10.1155/2012/705326.
[24] Robinson J L 2012. Patterns of Ecological Performance and Aquatic Insect Diversity in High Quality Protected Area Networks. Ph.D. Dissertation, University of Tennessee, USA.
[25] Petersen M J 2013. Evidence of a climatic niche shift following North American introductions of two crane flies (Diptera; genus Tipula). Biological Invasions 15: 885- 897. Doi: 10.1007/s10530- 012-0337-3.
[26] Sánchez-Guillén R A, Muñoz J, Rodríguez-Tapia G, Feria Arroyo TP and Córdoba- Aguilar A 2013. Climate-Induced Range Shifts and Possible Hybridisation Consequences in Insects. PLoS One 8: e80531.
doi:10.1371/journal.pone.0080531
[27] Solhjouy-Fard S, Sarafrazi A, Moeini MM, Ahadiyat A 2013. Predicting habitat distribution of five heteropteran pest species in Iran. Journal of Insect Science 13:116.Available online: www.insectscience.org/13.116.
[28] Fourcade Y, Engler J O, Rodder D, Secondi J 2014. Mapping Species Distributions with MAXENT Using a Geographically Biased Sample of Presence Data: A Performance Assessment of Methods for Correcting Sampling Bias. PLoS One 9 (5): e97122. doi:10.1371/journal.pone.0097122.
[29] Williams K A, Richards C S and Villet M H 2014. Predicting the geographic distribution of Luciliasericata
and Luciliacuprina (Diptera: Calliphoridae) in South Africa. African Invertebrates 55: 157-170.
[30] Khoury C K, Heider B, Castañeda-Álvarez N P, Achicanoy H A, Sosa C C, Miller R E, Scotland R W, Wood J R I, Rossel G, Eserman L A, Jarret R L, Yencho G C, Bernau V, Juarez H, Sotelo S, de Haan S and Struik P C 2015. Distributions, ex-situ conservation priorities, and genetic resource potential of
crop wild relatives of sweet potato [Ipomoea batatas (L.) Lam.,I.series Batatas]. Front. PlantSci.6:251.
doi:10.3389/fpls.2015.00251.
[31] Zimmermann H, Loos J, Wehrden H and Fischer J 2015. Aliens in Transylvania: risk maps of invasive alien plant species in Central Romania. NeoBiota 24: 55-65.
[32] Reddy M T, Hameedunnisa Begum, Neelam Sunil, Someswara Rao Pandravada, Natarajan Sivaraj 2015a. Assessing Climate Suitability for Sustainable Vegetable Roselle (Hibiscus sabdariffa var. sabdariffa L.) cultivation in India Using MaxEnt Model. Agricultural and Biological Sciences Journal 1:
62-70.
[33] Reddy M T, Begum H, Sunil N, Pandravada S R, Sivaraj N and Kumar S 2015b. Mapping the Climate Suitability Using MaxEntModeling Approach for Ceylon Spinach (Basella alba L.) cultivation in India.
The Journal of Agricultural Sciences 10: 87-97.