R E S E A R C H A R T I C L E
Open Access
Stability indicating LC-MS/MS method for
estimation of lovastatin in human plasma:
application to a bioequivalence study
Arabinda Saha
*, Hemanth Jangala, Poonam Vats, Richa Thakur, Arshad Khuroo and Tausif Monif
Abstract
Background:Sensitive and selective analytical method is required for the estimation of lovastatin in human plasma as lovastatin has been reported to have high intra-subject variability and is converted to its active metabolite lovastatin hydroxy acid in in vitro system and vice versa. If this inter-conversion is not restricted, it could lead to pseudo estimation of lovastatin in human plasma.
Methods:A specific, sensitive, and reproducible high-performance liquid chromatography-tandem mass spectrometric (LC-MS/MS) method was developed and validated for determination of lovastatin in human plasma, using lovastatin-d3 as an internal standard. Lovastatin and lovastatin-d3were extracted from human plasma using solid phase extraction, separated on Luna C18 (2)100A (100 × 4.6 mm, 5μm) column with mobile phase consisting of acetonitrile and 2 mM ammonium acetate buffer (pH 3.6) in the ratio of 90:10,v/v. Quantification was achieved by monitoring transitions of
m/z422.1→285.4 for lovastatin and 425.4→285.4 for lovastatin-d3in multiple reaction monitoring, using turbo ion source in positive polarity.
Results:No matrix effect was observed within the linearity range of 0.121–35.637 ng/mL (r> 0.99). The degree of matrix effect for lovastatin was determined as 2.74 %, and it had no impact on incurred samples analysis with run time of 4.5 min. The intra- and inter-day precision values were within 11.38 and 8.62 % respectively, for lovastatin at the lower limit of quantification level.
Conclusions:Stability data indicated that lovastatin is stable under various handling conditions and with insignificant inter-conversion between lovastatin and lovastatin hydroxy acid. The method was successfully applied for the bioequivalence study of lovastatin after oral administration of 40 mg tablet in healthy volunteer.
Keywords:Bioequivalence study; Liquid chromatography-mass spectrometry; Lovastatin; Inter-conversion
Background
Lovastatin is a cholesterol-lowering agent, used in the treat-ment of hypercholesterolemia. It is a lactone, which hydro-lyzes readily in vivo to itsβ-hydroxy acid form, an inhibitor of 3-hydroxy-3-methylgluteryl-coenzyme A (HMG-CoA) reductase. HMG-CoA reductase catalyzes the conversion of HMG-CoA to mevalonate, which finally converted to cholesterol by subsequent biochemical pathways. Thus, inhibition of the HMG-CoA reductase activity limits the biosynthesis of cholesterol (Hsu et al. 1995; O’Connor et al. 1990). Following an oral dose of lovastatin, only about 30 %
of dose reaches the systemic circulation, with elevated plasma concentration in 2.0 h. It has protein binding of about 95 % (Mevacor®, Prescribing Information, 2012). It undergoes extensive first-pass metabolism in the liver, because of which the availability of the drug to the general circulation is low and variable. The metabolites of lovastatin in human plasma are 6′β-hydroxy acid lova-statin, 6′-exomethylene lovastatin, and 3″-hydroxy lova-statin (Jacobsen et al. 1998). Hydroxylation of lovalova-statin at 6′ position also occurs in ex vivo. Therefore, a sensitive and specific analytical method is required for the estima-tion of lovastatin in human plasma with optimized conditions, wherein inter-conversion between lactone and hydroxy acid form is controlled.
* Correspondence:[email protected]
Department of Clinical Pharmacology and Pharmacokinetics, Ranbaxy Laboratories Ltd., GP-5, HSIDC, Old Delhi Gurgaon Road, Udyog Vihar Industrial Area, Gurgaon 122 015Haryana, India
Although several analytical methods have been reported for the determination of lovastatin, but the sensitivity of published HPLC-UV methods (Islam et al. 2010; Lin et al. 2004; Lily et al. 2000; Mullangi et al. 2006; Strode et al. 1999) are inadequate for pharmacokinetic study and thera-peutic drug monitoring. In the reported gas chromatog-raphy–mass spectrometric method (Morris et al. 1993), the sensitivity was improved by derivatization, but it is a time-consuming process. LC-MS/MS methods (Dong et al. 2008; Haiyan et al. 2008; Lin et al. 2008; Nageswararao et al. 2012; Ramakrishna et al. 2007; Xiao et al. 2006; Xiu and Chris 2003; Wu et al. 1997) have also been reported with increased sensitivity but the inter-conversion between lovastatin to lovastatin hydroxy acid has not been studied in these methods, which could lead to pseudo estimation of lovastatin in plasma. Although the kinetics of in vitro inter-conversion between lactone and its hydroxy acid form has been reported by Kearney et al. (1993) and Won (1994), its application for the estimation of lovastatin in the bioequivalence study has not been reported till date.
The developed method has numerous advantages over other existing methods. The pros of the developed method includes the following: less aliquot volume compared to methods developed by Xiao et al. (2006), Lin et al. (2008), and Nageswararao et al. (2012); better sensitive compared to methods developed by Lily et al. (2000), Mullangi et al. (2006), and Islam et al. (2010); inhibiting the in vitro inter-conversion between lovastatin and lovastatin hydroxy acid results in accurate estimation of lovastatin in incurred samples and this was not reported by Wu et al. (1997), Lin et al. (2008), and Dong et al. (2008).
Methods
Chemicals and materials
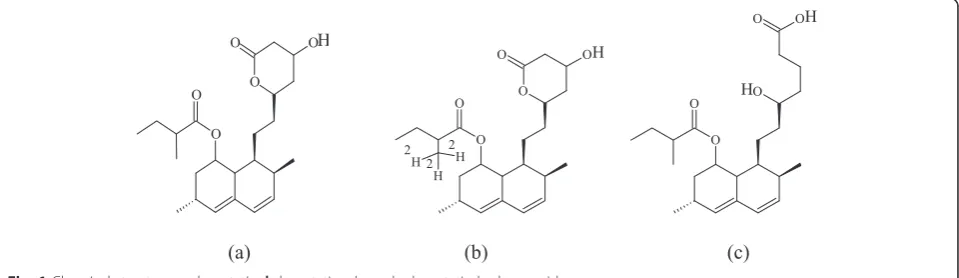
Lovastatin (LS, Lot No.: H4K027, purity: 99.6 %), lova-statin hydroxy acid (LHA, Lot No.: 13-MJC-79-1, purity: 89.5 %), and lovastatin-d3 (internal standard, IS, Batch No.: CS-LS-455, purity: 97.87 %) were procured from the United State of Pharmacopeia, Toronto Research Chemi-cals Inc., Canada, and Clearsynth Labs (P) Ltd., India,
respectively (chemical structures are shown in Fig. 1). Am-monium acetate and acetonitrile were procured from Fluka (Sigma-Aldrich, Steinheim, USA). Glacial acetic acid (analytical reagent) was obtained from Fischer Scientific, India. Milli-Q water (Millipore, Moscheim Cedex, France) was used in the preparation of solutions. Cleanert PEP-3, 30 mg/1 cc, solid-phase extraction (SPE) cartridges were obtained from Agela Technologies (Tianjin, China). Hu-man plasma lots containing K3EDTA (ethylenediaminetet-raacetic acid tripotassium salt, as anticoagulant) were obtained from Biological Specialty Corporation, PA, USA.
LC-MS/MS instrumentation and chromatographic conditions Chromatographic separation was carried out on a Shimadzu scientific instrument (Shimadzu Corporation; Kyoto, Japan) with a Luna C18 (2) 100A column (100 × 4.6 mm, 5μm) (Phenomenex). A mobile phase consisting of acetonitrile and 5 mM ammonium acetate buffer (pH 3.6) in the ratio of 90:10,v/v, was delivered at a flow rate of 0.7 mL/min. The total analysis run time for each sample was 4.5 min. The ionization and detection were carried out on a triple quadruple mass spectrometer, MDS Sciex API-4000 (Sciex Division of MDS, Toronto, Ontario, Canada), equipped with electrospray ionization operated in positive polarity using multiple reaction monitoring (+MRM). The compound and source parameters were op-timized by infusing individual solution of LS, IS, and LHA into the mass spectrometer. The optimized compound pa-rameters for monitoring LS and IS were set as follows: declustering potential (DP), 38 V; entrance potential (EP), 10 V; collision energy (CE), 20 V; and collision cell exit potential (CXP), 7 V. The optimized compound parame-ters for monitoring LHA were set as follows: DP 48 V, EP 5 V, CE 20 V, and CXP 8 V. The source parameters of the mass spectrometer were optimized and maintained as fol-lows: collision-activated dissociation (CAD) gas, 6 psi; cur-tain gas (CUR), 20 psi; nebulizer gas (GS1), 60 psi; heater gas (GS2), 40 psi; turbo ion spray voltage, 4500 V; and source temperature, 450 °C. Quadrupole 1 and quadru-pole 3 were both maintained at unit resolution, and dwell
time was set at 200 ms for all analytes. The mass transi-tions were selected as 422.1→285.4 for LS, 425.4→285.4 for IS, and 423.3→303.7 for LHA. The data acquisition and processing were performed by Analyst version 1.4.2 software (MDS Sciex, Toronto, Canada). For quantifica-tion, the peak area ratios of the target ions of the analyte to those of the internal standard were compared with weighted 1/X2 (where X= drug concentration) least squares calibration curves in which the peak area ratios of the calibration standards were plotted versus their concentrations.
Preparation of stock solutions, calibration standards, and quality control samples
Two separate stock solutions of LS were prepared for bulk spiking of calibration standards (CS) and quality control (QC) samples for method validation exercises as well as incurred sample analysis. Stock solution of LS, IS, and LHA were prepared in acetonitrile at concentra-tion of 1 mg/mL. Working soluconcentra-tions for CS and QC samples were prepared by appropriate dilution in acetonitrile-water (50:50, v/v). Blank human K3EDTA plasma was screened prior to spiking to ensure that there is no significant endogenous interference at the re-tention time (RT) of LS and its IS. An 8-point CS and QC samples at four concentration levels were prepared by spiking the blank plasma with an appropriate amount of LS. CS were made at concentrations of 0.121, 0.328, 1.642, 4.105, 10.264, 17.106, 28.510, and 35.637 ng/mL and QC samples at lower limit of quantification (LOQQC), low-quality control (LQC), medium-quality control (MQC), and high-quality control (HQC) at con-centrations of 0.122, 0.359, 14.358, and 28.716 ng/mL, respectively. To prevent inter-conversion between LS and LHA, 3 % formic acid solution (v/v) was added in spiked plasma in the ratio of 5:95 (v/v) during bulk spik-ing. Spiking was carried out in ice-cold water bath under low light condition, and bulk spiked CS and QC samples were stored below −50 °C and protected from light till use. The working solution of IS (150.0 ng/mL) for rou-tine use was prepared by diluting the IS stock solution in acetonitrile-water (50:50,v/v).
Sample preparation
Plasma sample (300μL) was aliquoted, and 50μL of IS working solution (150.0 ng/mL of IS) was added in ice-cold water bath and vortexed. To this sample, 500 μL of 100 mM ammonium acetate buffer was added and then samples were vortexed. The pretreated samples were loaded onto the pre-conditioned cartridge (Clea-nert PEP-3, 30 mg/1 cc) and spun in centrifugation at 4000 rpm for 1 min at 2–10 °C. The cartridges were washed with 1 mL of 20 % methanol in water (v/v), and analytes were eluted with 1 mL of acetonitrile. The
extracted samples were evaporated to dryness at 20 psi and at 40 °C under a stream of dry nitrogen using a Zymark TurboVap LV evaporator (Caliper, Hopkinton, MA, USA). Dried residue was reconstituted with 300 μL of reconstitution solution consisting of acetonitrile and 5 mM ammonium acetate buffer (pH 3.6) in the ratio of 60:40, v/v. The reconstituted samples of 20 μL volume were used for injection in LC–MS/MS system.
Inter-conversion between LS and LHA
Role of temperature
Working solution of LS was spiked into human K3EDTA plasma at LQC and HQC level. The spiked samples were kept at different storage conditions ,i.e., room temperature and ice-cold water bath to study the impact of temperature on conversion of LS to LHA. After 6.0 h, four aliquots of each samples stored at different conditions were processed with freshly spiked CS and were analyzed in LC-MS/MS system by monitoring both mass transitions of LS and LHA in MRM.
Role of pH
After evaluating the impact of temperature on conver-sion, ice-cold water bath condition was maintained for storing of plasma samples on bench. However, it was ob-served that temperature is not a single parameter to control the conversion, hence the role of pH on inter-conversion was investigated in in vitro system. For this purpose, separate working solutions of LS and LHA were prepared in acetonitrile-water (50:50,v/v) and spik-ing was carried out in followspik-ing ways in human K3EDTA plasma to attain concentration of 10.0 ng/mL for each analyte:
a. Protocol-I (control-normal plasma)
b. Protocol-II (acidified plasma, pH 6.0 adjusted with formic acid solution)
c. Protocol-III (acidified plasma, pH 4.0 adjusted with formic acid solution)
Spiked samples were kept in ice-cold water bath and under low light condition, and four aliquots of these sam-ples were processed at time intervals 0.0, 2.0, 4.0, and 6.0 h and were analyzed in LC-MS/MS system by moni-toring both mass transitions of LS and LHA in MRM.
Method validation
re-injection reproducibility, and stability of LS during both short-term sample processing and long-term storage.
The selectivity of the method towards endogenous plasma matrix components, metabolites, and concomitant medications was assessed after screening ten lots (6 normal, 2 haemolyzed, and 2 lipemic) of human K3EDTA plasma, free from all analyte of interest. These samples were proc-essed using the proposed extraction protocol and analyzed with the set chromatographic conditions of LS at lower limit of quantification (LOQ) level. The peak area of the co-eluting components or interferences in blank sample at the retention time of LS and IS should be less than 20 and 5 % of mean peak area of LS and IS in spiked LOQ sample, respectively. The sensitivity was demonstrated by determin-ing the signal to noise (S/N) ratio in all ten lots of screened plasma and spiked LOQ samples. The S/N ratio of spiked LOQ samples was calculated using following formula:
S Nratio¼
Signal to noise ratio of LOQ
Mean signal to noise ratio of blanks > 5
Three calibration curves were used to demonstrate the linearity of the method. The ratio of area responses for lovastatin was used for regression analysis. Each calibra-tion curve was analyzed individually by using least square weighted (1/X2) linear regression (obtained by best fit method). Back calculations were made from these curves to determine the concentration of lovastatin in each cali-brator. A correlation coefficient r> 0.99 was desirable for all the calibration curves. The analyte peak of LOQ sam-ple should be identifiable, discrete, and reproducible with a precision (% CV) of <20.0 and accuracy within ±20.0 %. The deviation of standards other than LOQ from the nominal concentration should not be more than ±15.0 %.
The intra- and inter-day precision and accuracy were performed for lovastatin in K3EDTA plasma. The intra-run (within a day) and inter-intra-run (between days) accuracy was determined by replicate analysis of QC samples (n= 6) at LOQQC, LQC, MQC, and HQC. The precision of the method was determined by calculating the coefficient of variation (% CV) for each QC level. The deviation at each concentration level from the nominal concentration was expected to be <15.0 except for the LOQQC, for which it should be <20.0. Similarly, the mean accuracy should be within ±15.0 % except for at the LOQQC, for which it should be ±20.0 % of the nominal concentration.
The process efficiency (PE) for LS and IS at low, mid-dle, and high QC concentration levels were determined by measuring the mean peak area response of LS in six replicates of extracted QC samples (spiked before ex-traction) against the mean peak area response of LS in unextracted samples (neat samples) containing LS and IS at concentrations equivalent to those obtained in the final extracted concentration for LS and IS in the QC
samples. Process efficiency (PE) of LS and IS were esti-mated by using the following equation:
% PE¼ Mean peak area of analyte in extracted samples Mean peak area of analyte in neat sample solution 100
The absolute matrix effect (AME) was estimated by the following equation:
% AME ¼ Mean peak area of analyte in post extracted samples Mean peak area of analyte in neat solution 100
where AME = 1 indicates no matrix effect, AME < 1 indicates ion-suppression, and AME > 1 indicates ion en-hancement. As extraction protocol involved a terminal drying step, hence spiking (addition of reference sam-ples) was carried out in post-extracted blank plasma sample to perform AME. The concentration of LS and IS in reference sample representing the QC concentra-tion (at LQC, MQC, and HQC level). The control sam-ple was a reference solution prepared at appropriate concentration in a reconstitution solution.
Relative matrix effect (RME) was evaluated using six lots of human K3EDTA plasma including one hemolyzed and one lipemic plasma lot, processed in duplicate sam-ples at LOQQC and HQC levels and the area ratio (i.e., peak area response of LS/peak area response of IS) was used to check the acceptability of the result. The standard deviation for each lot was calculated, along with % CV and % bias at each level. The deviation of the standards should not be more than ±15 % of their respective nominal con-centration, and at least 90 % of the lots at each QC level should be within the aforementioned criteria.
Stability experiments were carried out to examine the sta-bility of LS in stock solution and in plasma samples under different conditions. Stock solution stability was performed by comparing peak area response of LS and IS in stability sample, with the peak area response of sample prepared from fresh stock solution. Stability studies in plasma were performed at LQC and HQC level using four replicates at each level. The analyte was considered stable if the % change is less than 15, as per US FDA/EMEA guidelines and was calculated by using the following formula:
% change ¼ S F−1
100
WhereS= mean concentration of stability samples and F= mean concentration of freshly spiked samples.
comparing the stability samples that had been frozen at −50 °C and thawed at room temperature three times, with freshly spiked QC samples. Four aliquots each of LQC and HQC concentration level were used for the freeze-thaw stability evaluation. For long-term stability evalu-ation, the concentrations obtained after 121 days were compared with initial concentrations. All stability exer-cises were performed against freshly spiked CS.
Human K3EDTA whole blood spiked with working so-lutions (at LQC and HQC level) were prepared and after spiking spiked sample was split into two aliquots (A and B). Aliquot A was placed for 10 min in ice-cold water bath, centrifuged at 4 °C, and the resulting plasma was used as comparison sample. Aliquot B was kept in ice-cold water bath for 2.0 h, centrifuged at 4 °C, and the resulting plasma (stability samples) was analyzed with the comparison samples in the same batch to access the % stability dur-ing the sample collection process. The analyte (LS) was considered stable if the % stability is 85–115 and was calculated by using following formula:
%stability ¼ Mean area ratio of stability samples
Mean area ratio of comparison samples 100
Re-injection reproducibility was performed by re-injecting all QC samples (i.e., LOQQC, LQC, MQC, and HQC) from an accepted precision-accuracy batch during validation. The calculated concentration of re-injected QC samples was determined against the CS samples from the same precision and accuracy batch which was analyzed 48 h before. The % difference between original and re-injected value was calculated by using the following formula:
% difference ¼ jOriginal concentration ‐ re‐injected concentrationj Original concentration
100
The dilution integrity experiment was performed with an aim to validate the dilution test to be carried out on higher analyte concentrations above upper limit of quantification (ULOQ), which may be encountered during real incurred sample analysis. Dilution integrity test was performed by preparing samples at a concentration approximately two times the concentration of 90 % ULOQ. These samples were diluted to two and four times with blank plasma to bring the concentration within calibration curve and then analyzed against fresh CS samples. The acceptance criteria for the diluted QC samples are the same as that of QC samples in precision and accuracy run.
Method application
The method was applied to an open-label, balanced, randomized, two-treatment, four-period, two-sequence, single dose, crossover design study of lovastatin in healthy human volunteers under fed condition for the assessment of bioequivalence. A single oral dose of
lovastatin mg tablet of Ranbaxy and Medostatin 40-mg tablet of Medochemie Limited, Cyprus, marketed by Kodomedic sdn. Bhd, Malaysia, was given to the human volunteers during the study. The bio-study was carried out in accordance with the principles of Good Clinical Practices defined in the ethical guidelines for Biomedical Research on human participants issued by Indian Coun-cil of Medical Research, New Delhi, the ICH E6 Guid-ance for ‘Guidance on Good Clinical Practice,’ and the principles enunciated in the Declaration of Helsinki on 36 healthy volunteers from whom prior informed con-sent was taken. The bio-study protocol was approved by the Jamia Hamdard Institutional Review Board, New Delhi, India. Blood samples were collected at 0.500, 1.000, 1.333, 1.667, 2.000, 2.333, 2.66, 3.000, 3.333, 3.667, 4.000, 4.333, 4.667, 5.000, 6.000, 9.000, 12.000, 16.000, 24.000, 36.000, and 48.000 h post dose in each period. All blood samples were collected in K3EDTA vacutainers and processed by centrifugation to collect plasma and stored below−50 °C until analysis.
Incurred sample reanalysis (ISR) reinforces the confi-dence in a bioanalytical method by demonstrating re-producibility in the measurement of study data. The possible causes of irreproducibility in ISR can be due to many reasons, which may include the following: stabil-ity issues - conversion of metabolite to its parent com-pound, isomeric changes, or effect of pH; drug-protein binding differences in subject samples; issues related to matrix interference - general and those associated with phospholipids; concomitant medications; sample pro-cessing technique - variations in process efficiency. Therefore, reproducibility of the method was confirmed by performing ISR. ISR was assessed using a total of 201 sample sets, selected from 31 subjects who com-pleted all four periods of the study. The incurred sam-ples from a Cmax time point and elimination phase (at least three times of LOQ concentration) comprising of 80 % sample set and the remaining 20 % as random sample time points were selected. The acceptance cri-terion for the ISR analytical run was 67 % (two-thirds of the total sample size) and should lie within 20 % dif-ference (Viswanathan et al. 2007). The % difdif-ference from the original analysis was calculated as:
%difference ¼ ðReanalyzed concentrationOriginal concentrationÞ
Mean concentration 100
Results and discussion
Optimization of mass parameters and chromatographic conditions
it is essential to develop a sensitive method with low LOQ (0.1 ng/mL) for 40 mg strength. In order to de-velop a method with the desired LOQ, it was necessary to use MS-MS detection.
Even though LS has a carboxylic acid moiety, electro-spray ionization in negative polarity was less sensitive than the positive polarity. Initially, mass parameters were also tuned in atmospheric pressure chemical ionization (APCI) and electrospray ionization (ESI) ion sources, but inadequate response was observed in APCI ion source. Various adducts have been reported in positive polarity to further increase the sensitivity of lactone (Wu et al. 1997; Daniel et al. 2000). Use of am-monium acetate solution in mobile phase helped in the
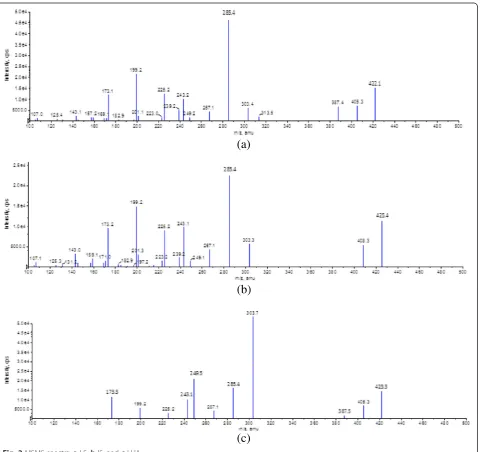
formation of ammonium adducts of LS [M + NH4]+ which increased sensitivity of the method by 20 folds. Ammonium adduct was selected as parent ion, m/z 422.1. During the product ion scan, the major product ions at m/z 199, 225, 239, 267, and 285 were observed. Based on the signal intensity of the product ion of m/z 285.4 which was generated by loss of ester side-chain and H2O from the parent ion, it was selected as a prod-uct ion for LS and transition of m/z 425.4→285.4 was selected for IS in MRM mode. During optimization, it was observed that CE and CAD are the most critical parameters to achieve highest sensitivity and stable re-sponse for LS. Product ion spectra of LS, IS, and LHA are shown in Fig. 2.
(a)
(b)
(c)
For the separation of LS and LHA, several C18 and phenyl columns like Poroshell 120 EC-C18, Ascentis express, Sunshell C18, Kinetex C18, Hypurity advance, Zorbax SB-C18, Discovery C18, Unisol C18, Luna C18(2), kinetex PFP, and ACE C18 PFP were tried. Many columns with fused core technology were also evaluated to attain resolution between LS and LHA, but due to high back pressure, these columns could not be used. LS and LHA were chromatographically well separated on Luna C18 (2) 100A (100 × 4.6 mm, 5 μm) column with high S/N ratio for LS. This could be due to lower carbon loading of the column, enabling the se-lectivity by base material of the column, and lower carbon load reduces RT of analyte and increased high throughput. The use of methanol as an organic phase led to high back-pressure, and high aqueous portion in mobile phase sup-pressed the peak area response of LS. However, the mixture of ammonium acetate buffer and acetonitrile (90:10,v/v) was found optimal, with very low background noise and optimum back pressure. In addition, mobile phase with high organic solvent ratio increased the ionization efficiency of LS. The analytes (i.e., LS and LHA) were chromatographically separated from phospholipids and other endogenous components at pH 3.6, which was attained by the addition of glacial acetic acid in ammo-nium acetate buffer. The absence of co-eluting peaks as
well as interference from matrix ions was minimal with a Luna C18 (2) column in combination with mobile-phase ammonium acetate buffer and acetonitrile (90:10,v/v).
Selection of IS
In LC-MS/MS analysis, selection of IS with similar chro-matographic and mass spectrometric behavior to that of analyte is of utmost priority. The best IS is a stable iso-tope form of the analyte which proves to be helpful when significant matrix effect is possible. Therefore, lovastatin-d3was selected as an IS.
Role of temperature and pH on inter-conversion
The stability QC samples which were stored in ice-cold water bath showed higher % accuracy as compared to those QC samples stored at room temperature (Table 1). This indicated that the rate of degradation of LS to LHA was facilitated at room temperature. Upon storing of spiked samples at room temperature, LS peak area decreased by 25.6 and 17.0 % at LQC and HQC level, respectively, when compared with samples stored in ice-cold water bath condition, whereas LHA peak area increased approximately by 1.24 times (Table 1).
Although the % accuracy of stability QC samples which were stored in ice-cold water bath (protocol-A) was higher than that of room temperature (protocol-B),
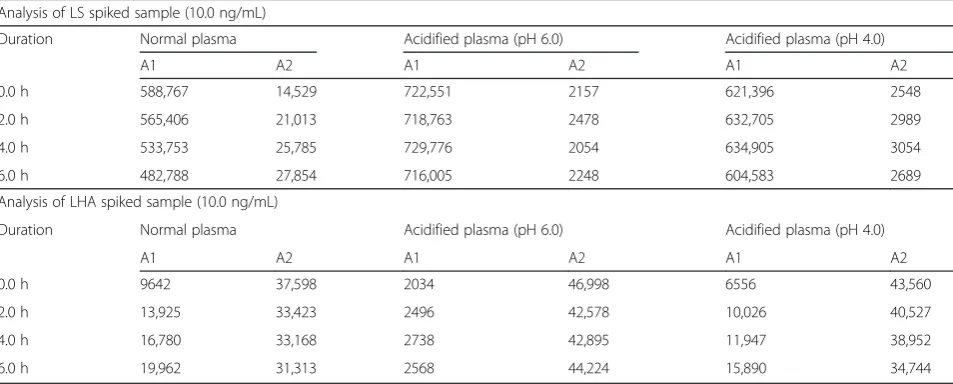
Table 2Role of pH in plasma on inter-conversion (n= 4)
Analysis of LS spiked sample (10.0 ng/mL)
Duration Normal plasma Acidified plasma (pH 6.0) Acidified plasma (pH 4.0)
A1 A2 A1 A2 A1 A2
0.0 h 588,767 14,529 722,551 2157 621,396 2548
2.0 h 565,406 21,013 718,763 2478 632,705 2989
4.0 h 533,753 25,785 729,776 2054 634,905 3054
6.0 h 482,788 27,854 716,005 2248 604,583 2689
Analysis of LHA spiked sample (10.0 ng/mL)
Duration Normal plasma Acidified plasma (pH 6.0) Acidified plasma (pH 4.0)
A1 A2 A1 A2 A1 A2
0.0 h 9642 37,598 2034 46,998 6556 43,560
2.0 h 13,925 33,423 2496 42,578 10,026 40,527
4.0 h 16,780 33,168 2738 42,895 11,947 38,952
6.0 h 19,962 31,313 2568 44,224 15,890 34,744
A1mean peak area observed at RT of LS (m/z: 422.1→285.4),A2mean peak area observed at RT of LHA (m/z:423.3→303.7) both in positive ion mode Table 1Role of temperature on inter-conversion (n= 4)
A B
QC sample % accuracy Protocol-A Protocol-B
Protocol-A Protocol-B A1 A2 A1 A2
LQC (0.359 ng/mL) 84.25 ± 1.86 61.37 ± 0.82 22,140 2015 16,470 2514
HQC (28.716 ng/mL) 86.07 ± 3.44 68.87 ± 3.40 1,704,693 68,417 1,413,647 82,503
Protocol-A: Samples were kept in ice-cold water bath for 6.0 h. Protocol-B: Samples were kept at room temperature for 6.0 h
it was not in the acceptable limits. It indicated that the conversion pathway for LS to LHA was not blocked in ice-cold water bath condition. Hence, the role of pH on in vitro inter-conversion of LS and LHA was investi-gated. From Table 2 data, we could conclude that pH
has a prime role in controlling the inter-conversion between LS and LHA in plasma. In normal plasma (at pH 7.4), LS gets converted to LHA and at pH 4.0, LHA gets converted to LS. The rate of conversion is increased from LS to LHA at higher pH and LHA to LS at lower
Table 3Intra-and inter-run results
QC sample % intra-run
accuracya
% inter-run accuracyb
% intra-run precisionc
% inter-run precision
LOQQC (0.122 ng/mL) 97.34 98.12 11.38 8.62
LQC (0.359 ng/mL) 103.74 102.24 6.26 4.92
MQC (14.358 ng/mL) 102.88 103.34 2.29 1.91
HQC (28.716 ng/mL) 102.94 103.50 1.98 1.73
a
n= 6, expressed as 100 × mean calculated concentration/nominal concentration
b
Values obtained from all three runs (n= 18)
c
n= 6
pH. In ice-cold water bath and at pH 6.0, there was no change in mean peak area response for both analytes with respect to time. So based on these results, we concluded that both pH and temperature have a role on inter-conversion. Finally, pH 6.0 and ice-cold water bath con-dition were maintained for spiked samples to inhibit the inter-conversion.
Sample preparation
The samples pretreated with 100 mM ammonium acet-ate buffer solution were extracted using SPE cartridge. This extraction procedure gave higher PE and cleaner sample. Due to hydrophobic nature of LS, different poly-meric cartridges like Oasis HLB, Bond Elut Plexa, Cleanert PEP-H, and Cleanert PEP-3 were tried during method development. The high PE and consistent results were obtained in sample prepared using Cleanert PEP-3 car-tridges. Inconsistency in peak area response of LS and IS was observed during analysis of extracted samples. This could be due to low solubility of LS and IS in the mobile phase that was finalized during chromatographic optimization. Low solubility of LS and IS could be due to the high hydrophobic nature of these compound, which led to suppressed LS and IS peak area response in the ex-tracted samples. Therefore, the reconstitution solution composition was further optimized and it was observed that reconstitution solution consisting acetonitrile 2 mM
ammonium acetate (pH 3.6) buffer (60:40,v/v) was suit-able for solubility of LS and IS and gave consistent IS peak area throughout the analytical batch of larger sample size.
Method validation
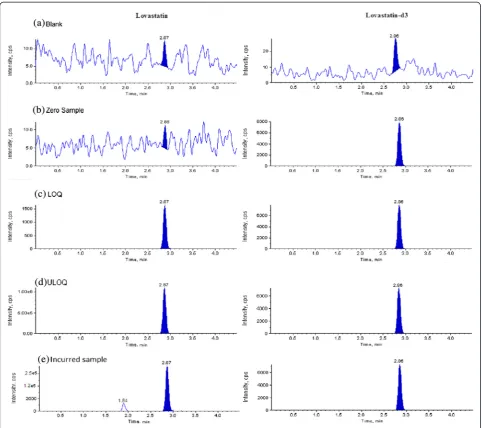
There was no significant interference observed at the RT of LS and IS in screened plasma lots. The typical chro-matograms of blank sample, blank processed with IS, LOQ, and ULOQ, and incurred sample in human plasma are shown in Fig. 3. We observed that S/N ra-tio was >25 during method validara-tion and incurred sample analysis, which was within acceptable limit as per the USFDA/EMEA guidelines.
The limit of quantitation was 0.121 ng/mL of LS in plasma. The precision and accuracy at LOQQC level were 8.62 and 98.12 %, respectively. The calibration curve was linear from 0.121 to 35.637 ng/mL for LS in plasma. Cali-bration curve was constructed using peak area ratio of an-alyte to internal standard and by applying linear, weighted least squares regression analysis with weighting factor of 1/(concentration)2. The ‘r’ was greater than 0.99 during the course of precision and accuracy batches. The results of three precision and accuracy batches are summarized in Table 3. The intra-day precision and inter-day precision (% CV) ranged from 1.73 to 11.38 %, and the intra- day and inter-day accuracy ranged from 97.34 to 103.74 %.
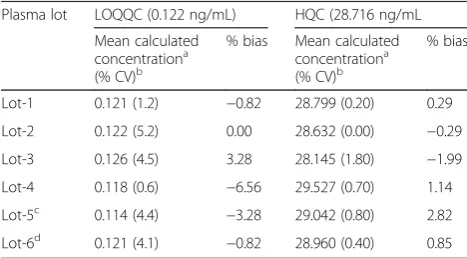
Table 5Relative matrix effect of lovastatin
Plasma lot LOQQC (0.122 ng/mL) HQC (28.716 ng/mL
Mean calculated concentrationa (% CV)b
% bias Mean calculated concentrationa (% CV)b
% bias
Lot-1 0.121 (1.2) −0.82 28.799 (0.20) 0.29
Lot-2 0.122 (5.2) 0.00 28.632 (0.00) −0.29
Lot-3 0.126 (4.5) 3.28 28.145 (1.80) −1.99
Lot-4 0.118 (0.6) −6.56 29.527 (0.70) 1.14
Lot-5c 0.114 (4.4) −3.28 29.042 (0.80) 2.82
Lot-6d 0.121 (4.1) −0.82 28.960 (0.40) 0.85 a
Mean of duplicate observations at each concentration
b
Coefficient of variation
c
Hemolyzed plasma
d
Lipemic plasma
Table 6Stability of lovastatin in different storage conditions (n = 4)
Stability Level A % CV B % CV % change
Autosampler stability (~76.90 h, 10 °C)
LQC 0.358 7.00 0.359 1.57 −1.95
HQC 28.832 1.27 28.716 1.38 1.36
Bench top stability (~8.82 h, in ice-cold water bath)
LQC 0.358 1.46 0.359 2.60 2.64
HQC 28.832 1.82 28.716 1.85 −0.57
Freeze-thaw stability (three freeze-thaw cycle)
LQC 0.358 1.46 0.359 2.75 2.05
HQC 28.832 1.82 28.716 1.85 0.36
Long-term stability (121 days, below −50 °C)
LQC 0.358 2.35 0.359 2.43 0.00
HQC 28.832 0.63 28.716 0.96 3.94
Acomparison sample concentration (ng/mL),Bstability sample concentration (ng/mL),CVcoefficient of variation
Table 4Absolute matrix effect and process efficiency of lovastatin
QC sample Aa(% CV)b Bc(% CV)b Cd(% CV)b Absolute matrix effect (% AME)e Process efficiency (%PE)f
LQC 35,950 (3.6) 35,521 (4.3) 27,239 (4.1) 98.81 75.77
MQC 1,415,891 (1.6) 1,406,632 (4.3) 1,130,372 (7.3) 99.35 79.83
HQC 2,716,145 (0.9) 2,641,614 (0.8) 2078,894 (1.8) 97.26 76.54 a
Mean area response of six replicate samples prepared in reconstitution solution
b
Coefficient of variation
c
Mean area response of six replicate samples prepared by spiking in extracted blank plasma sample
d
Mean area response of six replicate samples prepared by spiking before extraction
e
B/A × 100
f
Absolute matrix effect (AME) has a significant role in electro spray ionization mass spectrometry, which influ-ences the ionization of analyte by ion suppression or en-hancement. The % CV of AME at QC level was in range of 0.84–4.50, and between three QC levels, it was 1.31. The results indicated there was no significant matrix ef-fect for analyte, followed by the extraction procedure of the method. The PE of LS and IS were consistent across the QC levels. The mean PE of LS and IS by the method were 77.38 and 75.04 %, respectively. The % CV of mean PE across the low, middle, and high QC levels was <3. The results of AME and PE are presented in Table 4, and relative matrix effect (RME) results are presented in Table 5.
Stock solution stability of LS and IS were established for 13 days at specified conditions and % stability of LS and IS were 102.01 and 101.67, respectively. LS was proved to be stable in plasma for three freeze-thaw cycles. Bench top stability of LS was established for 8.82 h in human plasma in ice-cold water bath and under low light conditions. Autosampler stability was assessed for 76.90 h, and long-term stability was established at−50 °C for 121 days. The observed mean
nominal concentration of LS was found to be within ±15 % of their respective nominal concentration and % CV was less than 15 at LQC and HQC levels (Table 6). Lovastatin was stable in human K3EDTA whole blood for ~2.0 h.
Re-injection reproducibility of LS was established by re-injecting QC samples of precision and accuracy batch-3 and quantitated against original analyzed cali-bration curve of precision and accuracy batch-3. The % differences for all re-injected QC samples are≤7.45.
Method application
Following analysis, pharmacokinetic parameters like peak plasma concentration (Cmax), time (Tmax) to reach Cmax, t1/2, and (AUC0→t) were calculated by non-compartmental analysis using WinNonlin Professional software (version 5.0, Pharsight Corp., Mountain View, CA, USA). The pharmacokinetic parameters summarized in Table 7 are the mean estimates obtained from 31 subjects, who com-pleted all periods of the study. The linear plot of mean plasma concentration (ng/mL) versus time (h) is shown in Fig. 4. ISR results demonstrated that the samples with percentage difference within ±20 % was 97.01 %.
Conclusions
In summary, a rapid, selective, specific, reproducible, and high-throughput LC-MS/MS method was developed and validated to estimate lovastatin in human plasma using lovastatin-d3as an internal standard. The proposed method showed good performance with respect to all the validation parameters tested, demonstrated optimized working conditions for lovastatin in human plasma with minimal inter-conversion, and was successfully employed for a bioequivalence study of lovastatin after oral adminis-tration of 40-mg tablet.
Fig. 4Plasma concentration profile. Linear plot of mean plasma concentration (ng/mL) versus time (h) of lovastatin (n= 31); R1, R2: reference drug; T1, T2: test drug
Table 7Pharmacokinetic parameters of lovastatin, after administration of an oral dose of 40 mg of lovastatin test and reference formulation of 31 healthy human volunteers
(Mean ± SD)
Parameters Test Reference
Tmax(h) 3.12 ± 1.28 2.89 ± 1.26
Cmax (ng/mL) 16.13 ± 7.18 16.68 ± 7.36
AUC0→t(h.ng/mL) 81.25 ± 34.53 88.73 ± 37.66
Competing interests
The authors declare that they have no competing interests.
Authors’contributions
AS and HJ has performed the experimental and analytical work and prepared the draft of the article. PV and AK designed the experiment, and RT contributed in framing the article. The guidelines and supervision of this work was provided by TM. All authors read and approved the final manuscript.
Acknowledgements
All the authors wish to acknowledge the support and facilities received from Ranbaxy Research Laboratories, Gurgaon, India, for carrying out this work.
Received: 14 January 2015 Accepted: 21 May 2015
References
Daniel M, Mohammed J, Sabine CP (2000) Quantitative determination of pravastatin and its biotransformation products in human serum by turbo ion spray LC/MS/MS. J Pharm Biomed Anal 23:851–866
Dong W, Dongmei W, Feng Q, Lingyun C, Famei L (2008) Determination of lovastatin in human plasma by ultra-performance liquid chromatography/ electrospray ionization tandem mass spectrometry. Biomed Chromatogr 22:511–518
Guideline on bioanalytical method validation (2011) European Medical Agency. http://www.ema.europa.eu/docs/en_GB/document_library/
Scientific_guideline/2011/08/WC500109686.pdf. Accessed 09 March 2014 Guidance for Industry: Bioanalytical Method Validation (2001) US Food and Drug
Administration. http://www.fda.gov/downloads/drugs/guidancecompliance regulatoryinformation/guidances/ucm368107.pdf. Accessed 09 March 2014 Haiyan Y, Feng W, Jiying T, Wenxing P, Huande L (2008) Determination of
lovastatin in human plasma by ultra-performance liquid chromatography– electrospray ionization tandem mass spectrometry and its application in a pharmacokinetic study. J Pharm Biomed Anal 46:808–813
Hsu I, Spinler SA, Johnson NE (1995) Comparative evaluation of the safety and efficacy of HMG-CoA reductase inhibitor monotherapy in the treatment of primary hypercholesterolemia. Ann Pharmacother 29:743–759
Islam UK, Tayyaba K, Muhammad A, Shaazad S (2010) Development and validation of liquid chromatographic method for the simultaneous estimation of ezetimibe and lovastatin in human plasma. J Chil Chem Soc 55:461–464
Jacobsen W, Gabriele K, Katrin H, Laviero M, Michael D, Ingelore H, Benet LZ, Sewing KF, Christians U (1998) Comparison of cytochrome p-450 dependent metabolism and drug interactions of the 3-hydroxy-3-methylglutaryl-coa reductase inhibitors lovastatin and pravastatin in the liver. Drug Metab Dispos 27:173–179
Kearney AS, Crawford LF, Surendra CM, Galen WR (1993) The interconversion kinetics, equilibrium, and solubilities of the lactone and hydroxy acid forms of the HMG-CoA reductase inhibitor, CI-981. Pharm Res 10:1461–1465 Lily YY, Patricia SF, Malcolm JM (2000) Determination of lovastatin in human
plasma using reverse phase high performance liquid chromatography with UV detection. Ther Drug Monit 22:737–741
Lin F, Dai Z, Hou S, Wan Y (2004) Pharmacokinetic study on lovastatin sustained-release tablet and sustained-sustained-release capsule in begal dogs. J Huazhong Univ Sci Technolog 24:116–119
Lin L, Jin S, Yaxin S, Zhonggui H (2008) LC–ESI–MS determination of lovastatin in human plasma. Chromatographia 67:621–625
Morris MJ, Gilbert JD, Hsieh JY, Matuszewski BK, Ramjit HG, Bayne WF (1993) Determination of the HMG-CoA reductase inhibitors simvastatin, lovastatin, and pravastatin in plasma by gas chromatography/chemical ionization mass spectrometry. Biol Mass Spectrom 22:1–8
Mullangi R, Pasha MK, Jafar SB, Syed M, Shashikumar D, Srinivas NR (2006) Analysis of five HMG-CoA reductase inhibitors-atorvastatin, lovastatin, pravastatin, rosuvastatin and simvastatin: pharmacological, pharmacokinetic and analytical overview and development of a new method for use in pharmaceutical formulations analysis andin vitrometabolism studies. Biomed Chromatogr 20:282–293
Nageswararao P, Ramesh M, Jaswanth KI, Indira KN, Seshagirirao JVLN (2012) Simultaneous determination of simvastatin, lovastatin and niacin in human plasma by LC-MS/MS and its application to a human pharmacokinetic study. Biomed Chromatogr 26:476–484
O’Connor P, Feely J, Shepherd J (1990) Lipid lowering drugs. Br Med J 300:667–672
Prescribing Information (2012) Mevacor (lovastatin Tablets). MERCK & CO., INC., USA Whitehouse Station (NJ)
Ramakrishna N, Koteshwara M, Vishwottam K (2007) Chromatography-mass spectrometry methods for the quantitation of statins in biological samples. J Pharm Biomed Anal 44:379–387
Strode JT, Taylor LT, Howard AL, Ip D (1999) Feasibility of lovastatin analysis by packed column supercritical fluid chromatography with ultraviolet detection. J Pharm Biomed Anal 20:137–143
Viswanathan CT, Bansal S, Booth B (2007) Workshop/conference report-quantitative bioanalytical methods validation and implementation: best practices for chromatographic and ligand binding assays. AAPS J 9:E30–E42 Won CM (1994) Epimerization and hydrolysis of dalvastatin, a new
hydroxymethylglutaryl coenzyme (HMG-CoA) reductase inhibitor. Pharm Res 11:165–170
Wu Y, Jamie Z, Jack H, Walter AK, Amelia PL, Lin CC (1997) Microsample determination of lovastatin and its hydroxy acid metabolite in mouse and rat plasma by liquid chromatography/ionspray tandem mass spectrometry. J Mass Spectrom 32:379–387
Xiao H, Shen H, Chen JF, Xaio D (2006) Determination of lovastatin level in human plasma and lovastatin capsules bioavailability in healthy volunteers using HPLC-MS. J Chin Pharm Sci 15:233–237
Xiu SM, Chris DM (2003) Determination of cholesterol-lowering statin drugs in aqueous samples using liquid chromatography–electrospray ionization tandem mass spectrometry. J Chromatogr A 998:133–141
Submit your manuscript to a
journal and benefi t from:
7 Convenient online submission 7 Rigorous peer review
7 Immediate publication on acceptance 7 Open access: articles freely available online 7 High visibility within the fi eld
7 Retaining the copyright to your article