Volume 3, Issue 6, 2016
29 Available online at www.ijiere.com
International Journal of Innovative and Emerging
Research in Engineering
e-ISSN: 2394 – 3343 p-ISSN: 2394 – 5494
Modeling and Control of PV inverter as STATCOM in Grid
connected PV systems
Nandini Pillai
a, Mrs T PhaniSwecha
band Mr Elijah Toppo
caM. Tech Scholar, Department of Electrical Engineering, Pandit Deendayal Petroleum University,Gandhinagar, India b Lecturer, Department of Electrical Engineering, Pandit Deendayal Petroleum University, Gandhinagar, India c Lecturer, Department of Electrical Engineering, Pandit Deendayal Petroleum University, Gandhinagar, India
ABSTRACT:
The increasing popularity of
Grid connected Photovoltaic (PV) systems in the recent years is due to
its application as distributed Generators (DG) and for effectively using PV array power. The major
drawback of solar energy is its intermittent nature. Off grid photovoltaic is only intermittent but grid
connected system ensures that any extra power required is automatically delivered by grid.
This
paper aims at two major tasks: the first is modelling and simulation of 700KW Photovoltaic plant,
the Maximum power point (MPP) control and the DC/DC converter will be analyzed and evaluated.
The Second task is to develop a smart control for three phase voltage source inverter (VSI) which
enables a Photovoltaic Power plant (PV) to operate as a STATCOM in addition to operating as a
source of renewable power generation. Smart control enables the inverter to provide reactive power
compensation and maintain voltage at Point of Common Coupling (PCC) along with its ability to
deliver power to local loads and other utility loads up to the rated capacity of the inverter. A 700KW
two-stage Grid connected Photovoltaic system is simulated by MATLAB/SIMULINK software along
with the proposed control strategy and the results show the feasibility and performance of the control
structure.
Keywords:
Distributed Generators (DG); Photovoltaic (PV); Voltage source inverter (VSI); Point of
Common Coupling (PCC); Maximum Power Point (MPP), Phase locked loop(PLL)
I. INTRODUCTION
Solar photovoltaic is emerging strongly as one the non-conventional renewable energy resources. As solar photovoltaic is capable of generating power during daytime only, during the night hours the power electronics converters used in solar photovoltaic are idle. This available but unused capability of electronic converters can be used to maintain the voltage profile of the distribution grid. Hence facilitating the 24 hour utilization of solar photovoltaic plant.
The IEEE 1457 standard insists that the Distributed Generator should not disturb the voltage profile of distribution grid. As the load in distribution grid is prone to frequent changes hence voltage fluctuation are very high, so in solar photovoltaic plants maintaining voltage profile at PCC point is major issue and to achieve this reactive power management is essential. Many reactive power compensation methods are employed with solar Photovoltaic generation amongst which capacitor compensation and FACTS devices for reactive compensation are very commonly used. But these methods are not cost effective and require regular maintenance [15]. Most of the voltage fluctuations in the power system are because of a shortage or surplus of reactive power. Capacitor banks are widely used in power systems for voltage regulation. However, capacitor banks are switched on or off, and are not a continuously variable real-time source of reactive power. Moreover, the reactive power supplied by capacitor banks decreases as the system voltage decreases (by voltage squared) when reactive power is most needed. Therefore, capacitor banks fail to provide sufficient reactive power when it is most needed during severe voltage excursions.
This paper presents a method to eliminate the usage of other reactive power compensation schemes, by a smart control of solar inverter and maintains voltage profile at PCC. The smart control if inverter is defined as the ability to supply real power to local and other utility load up to the rated capacity of inverter, to provide voltage support at the point of common coupling (PCC).
II. SYSTEMDESCRIPTION
30 tracking maximum power point, here perturb and observe method is used. In this method PV module’s voltage and current both are to be sensed for tracking maximum power point. Then, a pulse width modulation (PWM) based dc-ac voltage source inverter is used for enforcing sinusoidal voltage waveform with matching phase and frequency with grid voltage. The output voltage wave shape of PWM inverter is square wave; hence an LCL filter is used for coupling the inverter to the grid. It is one kind of low pass filter that converts PWM square wave to pure sine wave .Finally a control mechanism is incorporated in the inverter in order to supply the desired amount of real and reactive power to the grid from the PV system.
Figure 1: Block diagram of the plant
Iph Id Rsh
Rs
Rload
Figure 2: Equivalent Circuit of PV
A. PV MODELLING
The equivalent circuit of PV cell is as shown in fig.2. The current source Iph represents the cell photocurrent. Rsh and Rs are the intrinsic shunt and series resistances of the cell, respectively. Usually the value of Rsh is very large and that of Rs is very small, they may be neglected to simplify the analysis. PV cells are grouped in larger units called PV modules which are further interconnected in a parallel-series configuration to form PV arrays [1]. The Solar Photovoltaic system simulated in the present paper uses the following equations [1]
Module Photovoltaic current is calculated by
𝐼𝑝ℎ= [𝐼𝑠𝑐+ 𝐾𝑖(𝑇 − 298)] ∗ 𝜆/100 (1) Reverse saturation current is calculated as
𝐼𝑟𝑠= 𝐼𝑠𝑐
exp(𝑞𝑉𝑜𝑐
𝑁𝑠𝑘𝐴𝑇)
− 1 (2)
Module saturation current is given by
𝐼0= 𝐼𝑟𝑠[ 𝑇 𝑇𝑟]
3
exp [𝑞∗𝐸𝑔𝑜
𝐵𝑘 ∗ (
1 𝑇𝑟−
1 𝑇)](3) PV module output current is calculated by, 𝐼𝑝𝑣= 𝑁𝑝∗ 𝐼𝑝ℎ− 𝑁𝑝∗ 𝐼0[exp [𝑞 ∗
𝑉𝑝𝑣+𝐼𝑝𝑣∗𝑅𝑠
𝑁𝑠𝑘𝐴𝑇 ] − 1 (4)
Where Vpv is equal to Voc
Table 1: Technical Details Short Circuit Current Isc 8.82 A
Open circuit Voltage Voc 45.5V
Voltage at MPP Vmpp 36.8V
Current at MPP Impp 8.32A
Volume 3, Issue 6, 2016
31 Charge of electron q 1.6*10-19
Energy band Gap Eg 1.1 ev Irradiance 𝛌 1000 W/m2
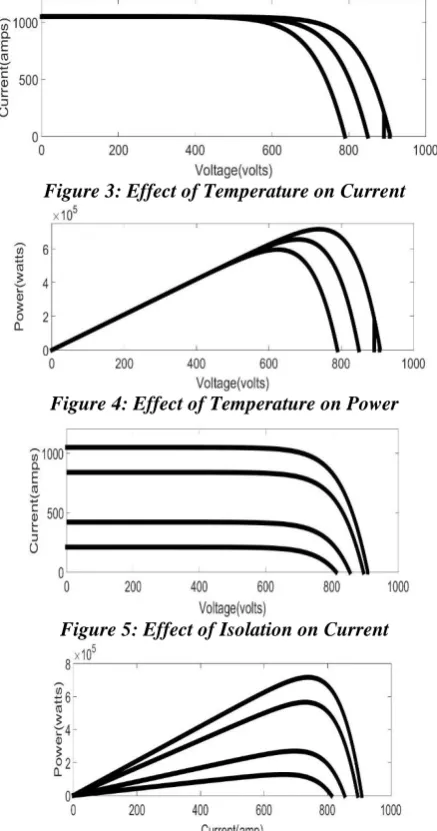
Like all other semiconductor devices, solar cells are sensitive to temperature. An increase in temperature reduces the band gap of a semiconductor, thereby effecting most of the semiconductor material parameters. The decrease in the band gap of a semiconductor with increasing temperature can be viewed as increasing the energy of the electrons in the material. Lower energy is therefore needed to break the bond. In the bond model of a semiconductor band gap, reduction in the bond energy also reduces the band gap. Therefore increasing the temperature reduces the band gap. In a solar cell, the parameter most affected by an increase in temperature is the open-circuit voltage. The impact of increasing temperature on the PV module characteristics is shown in the figures 3 and 4 below.
Changing the light intensity incident on a solar cell changes all solar cell parameters, including the short-circuit current, the open-circuit voltage, the efficiency and the impact of series and shunt resistances. The light intensity on a solar cell is called the number of suns, where 1 sun corresponds to standard illumination 1 kW/m2. For example a system with 2 kW/m2 incident on the solar cell would be operating at 2 suns, or at 2X.The figures 5 and 6 shows the effect of isolation on IV and PV curves of solar photovoltaic module
Figure 3: Effect of Temperature on Current
Figure 4: Effect of Temperature on Power
Figure 5: Effect of Isolation on Current
Figure 6: Effect of Isolation on Power B. DC-DC CONVERTER
The voltage output of solar photovoltaic is dependent on atmospheric conditions and the irradiance available, so DC- DC converter is used to maintain the constant voltage input to the inverter irrespective of the change of solar photovoltaicvoltage output. The DC- DC converter shown in this paper is a boost converter, also termed as step up DC-DC converter.The modeling of the presented converter uses following equations [16]
32 𝑉𝑜=
𝑉𝑠
1−𝐷 (5)
Where Vo is the output voltage required, Vs is the input voltage, D is duty cycle.Now maximum and minimum inductor current can be obtained from
𝐼𝐿𝑚𝑎𝑥= 𝐼𝐿+∆𝐼𝐿
2 (6) And
𝐼𝐿𝑚𝑖𝑛= 𝐼𝐿− ∆𝐼𝐿
2 (7) Where ∆𝐼𝐿= (0.2 𝑡𝑜 0.4) ∗ 𝐼𝑜∗𝑉𝑜
𝑉𝑠
The value of inductor is given by 𝐿 = 𝑉𝑠𝐷
∆𝐼𝐿𝑓(8)
where L is the inductor value, D is the duty cycle, f is switching frequency. The value of capacitor is obtained from
𝐶 = 𝐷/(𝑅 (∆𝑉𝑜 𝑉𝑜
) 𝑓 (9)
Where ∆ Vo is output voltage ripple.
C. MAXIMUM POWER POINT TRACKING
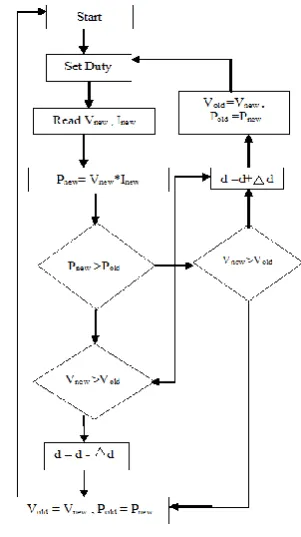
The operating point of solar photovoltaic panel is decided by the load to which it is connected. As the solar irradiance falling on the solar photovoltaic module varies throughout the day, the operating point of the solar photovoltaic module is bound to change. In order to ensure the operation of PV modules for maximum power transfer, a special method called Maximum Power Point Tracking (MPPT) is employed in PV systems. The maximum power tracking mechanism makes use of the algorithm and an electronic circuitry. The mechanism is based on the principle of impedance matching between load and PV module, which is necessary for maximum power transfer. This impedance matching is done by using a DC-DC converter.
Figure 7 : Flow Chart of Perturb And Observe
Due to the simplicity in implementation, the MPPT algorithm used in this paper is Perturb and Observe. As shown in figure 7, in this method the duty cycle D is perturbed at regular intervals and power from PV module is measured at that instants. If the change in d is effecting the direction so that operating point of approaches MPP on power -voltage characteristic is looked up.
D. INVERTER
Volume 3, Issue 6, 2016
33 E. LCL FILTER
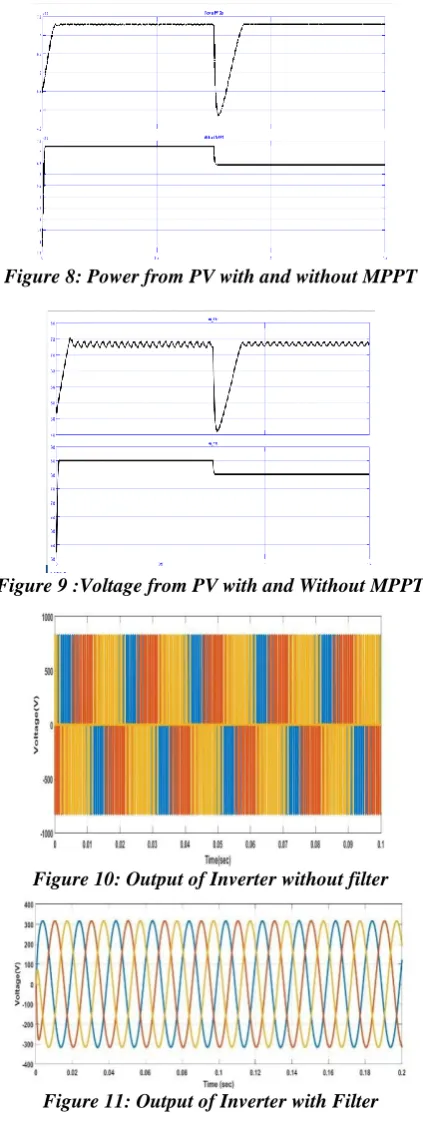
The output of voltage source inverter is a square wave which is shown in figure 10. So in order to modify it into sinusoidal type a low pass filter of LCL type is modelled. The figure 11 shows pure sinusoidal output, which validates the filter design.
Figure 8: Power from PV with and without MPPT
Figure 9 :Voltage from PV with and Without MPPT
Figure 10: Output of Inverter without filter
34 Figure 12 Block of Control Strategy
II. CONTROL STRATEGY
The three phase current from the inverter which has to be injected to the grid is transformed from abc to dq0. As real and reactive power can be controlled individually by controlling the Id and Iq components of the inverter currents as well as PI control becomes easier in dq0 stationary reference frame as they can be treated equivalent as DC qualities.
𝑃 =2
3(𝑉𝑑∗ 𝐼𝑑) (9)
𝑄 = −2
3(𝑉𝑑∗ 𝐼𝑞 (10)
where Id and Iq are dq0 currents of the inverter and Vd and Vq are dq0 converted voltages from the grid. The grid angle is measured from the grid side using Synchronous Reference Frame- Phase Locked Loop (SRF- PLL).
As shown in figure 12 there are two PI controllers; one to control DC voltage, and, other to regulate voltage at PCC. The PCC point voltage fluctuation is maintained by providing required leading or lagging reactive power during the increase or decrease of voltage [16]
IV.SIMULATIONRESULTSANDDISCUSSION
The proposed control strategy is implemented in a simulation model and the results obtained are analysed as below. The solar photovoltaic is capable to feeding active power during day and compensate for in house reactive power both during day and night. Table 1shows the active and reactive power fed into the grid both during day and night time (negative sign indicates taken from the grid)
Table 2 :Active and Reactive Power fed into Grid during day and Night time DURING
DAY TIME
Active Power
Reactive Power 702.3*103 552*103
DURING NIGHT TIME
-80.8*103 134*103
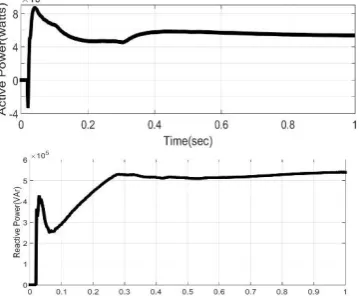
Figure 13 shows the active and reactive power exported to the grid during day time with the new control scheme. It can be seen that that the active power is almost same as the DC power (neglecting the losses) but now reactive power is also supplied to grid. Now the reactive power is compensated for the load from the solar inverter itself.
The figure 14 and figure 15 shows the active and reactive power required during the night time. It can be observed that the active power taken from the grid for the functioning of PV inverter is around 80KW but even during night time the reactive power required for the plant is supplied from the PV inverter with the help of coupling capacitor.
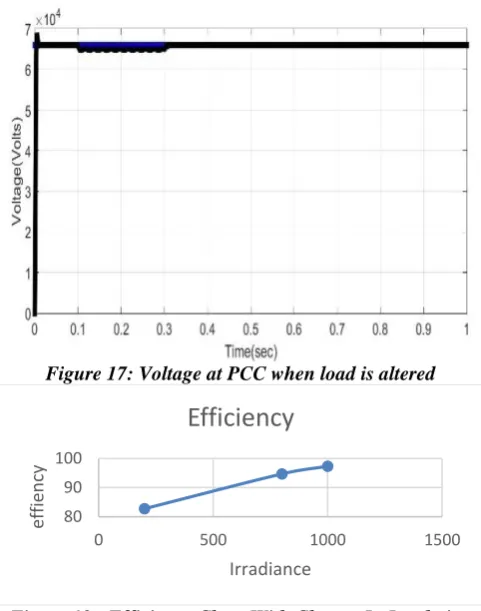
During night when Solar Photovoltaic is not generating, due to change in grid load the voltage at PCC can be hampered, the proposed control strategy helps in maintaining PCC voltage even during night hours, which is presented with the help of figure 16.
Volume 3, Issue 6, 2016
35 It has been observed that as the insolation of PV panels are decreased the efficiency decreases. As the input power from PV panels decreases, the loss in power electronics devices increase, hence causing a reduction in efficiency. The insulation versus efficiency graph is presented in figure 18.
Figure 13 : Active and Reactive Power fed into the Grid during Day time
Time (sec)
Time (sec)
Figure 14 :Active and Reactive Power drawn from the Grid during Night time
Figure 15: Reactive compensated for Load during Night by PV inverter
36 Figure 17: Voltage at PCC when load is altered
Figure 18 : Efficiency Chart With Change In Insolation
V.CONCLUSIONS
In this paper a three-phase grid-connected DC/AC inverter is developed with an advanced control that allows active and reactive power (VAR) control. Hence, through this paper it can be concluded that by using the improved control strategy as suggested can eliminate the use of any other reactive compensation, helps decreasing the cost of overall solar photovoltaic plant and also helps in maintaining the distribution grid voltage profile by stabilizing the voltage of point of common coupling (PCC) throughout day and night, thereby facilitating 24 hour utilization of solar photovoltaic plants.
REFERENCES
[1] Pandiarajan, N. and Muthu, R., 2011, January. Mathematical modeling of photovoltaic module with Simulink. In International Conference on Electrical Energy Systems (ICEES 2011) (Vol. 6)
[2] Rahman, S.A. and Varma, R., 2011, August. PSCAD/EMTDC model of a 3-phase grid connected photovoltaic solar system. In North American Power Symposium (NAPS), 2011 (pp. 1-7). IEEE.
[3] Verma, A.K., Singh, B. and Shahani, D.T., 2012, September. Grid interfaced solar photovoltaic power generating system with power quality improvement at AC mains. In Sustainable Energy Technologies (ICSET), 2012 IEEE Third International Conference on (pp. 177-182). IEEE.
[4] Li, B., Tian, X. and Zeng, H., 2011, July. A grid-connection control scheme of PV system with fluctuant reactive load. In Electric Utility Deregulation and Restructuring and Power Technologies (DRPT), 2011 4th International Conference on (pp. 786-790). IEEE.
[5] Agarwal, P. and Gupta, R., 2013, April. Grid integration of solar PV power using shunt connected VSC. In Engineering and Systems (SCES), 2013 Students Conference on (pp. 1-6). IEEE.
[6] Li, P., Tang, J., Zhang, L. and Lian, C., 2008, October. Independent control of active and reactive power of the grid-connected inverter. In Electrical Machines and Systems, 2008. ICEMS 2008. International Conference on (pp. 2493-2496). IEEE.
[7] Varma, R.K., Das, B., Axente, I. and Vanderheide, T., 2011, July. Optimal 24-hr utilization of a PV solar system as STATCOM (PV-STATCOM) in a distribution network. In Power and Energy Society General Meeting, 2011 IEEE (pp. 1-8). IEEE.
[8] Varma, R.K., Khadkikar, V. and Seethapathy, R., 2009. Nighttime application of PV solar farm as STATCOM to regulate grid voltage. Energy Conversion, IEEE Transactions on, 24(4), pp.983-985.
[9] Varma, R.K., Rahman, S.A. and Vanderheide, T., 2015. New control of PV solar farm as STATCOM (PV-STATCOM) for increasing grid power transmission limits during night and day. Power Delivery, IEEE Transactions on, 30(2), pp.755-763.
80 90 100
0 500 1000 1500
ef
fie
n
cy
Volume 3, Issue 6, 2016
37
[10] Varma, R., Siavashi, E.M., Das, B. and Sharma, V., 2012, October. Real-time digital simulation of a PV solar system as STATCOM (PV-STATCOM) for voltage regulation and power factor correction. In Electrical Power and Energy Conference (EPEC), 2012 IEEE (pp. 157-163). IEEE.
[11] Varma, R., Rangarajan, S.S., Axente, L. and Sharma, V., 2011, March. Novel application of a PV solar plant as STATCOM during night and day in a distribution utility network. In Power a Systems Conference and Exposition (PSCE), 2011 IEEE/PES (pp. 1-8). IEEE.
[12] Varma, R., Siavashi, E.M., Das, B. and Sharma, V., 2012, October. Real-time digital simulation of a PV solar system as STATCOM (PV-STATCOM) for voltage regulation and power factor correction. Part 2 InElectrical Power and Energy Conference (EPEC), 2012 IEEE (pp. 157-163). IEEE.
[13] K. Turitsyn, P. Sulc, S. Backhaus, and M. Chertkov, “Options for Control of Reactive Power by Distributed
Photovoltaic Generators,” Proceedings of the IEEE, vol. 99, pp. 1063–1073, june 2011.
[14] J. W. Smith, W. Sunderman, R. Dugan, and B. Seal, “Smart inverter volt/var control functions for high penetration of PV on distribution systems,” in 2011 IEEE/PES Power Systems Conference and Exposition, pp. 1–6, IEEE, mar 2011.
[15] Tharani, K. and Dahiya, R., 2014, November. PV module integration with STATCOM for reactive power compensation. In Computational Intelligence on Power, Energy and Controls with their impact on Humanity (CIPECH), 2014 Innovative Applications of (pp. 400-404). IEEE
[16] Hart D (Year 2011) , Power Electronics, Pg 211 to 216
[17] Mathur M R , Verma R, Thyristor Based Facts Control for Electrical Transmission System Pg 413 to 419
[18] Mohan N,3rd edition , Power Electronics Converters, Applications, and Design ,Pg 200 to 230