INTRODUCTION
Horizontal stability of streams and rivers is
one of the most obvious effects of ever-changing morphology of mountain valleys. It can be benefi-cial for the entire ecosystem (Bravard et al., 1999, May et al., 2009,), or it can be harmful, especially for human development. For centuries, the human tried to rein-in the river corridor migration; how-ever, sometimes their efforts backfired spectacu-larly (Lisle, 2005, Nelson et al., 2009).
In this paper, assessment and prediction of the movement of selected sections of the Raba river in Southern Poland was attempted, using existing, historical sources, to the most practicable extent, with regard to the structures as groyneses and re-vetments stability.
This paper uses multi-disciplinary tools to assess the river channel changes. Therefore, the
first step was to obtain the information, in the form of old maps (almost non-existent) and/or aerial photographs of the selected areas. This was somewhat successful, as about 200 aerial photographs were collected, albeit in various states of preparation. Some were scanned sim-ply from the raw photographic slides, with al-most no correction, some of them were some-what better prepared ortophoto representations of the quality similar to widely used ortophoto maps (Carbonneau et al., 2004, Legleiter 2013). Secondly, the archival projects of technical Raba river channel training works were col-lected and thoroughly analysed. It was done in order to assess the influence on the chan-nel evolution and the groynes stability, taking into account the variability of the hydrologic regime of the analyzed area. (Mosley 1982, Stevens et al., 1975).
Accepted: 2019.09.17 Available online: 2019.09.21 Volume 20, Issue 9, October 2019, pages 145–155
https://doi.org/10.12911/22998993/112496
Technical Assessment of River Training Impact on the Raba
River Bed Stability on the Selected Longitudinal Section
Marta Łapuszek
1*, Andrzej Wolak
11 Institute of Water Engineering and Water Management, Cracow University of Technology, ul. Warszawska 24, 31-155 Kraków, Poland
* Corresponding author's e-mail: [email protected]
ABSTRACT
Short assessment and prediction of movement of selected Raba river sections in Southern Poland, using the ex-isting, historical sources is presented in this paper. It was done to the most practicable extent, with regard to the river training structures as groynes and revetments stability structures. The old maps (almost non-existent) and/or aerial photographs of the selected areas and the archival projects of technical Raba river channel regulation were complemented with specific stream power and bed shear stress. In the 8.2 km long study area, four specific sections were studied in the current paper. The general trends over the last fifty years included artificial narrowing of the active channel width with uniform riverbed longitudinal slope. The current studies lead to the conclusion that the narrowed river channel tend to restoring its previous state. However, throughout each analyzed section, the chan-nel-forming processes are varied, mostly related to restoring the local natural longitudinal slope. In Section-1, the process of sediment deposition was observed and it continues till now. In Section-2, the channel-forming processes were carried out with high intensity with tendency to rebuild its previous braided course. Currently, this tendency is continuing. The third Section seems to be the most stable after the river training works. In Section-4 the process of high erosion, especially of the left bank, is observed. The results of the analysis lead to the conclusion that more comprehensive investigation is needed of the whole 8.2-km long reach to assess the river state.
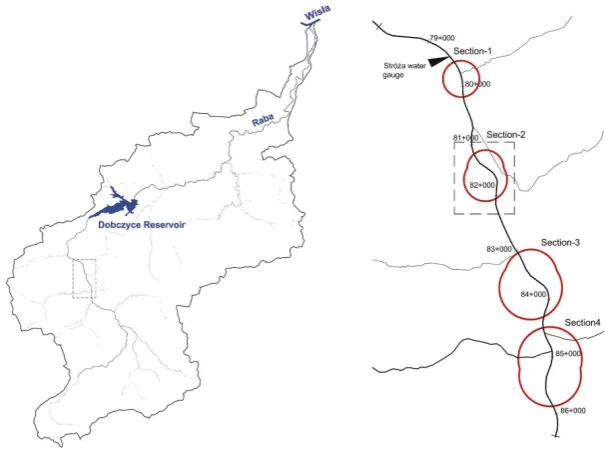
THE STUDY AREA
Raba River, in southern Poland, is a mountain tributary of Vistula River, which drains 1537 km2 catchment (according to Institute of Meteorol-ogy and Water Management). The topography of drainage catchment is highly varied in this region. Raba River is characterized by high erosion and deposition processes, which occur with varied in-tensity along the river course. The experimental reach (the study area) is located from 86.376 km to 78.142 km of Raba River (counting from its mouth). The river is quite braided, with free bars. The width of the active channel can rise up to 180 m in some parts of the studied river course. Dur-ing the 20th century, the river in the studied reach
was repeatedly straightened and narrowed. In 1967, the most complex river training was carried out. The main river channel was designed as a trapezoid of 30 m width with both-side limitation of made of groynes and revetments. This engi-neering activity was the most important factor of high riverbed evolution. The newly formed nar-row river channel did not survive long, the most of the structures as groynes and revetments were destroyed. Hence, subsequent regulations were carried out for the next decades with the river channel was formed as 50 m width.
The concern of the paper is the horizontal and vertical stability assessment in four selected sec-tions of the studied area where the changes of riv-er channel are the most visible: Section-1 – km:
79.510 – 80.196; Section-2 – km: 81.144 – 81.908;
Section-3 – km: 83.056 – 84.308; Section-4 –
km: 84.491 – 85.872 (Fig. 1).
MATERIALS AND METHODS
Since 1963, aerial photographs have been taken periodically by the Main Office of Geod-esy and Cartography (in Polish: GUGIK) for the Raba river catchment. In the current research, the aerial photographs of: 1963, 1980, 1997, 2003, 2009, 2012, 2015 have been used (50 separate photos). It is important that these photographs were made during the low flow conditions, with clear opportunity to assess the variability of the location of the riverbed in the plan (Table 1). It was then possible to obtain much better resolu-tion using the historical aerial photos obtained from GUGiK, than using the freely available ones (Google for example).
The details of technical training projects car-ried out on selected sections of the Raba river were obtained from Wody Polskie (RZGW Kraków), for the years: 1967, 1973, 1975, 1982, 1987. On the basis of the archival projects, it was possible to analyze the vertical and horizontal changes of the river channel.
It was then possible to assess the variability of the active channel width (treated as a width not covered by vegetation) using those aerial photo-graphs and the maps and cross-sections of the ar-chival technical projects. The raster resolutions of the aerial photographs used to the current studies
are relatively good. However, the effects of some image deformations cannot be completely recti-fied, especially of the areas located at the consid-erable distance from the central part of photogra-phy. The problem concerns especially the maps of 1963, 1980. Moreover, river bank digitization is a great challenge in the areas covered with dense vegetation.
The width of the channel estimated from the technical projects (Raba river training projects: 1967, 1973, 1976, 1982, 1987) is characterized by an error of 7–10%. This is due to the difficul-ties in line estimation between the bottom and the riparian zone: in some cases, the outlines of the channel bottom pointed out on the plan do not correspond to the cross-section. The current state of channel active width was possible to estimate based on the field observation. There were some areas where the extent of sediment cover was made under the assumption that the active width is the area over which bed material is mobile at any particular time and morphological change can be observed (Ashmore, 2001; Bertoldi et al., 2009b, Lane et al., 1994;).
The river bottom vertical variability was de-termined by comparing the lowest cross-sectional ordinates pointed out in the technical projects.
In order to examine the hydrodynamic condi-tion of the river channel in the years 1967–2015, the daily discharges registered in Stróża gauging station (80.6 km of the Raba river) were analyzed. In the particular time intervals, the sequences of channel-forming flows were determined on the basis of the MPM formula (1948), where the left side stands for the shear stress and the right side for the stream power:
3 2 3 1 2 3 ' s , s r s s q g 25 , 0 d 047 , 0 hJ k k Q Q (1)
where: qs – sediment flow [N·s
-1m-1];
ks, kr – velocity coefficient in Manning
Strickler formulae [-];
h – water depth; d – sediment diameter;
J – slope of the energy line [-],
Q – water discharge [m3/s],
Qs – water discharge due to beginning of
sediment movement [m3/s], g
r – specific
weight of sediment, gr=2650 [kg/m
3],
g – acceleration due to gravity [m/s2]. Specific stream power ω, was determined with the following relationship: (Bagnold, 1966, Parker et al., 2011):
W gQS/
(2)
where: Q (m3·s-1) – bankfull discharge ,
S – energy slope
W – channel width [m].
RESULTS AND PROGNOSIS
Spatially, the study area was divided into four particular sections: numbered from 1 to 4. The proposed allocation results in the “belt” ad-opted as 92% of river migration in plan observed throughout the whole studied section.
Considering time intervals, the research area was divided into:
• four time intervals: 1963–1980, 1980–2012, 2012–2015, 2015–2017, related to the avail-ability of photogrammetric materials;
• periods related to the river training ac-tivities in the following areas: 1967–1976, 1967–1976–1987, 1967–1982, 1967 until now, respectively.
Vertical stability analysis
The changes were determined on the basis on the technical projects executed on the studied Raba river sections (Raba river training projects). Taking into account the field measurements made, due to projects preparation in 1967 and 1976, the vertical variability of river channel in Section-1
was assessed. In 1967, before the project execu-tion, the sediment accumulation processes (in the Table 1. Discharges that occurred while taking aerial photographs on the Raba river, whereas the characteristic discharges at Stróża gauging station (the catchment area: 644 km2) are as follows: Q
mean annual=9.24 m
3/s,
Q min.=0.70 m3/s, Q
50%=164 m3/s, Q10%=521 m3/s, Q5%=676 m3/s, Q1%=1040 m3/s (according to Institute of
Meteorology and Water Management)
The date 18.09. 1963 22.09. 1963 6.05. 1980 15.05. 1980 16.05. 1980 15.09. 1997 15.04. 2003 16.04. 2009 18.07. 2009 10.08. 2009 29.07. 2012 13.06. 2015 Flow in river [m3·s-1]
upper part) and the local bottom lowering (1.0 m) close to km 79.800 were observed. As a result of the technical river training in 1967, the Raba riv-erbed reach in bars and landforms was narrowed to 30.0 m and the longitudinal slope of the bot-tom was standardized to 0.004 (elevation divided by distance). In 1976, another technical training works on this section were executed with the same slope designed as in 1967 and the channel width of 50 m.
As shown by the measurements of the chan-nel on this section, in 1967, after training works until 1976 there were very intensive bottom ag-gradations, on average for about 1.0 m (Table 2). In Tables (Tables: 2–5) the vertical stability anal-ysis in four sections was presented. It includes the initial bottom level and the active channel width before the first river training and the in-crease or dein-crease of these values in the studied time intervals connected with the periods of the
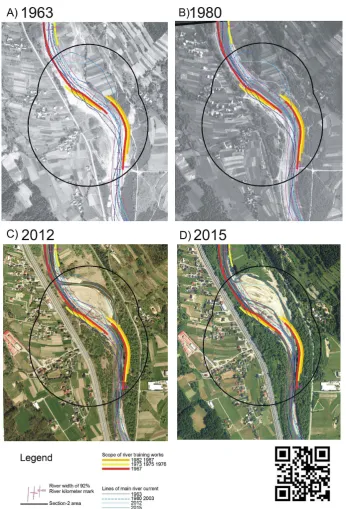
Figure 2.Section-2 (km: 81.144 – 81.908): Raba river channel evolution in years: a) 1963, b) 1980, c) 2012, d) 2015 observed on the aerial photography with pointed out training works during
river training works. Due to the multiplicity of analyzed cross-sections in a given section (one of the four), the tables present the results only for selected cross-sections.
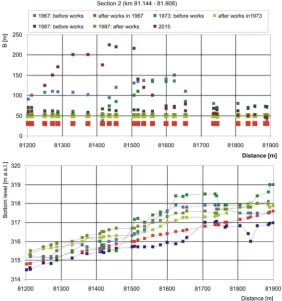
In Section-2 trained technical channel in
1967 tends to have the bottom aggradations with the observed sediment layer of thickness between 1.0–1.8 m (Table 3, Fig. 3).
After river training carried out in 1973 (the channel width: B=50 m, slope: J=0.004) ero-sion and accumulation of sediment with inten-sity ranged from – 0.6 m (erosion) to + 0.4 m (deposition) was observed till the year 1987 (Table 3. Fig. 3).
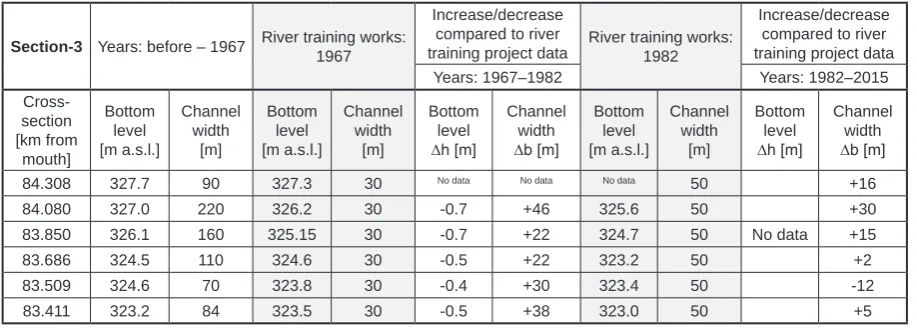
In Section-3 after the technical works of
1967, the vertical shape of the channel was clear-ly transformed. While comparing the bottom lev-el to the bottom measured in 1982, the process of riverbed erosion was observed along the whole
Section-3 (Table 4).
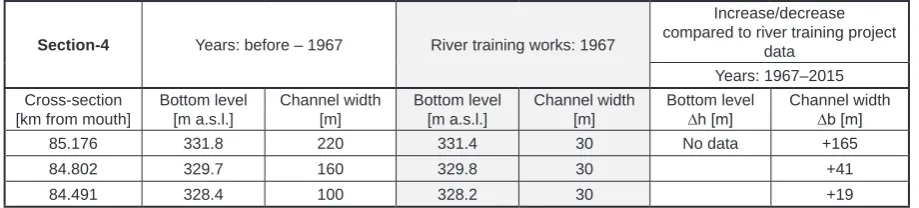
Currently, in Section-4 there are no geometry
data of cross-sections of any period of time ex-cept of 1967 year. Therefore, the vertical variabil-ity can not be assessed at present. This will only be possible after field measurements (Table 5).
Horizontal analysis and prognosis
The morphological active width can be de-fined as the lateral extend of bed material dis-placement in time (Peirce et al., 2018). However, the bedload transport in gravel-bed rivers has
substantial variability and is often limited to the
threads of transport that are often narrower than the riverbed itself (Gomez 1991). The recent studies showed that in a few wetted channels of a braided river, in one or two channels only the bedload transport occurs (Bertoldi et al., 2009, Egozi et al., 2009). Defining and measuring chan-nel active width is extensively presented in the literature (Brasington et al., 2000, 2003, Gomez 1991, Ferguson et al., 1992, Lane et al., 1994, Rumsby et al., 2008). In the current study, chan-nel active width is assessed as the area between the boundary lines of riparian vegetation on both banks of the river, including bars not covered with vegetation and the area over which bed material is mobile. The active width variability analysis in four selected sections of the Raba river was pos-sible since 1963, when the area was first covered by aerial photography.
In the years 1963–67, according to the aerial photography and technical project, the active channel width of Section-1 was estimated to
be very varied, and it ranged on average from 60 to 110 m (Table 2), with the average longi-tudinal slope: 0.008–0.004 and for discharge Qmin annual : ω=14.5–28 W/m2 and τ=12–14 N/m2.
In the years of 1963–1967, the channel-forming discharge was calculated as Q67% =102 m3/s., to-gether and with higher values it lasted only for 5 days. In this time period, the maximum ob-served flow was Qmax = 257 m3/s. Hence, the channel was shaped by the hydrological and hydraulic conditions only.
Table 2. Raba river channel changes in the years 1967–2015 in Section-1
Section-1 Years: before – 1967 River training works: 1967
Increase/decrease compared to river training project data
River training works: 1976
Increase/decrease compared to river training project data Years: 1967–1976 Years: 1976–2015 Cross-section [km from mouth] Bottom level [m a.s.l.] Channel width [m] Bottom level [m a.s.l.] Channel width [m] Bottom level ∆h [m] Channel width ∆b [m] Bottom level [m a.s.l.] Channel width [m] Bottom level ∆h [m] Channel width ∆b [m]
80.196 311.7 60 310.8 30 +0.8 +42 311.9 50 +5
80.049 311.6 110 310.3 30 +1.0 +48 311.4 50 +3
79.834 316.2 70 309.4 30 +1.2 +39 310.7 50 No data +50
79.790 308.3 60 309.3 30 +1.1 +44 310.5 50 +80
79.696 309.0 82 308.7 30 +1.1 +46 310.3 50 +11
79.510 308.0 96 308.1 30 +0.6 +50 309.3 50 +0
Table 3. Raba river channel changes in the years 1967–2015 in Section-2
Section-2 Years:
before – 1967
River training works: 1967
Increase/decrease compared to river training project data
River training works: 1973
Increase/decrease compared to river training project data
Years: 1967–1973 Years: 1973–1987 1987–2015
Cross-section [km from mouth] Bottom level [m a.s.l.] Channel width [m] Bottom level [m a.s.l.] Channel width [m] Bottom level ∆h [m] Channel width ∆b [m] Bottom level [m a.s.l.] Channel width [m] Bottom level ∆h [m] Channel width ∆b [m] Bottom level ∆h [m] Channel width ∆b [m]
81.855 316.8 49 317.3 30 +1.1 +44 317.9 50 -0.4 +12 +2
81.806 316.8 47 317.1 30 +0.7 +50 317.8 50 -0.3 +12 +1
81.656 316.2 110 316.6 30 +1.8 +54 317.2 50 +0.6 +12 No data +39
81.508 315.7 90 316.0 30 +1.4 +70 316.3 50 +0.0 +14 +166
81.436 315.5 94 315.7 30 0 +44 316.3 50 -0.2 +14 +175
81.272 314.8 110 315.1 30 0 +32 315.6 50 -0.4 +10 +99
Table 4. Raba river channel changes in the years 1967–2015 in Section-3
Section-3 Years: before – 1967 River training works: 1967
Increase/decrease compared to river training project data
River training works: 1982
Increase/decrease compared to river training project data Years: 1967–1982 Years: 1982–2015 Cross-section [km from mouth] Bottom level [m a.s.l.] Channel width [m] Bottom level [m a.s.l.] Channel width [m] Bottom level ∆h [m] Channel width ∆b [m] Bottom level [m a.s.l.] Channel width [m] Bottom level ∆h [m] Channel width ∆b [m]
84.308 327.7 90 327.3 30 No data No data No data 50 +16
84.080 327.0 220 326.2 30 -0.7 +46 325.6 50 +30
83.850 326.1 160 325.15 30 -0.7 +22 324.7 50 No data +15
83.686 324.5 110 324.6 30 -0.5 +22 323.2 50 +2
83.509 324.6 70 323.8 30 -0.4 +30 323.4 50 -12
In 1967, due the technical river training the braided channel with bars was narrowed to 30.0 m with slope of 0.004. The newly formed channel was shaped on both sides by a system of groynes (Project 1967). Thus, the active width was artifi-cially narrowed up to 50%, and locally even up to more than 80%. Under the new conditions, af-ter the works, the hydraulic parameaf-ters were as follows: for discharge Qmin annual : ω=12 W/m2, and for discharge initiating the sediment movement Q=58 m3/s: ω=32 W/m2 and τ=38 N/m2.
In the following years 1967–1976: the channel-forming discharge was calculated as Q67% =58 m3/s and with higher values, it lasted for 38 days. The maximum observed flow was Qmax=475 m3/s this time period. The field mea-surements showed that 9 years later the active width was restored by the river itself to the pre-1967 training works (Table 2).
In 1976, the technical training in Section-1
was made, shaping the channel with 50.0 m of width (Project 1967). The channel-forming dis-charge for new conditions was calculated as Q=74 m3/s, and the hydraulic conditions were as follows: ω=38 W/m2 and τ=33 N/m2. In the years 1976–1980, the above-mentioned hydraulic pa-rameters did not change.
In the next years, the evaluation of the river channel in the horizontal system analysis was pos-sible on the basis of aerial photographs. An aerial photo taken in 1980 indicates that the riverbed in the plan was stable, slight right bank erosion and slight bars deposition were initiated. In the years 1980–2012, the channel-forming discharge Qch-form.=74 m3/s with higher lasted for 124 days and the maximum observed was: Qmax=385 m3/s. In 2012, the aerial photo indicates a rapid deepen-ing of the right bank erosion just behind the groy-ens constructed in 1967. The left bank was eroded as well. Meantime, the bars changed into a large island in the middle. In years: 2012–2015: the channel-forming discharge Qch-form.=76 m3/s with
higher lasted for 124 days ad the maximum ob-served was: Qmax=361 m3/s. In 2015, the process of erosion is continuing on the right bank.
The current active width assessment shows the process which formed the new active channel with width of 120–130 m, as it was before the first technical training works. The space for the active channel was created by the river itself (Table 2).
Prognosis: According to vertical stability
analysis, the riverbed tends to accumulate
sedi-ment in the studied Section-1. The continuing
process of sediment deposition in the river chan-nel will cause the longitudinal slope and decreas-ing of unit stream power. The balance of sediment movement will be disturbed in favor of intensive deposition. Despite the right bank protection, ero-sion will continue and the local Pcim-Stróża road and the buildings of Wierciakowo Village will be threatened. The exact determination of these pro-cessess requires further model calculations.
In the years 1963–67, according to the aer-ial photography and technical project, the ac-tive width of Section-2 was estimated. Before
river training, the width of the active channel was varied and ranged from 50 m to 140 m, it was braided with many bars. Up to a year 1967, the hydraulic parameters of the channel for dis-charge Qmin annual were as follows: ω= 12–22 W/m2, τ=10 – 15 N/m2. The channel-forming discharge was estimated as Q67% =102 m3/s and it lasted with higher for 5 days only. The maximum ob-served discharge was Qmax=257 m3/s. In 1967, due the technical training, the new narrow, prismatic channel was formed with the same parameters as in the case of Section-1. In the years 1967–1973
after river training channel-forming discharge was estimated as Qch-form.=58 m3/s and it lasted with higher for 26 days and the maximum ob-served discharge was Qmax=475 m3/s. In 1973, the field measurements showed that throughout the
Section-2 the river has not restored the former
active channel itself. However, the channel was Table 5. Raba river channel changes in the years 1967–2015 in Section-4
Section-4 Years: before – 1967 River training works: 1967
Increase/decrease compared to river training project
data Years: 1967–2015 Cross-section
[km from mouth]
Bottom level [m a.s.l.]
Channel width [m]
Bottom level [m a.s.l.]
Channel width [m]
Bottom level
∆h [m] Channel width∆b [m]
85.176 331.8 220 331.4 30 No data +165
84.802 329.7 160 329.8 30 +41
widened for about 10–14 m (Table 3). It means that despite the training works the river channel aims at restoring its former course. The groyne-ses and revetments could not manage to maintain a 30-meter wide channel. In 1973, the technical training in Section-2 was made again, shaping the
width of the channel with 50.0 m with groyne-ses and revetments limiting the lateral channel movement (Project 1973). For new condition Qch-form.=72 m3/s the parameters of the channel were: ω=38 W/m2, τ=34 N/m2. The maximum ob-served discharge was Qmax=475 m3/s.
The aerial photo taken in 1980 shows that the channel was not stable, the left bank was eroded. After left bank protecion, the process of right bank erosion was initiated. In 1987, the training works
in Section-2 were carried out again shaping the
width of the channel with 50.0 m with groyne-ses and revetments limiting the lateral channel movement (Project 1987). The measurement of the channel width after 14 years showed that the river partially returned to its active channel width as it was before the works (Fig.3, Table 3). In the years 1980–1987 the channel-forming discharge was Qch-form.= 72 m3/s and it lasted with higher for 47 days, and the maximum observed discharge was Qmax= 385 m3/s.
Currently, in Section-2, after almost 30 years,
where the first training works have been done, the active channel with bars and bedforms was 100–140 m wide (Fig.2, 3), the channel has then rebuilt its previous state creating new bedforms. In the years 1987–2012, channel-forming dis-charge was Qch-form.=72 m3/s and it lasted with higher for 152 days.
On the basis of the aerial photo taken in 2012, the extreme erosion process of the right bank was noticed. A newly-formed wide river channel ap-peared there as well. The river was divided into two different courses, with the appearance of a large island (about 4 ha) between the two. Left bank erosion seems to have been effectively stopped. In the years, 2012–2015 channel-form-ing discharge was Qch-form.=76 m3/s, and lasted with higher flows for 6 days only. The maximum observed discharge was Qmax=361 m3/s. It is well seen in the aerial photo taken in 2012 that the is-land which has formed between two channels is divided by many small channels of various sizes. The river is restoring its brided pattern (Fig.2).
Prognosis: According to the vertical stability
analysis, the riverbed in this area shows alternate-ly intense sedimentation and erosion processess.
as long as those processes continue, there is a risk even for the local road on the length of about 700 meters. Field observations indicate intensive sediment movement. However, precise determi-nation of the stream power values and bottom stresses requires modeling calculations, taking into account the current geometry of the Raba river channel on this section.
The aerial photo shows that in years 1963–1967 Section-3 was characterized by
braid-ed channel with bbraid-ed-forms and bars, and with bbraid-ed activity ranged to 200 m or more.
Before river training works, the hy-draulic parameters of the channel were for Qmin: ω=12 – 22 W/m2, τ=10 – 15 N/m2. The channel-forming discharge was estimated as Q67% =102 m3/s and it lasted with higher for 5 days only. The river training carried out in 1967 transformed the braided channel into 30 m width prismatic channel, both-sides limited by groyne-ses and revetments. In the following years, i.e. 1967–1980, the channel-forming discharge was estimated as Qch-form.=58 m3/s and it lasted with higher flows for 52 days.
In the aerial photo taken in 1980 it can be seen that the river channel is stable in Section-3. In the
years 1980–1982, the channel-forming discharge was calculated as Qch- form.=72 m3/s and it lasted with higher flows for 11 days only. The maximum observed discharge was Qmax=173 m3/s.
The field measurements carried out in 1982 show that in the whole Section-3, the
bed-load active channel widened itself of about 20–45 m (Table 4). After river training executed in 1982 with the new channel width of 50 m (for Qch- form.= 72 m3/s: ω = 38 W/m2 and τ = 34 N/m2) partly limited by groyneses and revetments (Proj-ect 1982). The aerial pictures taken in the fol-lowing years suggest that the channel tended to widen gradually till now. In the years 1982–2012, the channel-forming discharge was calculated as Qch-form.=72 m3/s and it lasted with higher for 172 days. The maximum observed discharge was Qmax=385 m3/s.
The aerial pictures taken in 2012 and 2015, show that the river training works of 1982 suc-cessfully stabilized the river channel. At km 83 + 400 of the river course, just behind the new bridge construction the channel is divided into two different parts. It is caused by the pier of the bridge located it the middle of the main channel.
Prognosis: After the last river training works,
stable. It is well-seen on the aerial photo taken in 2015. Therefore, the hydraulic parameters of the channel (longitudinal slope, ω, τ) will reach a similar value to that of the state before the works of 1967 – the riverbed will still be stable. Model tests are required to confirm this.
Section-4 is a junction of the main Raba river
channel and both-sides its two tributaries. On the basis of the aerial photographs taken in 1963, it can be seen that the channel was braided with bed-forms and bars, and with bed activity ranged to 200 m. The visible up-stream sinusoity of both tributaries mouth, the right-sided sinusoity of the right-side tributary, becomes one of the reasons for the instability of the right bank in Section-3
located above.
In years 1963–1967, the channel-forming dis-charge was calculated as Q67% =102 m3/s and it lasted with higher for 5 days only. The maximum observed discharge was Qmax=257 m3/s.
In 1967, the channel was narrowed due to the project up to the width of 30 m with both-sides limited by groyneses (Project 1967). The current field observation and the aerial photos show that the channel still tends to widen gradually. In the years 1967–1980, the channel-forming discharge was calculated as Qch-form.=58 m3/s and it lasted with higher for 52 days. The maximum observed discharge was Qmax=475 m3/s.
In the 1980s aerial photo, it can be seen that the training works of 1967 led to balancing the river channel processes throughout the entire sec-tion. The exception is the area with the mouth of the right-side tributary where the process of sedimnt deposition was observed. In the years 1980–2012, the channel-forming discharge was calculated as Qch-form.=72 m3/s and it lasted with higher for 199 days. The maximum observed dis-charge was Qmax=385 m3/s.
The aerial photo of 2015 shows that the new-ly formed channel took over the function of the main river channel, connecting with the mouth of the left-side tributary. Total destruction of the left bank revetment is observed. The old river chan-nel (at the right bank) is gradually covered with the sediments. The lower course of the channel
in Section-4 is stabilized In years 2012–2015 the
channel-forming discharge was calculated as Q ch-form.=76 m3/s and it lasted with higher for 6 days only. The maximum observed discharge was Qmax=361 m3/s.
Prognosis: The destruction of left bank
revetment was probably caused by excessive
narrowing of the channel in 1967 (30 m). Cur-rently, without the stabilization of the left-side tributary’s mouth, the processes of channel mov-ing towards the Kraków-Zakopane national road will continue. The right bank of the channel could be stable. However, the determination of hydrau-lic parameters will indicate the intensity of the course of channel moving.
The calculated specific stream power ω ranges from 33 to 38 W/m2 in the regulated channel (Sec-tion-1 – Section-3), whereas in the natural chan-nel (Section-1 – Section-3) of the studied sections it ranges 12–14 W/m2 . The patterns of change in ω are highly correlated to the changes in chan-nel slope and width due to projects executions. In most cases, as other authors observed (Bledsoe et al., 2002; Brookes, 1987), the channel changes have often been associated with specific stream power value. It can be considered as an indicator of zones of potential sediment movement through-out the river reach. High changes of stream power can be generally associated to erosion (increase of ω) or sediment accumulation (decrease of ω), (Reinfelds et al., 2004, Radecki-Pawlik 2002) as it is observed in four studied currently sections. Shear stress (τ) were examined as well in order to confirm the sediment movement ability.
CONCLUSIONS
1. The history and evolution of the selected part of the Raba river was assessed using all the available data, from various sources.
2. The data was analyzed concerning the vertical and horizontal evolution of river bed.
3. Unfavorable changes of the river bed (con-cerning existing development of the river val-ley) on some areas were stopped (Section-3) meaning that intervention was successful. On some of them (Section-2 and Section-4), it is deteriorating.
4. One of the main causes of growing instability of the river bed, as determined by the research, was too narrow channel width, which was the result of river training works.
5. Provisional prognosis of future changes was
formulated based on available data and its anal
-ysis. However, much more detailed research, including water flow and bed-load modeling is needed.
use of incoherent historical data for integrated river bed evolution analysis. The first step was therefore to bring about the data to the state useful for further work. It affected aerial pho-tos and maps, historical construction projects and other data, including river hydrology. 7. Data acquired and distributed at the present
time, using current technology shall be free of these issues, as a basis for a new standard in the river bed analysis. That is:
a) Making aerial photographs during, or just after major flood events.
b) Prompt calibration and orthogolisation of that aerial photos.
c) Historic and traditional way of marking of po-sitions of structures along river using kilometer marks shall be abolished, as it leads to uncer-tainties and errors concerning the actual posi-tion of structures. Any geographic coordinate system deemed to be useful and convenient can be used instead (for example Polish PL2000, international WGS84 or other).
d) Detailed measurements of the river bed geom-etry and granulometric composition, including its submerged part, shall be done in regular in-tervals, especially after main flood events. e) Only an integrated analysis, taking into
consid-eration maximum available data (including all aerial photos and maps, all known river train-ing projects) must be used to formulate prog-nosis of river channel evolution.
REFERENCES
1. Ashmore P. 2001. Braiding phenomena: statics and kinetics. In Gravelbed Rivers V, Mosley MP (ed.). New Zealand Hydrological Society: Wellington; 95–121.
2. Bagnold, R.A., 1980. An empirical correlation of bedload transport rates in flumes and natural rivers. Proc. R. Soc. Lond. A 372 (1751), 453–473. 3. Bertoldi W, Zanoni L, Tubino M. 2009. Planform
dynamics of braided streams. Earth Surface Pro-cesses and Landforms 34: 547–557.
4. Bledsoe, B.P., Watson, C.C., Biedenham, D.S., 2002. Quantification of incised channel evolution and equilibrium. J. Am. Water Resour. Assoc. 38, 861–870.
5. Brasington J, Langham J, Rumsby BT. 2003. Meth-odological sensitivity of morphometric estimates of coarse fluvial sediment transport. Geomorphology 53: 299–316.
6. Brasington J, Rumsby BT, Mcvey RA. 2000. Mon-itoring and modeling morphological change in a braided gravel – bed river using high resolution GPS – based survey. Earth Surface Processes and Landforms 25: 973–990.
7. Bravard, J.-P., Kondolf, G.M., Piegay, H., 1999. Environmental and societal effects of channel inci-sion and remedial strategies. Incised River Chan-nels: Processes, Forms, Engineering and Manage-ment. Wiley, pp. 303–341.
8. Brookes, A., 1987. River channel adjustments downstream from channelization works in Eng-land and Wales. Earth Surf. Process. Landf. 12, 337–351.
9. Carbonneau PE, Lane SN, Bergeron NE. 2004. Catchment-scale mapping of surface grain size in gravel bed rivers using airborne digital imagery. Water Resources Research.
10. Egozi R, Ashmore P. 2009. Experimental analysis of braided channel response to increased discharge. Journal of Geophysical Research –Earth Surface 114: F02012.
11. Ferguson R, Ashmore P, Ashworth P, Paola C, Pre-stegaard K. 1992. Measurements in a braided river chute and lobe. I: Flow pattern, sediment transport and channel change. Water Resources Research 8: 1877–1886.
12. Gomez B. 1991. Bedload transport. Earth Science Reviews 31: 89–132.
13. Lane SN, Chandler JH, Richards KS. 1994. De-velopments in monitoring and terrain modelling of small – scale river bed topography. Earth Surface Processes and Landforms 19: 349–368.
14. Legleiter C.J. 2013, Mapping river depth from pub-licly available aerial images, River Res. Applic. 29: 760–780.
15. Lisle, T.E. 2005. Bed mobility: A key linkage be-tween channel condition and lotic ecosystems. Eos, Transactions of the American Geophysical Union 86: Joint Assembly Supplement, Abstract B44B-01. 16. May, C.L., Pryor, B., Lisle, T.E., and Lang, M.
2009. Coupling hydrodynamic modeling and em-pirical measures of bed mobility to predict the risk of scour and fill of salmon redds in a large regulated river. Water Resources Research 45: W05402. 17. Meyer-Peter, E. and Müller, R., 1948. Formulas
for bed-load transport, Report on second meeting of IARH. IAHR, Stockholm, Sweden, pp. 39–64. 18. Mosley, M. P. (1982), Analysis of the effect of
changing discharge on channel morphology and instream uses in a braided river, Ohau River, New Zealand, Water Resour. Res., 18, 800– 812. 19. Nelson, P.A., Venditti, J.G., Dietrich, W.E. et al.
20. Parker, C., Clifford, N.I., Thorne, C.R., 2011. Un-derstanding the influence of slope on the threshold of coarse grain motion: revisiting critical stream power. Geomorphology 126, 51–65.
21. Peirce S., Ashmore P., Ledux P. 2018. The variabil-ity in the morphological active width: Results from physical models of gravel-bed braided rivers, Earth Surf. Process. Landforms 43, 2371–2383.
22. Radecki-Pawlik A., 2002. Bankfull discharge in mountain streams: theory and practice. Earth Sur-face Processes and Landforms. Vol. 27. Iss. 2 p. 115–123.
23. Reinfelds, I., Cohen, T., Batten, T., Brierley, G., 2004. Assessment of downstream trends in channel gradient, total and specific stream power: a GIS ap-proach. Geomorphology 60, 403–416.
24. Rumsby BT, Brasington J, Langham JA, McLel-land SJ, Middleton R, Rollinson G. 2008. Monitor-ing and modellMonitor-ing particle and reach scale morpho-logical change in gravel – bed rivers: applications and challenges. Geomorphology 93: 40–54. 25. Stevens, M.A., Simons, D.B. and Richardson, E.V.
1975. Nonequilibrium river form. American Soci-ety of Civil Engineers, Journal of the Hydraulics Division 101: 557–566.
Technical Projects:
26. Projekt regulacji rzeki Raby od km 84+300 – 78+514 m. Pcim – Stróża, Projekt techniczny: TD-235/67, Okręgowy Zarząd Wodny Krakowie, (Egz. Arch – Państwowe Gospodarstwo Wody Polskie – RZGW – Kraków). (in Polish).
27. Umocnienie brzegów koryta od km 81+250 – 82+150, Projekt techniczny: ID-225/203/73, Przedsiębiorstwo Budownictwa Wodnego w Krakowie, Pracownia Projektowa, (Egz. Arch – Państwowe Gospodarstwo Wody Polskie – RZGW – Kraków). (in Polish).
28. Regulacja rzeki Raby w km 78+240 – 80+200, Projekt techniczny: UP2/76, Przedsiębiorstwo Bu-downictwa Wodnego w Krakowie, Pracownia Pro-jektowa, (Egz. Arch – Państwowe Gospodarstwo Wody Polskie – RZGW – Kraków). (in Polish). 29. Rzeka Raba od km 83+300 – 84+200 w miejscowości
Pcim, Projekt techniczny: OK.-1226/P/82, Hydro-projekt – Kraków, Egz. Arch – Państwowe Gos-podarstwo Wody Polskie – RZGW – Kraków). (in Polish).