http://www.sciencepublishinggroup.com/j/ijdsa doi: 10.11648/j.ijdsa.20190504.13
ISSN: 2575-1883 (Print); ISSN: 2575-1891 (Online)
Predictive Modeling of the Brand Equity: Analysis Based
on Multiple Logistic Regression and Backward Stepwise
Model Selection Methods
Gehan Shanmuganathan Dhameeth
Business and Economics Department, Wells College, Aurora, New York, USA
Email address:
To cite this article:
Gehan Shanmuganathan Dhameeth. Predictive Modeling of the Brand Equity: Analysis Based on Multiple Logistic Regression and Backward Stepwise Model Selection Methods. International Journal of Data Science and Analysis. Vol. 5, No. 4, 2019, pp. 67-72. doi: 10.11648/j.ijdsa.20190504.13
Received: July 31, 2019; Accepted: August 26, 2019; Published: September 10, 2019
Abstract:
Brands play a significant role at the point of consumer purchases decisions. Brand managers make all the efforts to induce consumers to purchase their brands and increase eventual brand associations for long-term profits. This paper focuses on how different generations, especially the Millennial and the Baby boomers, behave towards brands based on organizations’ brand building efforts to create Brand Equity (BE) using a predictive model. Prior research has not been successful to provide a detailed understanding of generations and their potential brand behavior in a predictive perspective. In this article, author used a predictive model of the brand behavior of different generations using a Multiple Logistic Regression (MLR) method. In addition, it is determined how the predictor variables (awareness, recall, relate, purchase, knowledge, trials, association, recommendations, salience, imagery, performance, feelings, judgement, and resonance) influence the response variable, brand equity, to predict brand equity in these two audiences. In this study, the author administered an online survey using Survey Monkey to reach local (US) and international college/university respondents (n=267) age 18 years and above. The survey was administered using a questionnaire (46 data points). In the analysis process, the author developed a Multiple Logistic Regression (MLR) model, tested the model error, predicted the brand equity of generations, and determined the best model with parsimonious number of predictor variables using the Backward Stepwise Method (AIC). The analysis suggested the model to be reliable model with a 100% prediction of the brand equity (BE) with a mean value of 1. Given the predictors, the model correctly predicted 63% respondents, millennial and baby boomers, to be associated with brand equity and 35% respondents to be otherwise, while the Best Model based on the Backward Stepwise Selection Method (BSSM) using Step AIC function, suggested thirteen out of fourteen predetermined predictors included in the model to predict Brand Equity (BE). In the results generated, the AIC value indicated was 106.Keywords:
Brand Equity, Millennials, Multiple Logistic Regression, Best Model Selection1. Introduction
Organizations that focus on establishing customer-based brand equity, with an implicit attention to the growing Millennial market will undoubtedly secure long-term profits. The concept of brand loyalty has been studied and researched by many statisticians, scholars, and marketers. Brand loyalty is defined as “a deeply held commitment to rebuy or re-patronize a preferred product/ service consistently in the future” [2]. This simply means that customers who exhibit loyalty to a brand will continue to purchase and engage with
sensitive to increases in price [4]. This is extremely important as this helps increase a brand’s profit margins, sales, and advertising through word-of-mouth. But the big question is; are millennials brand loyal, and on what basis are they loyal? Research indicates that brand loyalty can be determined based off of demographic indicators such as: age, income, gender, etc. However, more so than these general gauges, there are specific degrees of brand loyalty [22]. To date, scholars have argued for demographics, psychographics, and other related sociocultural factors that influence the degree of brand loyalty among the millennials [5, 20, 29, 3, 19]. However, the body of literature has not been successful to provide a detailed understanding of generations and their potential brand behavior in a predictive perspective. As such, in this article, author used a predictive model of the brand behavior of different generations using a multiple logistic regression method. In addition, it is determined how the predictor variables (awareness, recall, relate, purchase, knowledge, trials, association, recommendations, salience, imagery, performance, feelings, judgement, and resonance) influence the response variable, brand equity, to predict brand equity in these two audiences.
2. Literature Review
In this study, we profile millennials based on the profiling grounded in the body of literature. Additionally, brand loyalty and brand resonance have been described and defined.
2.1. Millennials and Brand Loyalty
Lam (2010) argues that people derive their identity from their affiliations with social groups. They value such membership and distinguish themselves from those who did not share such affiliations, forming the in-group and the out-group. When a social identity is threatened, in-group members will likely respond by resorting to three basic strategies: social mobility, social creativity, and social change [27]. Consumer seek many sources to add value to their self-image. The association with certain brands will help to achieve the objective. Customer-Brand Identification (CBI) as a customer’s psychological state of perceiving, feeling, and valuing his or her belongingness with a brand [26]. Customers may switch to a new brand for self-enhancement purposes to maximize socio psychological utility rather than functional utility [18]. Millennials are more likely to be affected by a status brand's symbolic characteristics, by feelings evoked by the brand and by the degree of congruence between the brand-user's self-image and the brand image [7]. Doster (2013) suggests that younger consumers spend more on branded products including status products. When status-seeking consumers discover which brands convey status that they will stay with those brands for as long as the status effect lasts [8]. Millennials are more likely to be affected by a status brand's symbolic characteristics, by feelings evoked by the brand and by the degree of congruence between the brand-user's self-image
and the brand image. Howe, N., & et.al (2000) suggest that younger consumers spend more on branded products including status products. Finally, Kapferer (2005) found that millennials are the cohort most likely to buy prestigious clothing, while Boomers are significantly less prestige sensitive. Depending on generational demographic, how a consumer views perceived store services quality and attitude is based on age. As such, age plays a vital role in determining the degree of the service quality. Stocchi, L., and et.al. (2015) contends that they are not opportunistic in their dealings with the brand, are less price-sensitive, have a long-term relationship perspective, and could ultimately be more profitably served. Going along a similar thought, Yu-Ping, C.., and et al. (2015) suggest that customers’ relationship intentions comprise five sub-constructs: involvement, expectations, forgiveness, feedback and fear of loss of the relationship. Maity, M., & Gupta, S. (2016), argue that customers who are not members of loyalty programs are less affected by advertisements and these advertisements do not significantly affect attitudinal or behavioral loyalty. Customers who are members of LP’s (loyalty programs) are more effectively impacted by attitudinal loyalty through advertisements [21].
2.2. Brand Resonance, Brand Loyalty, and Generation
variety of marketing signals to represent quality, at varying costs [25]. For example, a firm may offer a product warranty, which may incur costs to the brand at a later point in time but is viable for firms with high quality [17]. Things such as warranties can be a subliminal message to people that the brand has a warranty due to the low quality of a brand. Despite the given information of a product during the time of the purchase or search, Keller (2009) offers the idea that customers may respond to different brands differently based on their knowledge about the brand, therefore, creating a brand that is known is the main focus of salience, and but along with the studies done by Putre (2013), one can conclude various ways a brand may be able to do so.
2.3. Brand Equity
One of the most common constructs in marketing is brand equity. Brand equity is of two types; customer-based brand equity and sales-based brand equity [24]. The focus of the manuscript will be on the customer-based brand equity. Kevin Lane Keller (1998) conceptualized that brand equity to be the different preference and response to marketing effort that a product obtains because of its brand identification compared with the preference and response that same product would obtain if it did not have the brand identification. Labrecque et al. (2011) noted that brand equity is the degree of customer association with a particular brand. The degree of association is encompassing with elements, such as awareness, ability to recall, relate, purchases, knowledge about the brand, trials, recommendations, salience, imagery, performance, feelings, judgement, loyalty, and resonance.
3. Methodology
A model was developed based on multiple predictor variables (awareness, recall, relate, purchase, knowledge, trials, association, recommendations, salience, imagery, performance, feelings, judgement, and resonance) that influence brand equity and tested using MLR method considering the test error. In the process of the analysis, all the categorical variables were converted to factors, train (80%) and test (20%) datasets were created, glm ( ) function was used in R programing language to build the LR, test error was evaluated using confusion matrix, and brand equity was predicted based on the above predictor variables. Finally, the best model with a subset selection was performed using the Backward Stepwise Selection Method (BSSM) considering Step AIC function.
3.1. Sample Description
A total of 267 individuals responded to the survey. However, 87 of them (32.6%) did not provide sufficient data to be included in the analysis. Of the remaining 180, 119 provided valid data for the questions related to both Brand Loyalty and Brand Resonance. Chi-square tests were conducted to assess whether respondents with complete data differed from respondents with missing Brand Equity data in
terms of Generation, Residential Status, Education, Income, or Employment Status. None of the tests were statistically significant, indicating that the group with missing data was similar to the group with complete data, at least in terms of these four variables.
3.2. Predictive Model and Measures
This study used predictor variables (X1, X2,…Xn), such as (awareness, recall, relate, purchase, knowledge, trials, association, recommendations, salience, imagery, performance, feelings, judgement, and resonance) to predict the brand equity (Y). These predictor variables were measured using Likert Scales (1-5). Hence, the data collected were categorical. The most suitable statistical method to deal with categorical data was the Multiple Logistic Regression (MLR). The values of Pr(Brand Equity = Yes| X1, X2,…Xn), which we abbreviate p(Brand Equity), will range between 0 and 1. Then for any given value of X1, X2,…Xn, a prediction can be made for brand equity. For example, one might predict brand equity = Yes for any individual for whom p(X1, X2,…Xn) > 0.5. The maximum likelihood is preferred. Likelihood function can be generalized as follows;
log ( ( )
( )) = + +…+
where X = (X1, . . ., Xp) are p predictors. The maximum likelihood method is used to estimate β0, β1, . . . , βp. The estimated coefficients of the multiple logistic regression model that predicts the probability of Brand Equity (BE) using awareness, recall, relate, purchase, knowledge, trials, association, recommendations, salience, imagery, performance, feelings, judgement, and resonance. Brand Equity is encoded as a dummy variable Brand Equity [Yes], with a value of 1 for Brand Equity and 0 for a No-Brand Equity. Based on the above function, the following multiple logistic regression model was developed using R coding; glm(Brand_Equity~Aware+Recall+Relate+Purchases+B_Kn owledge+Trials+Associations+Recommen+Salience+Imager y+Performance+Feelings+Judgement+Brand_Resonan+Bran d_Loyalty, data = raw_data_BE, family = "binomial").
4. Results
Figure 1. Age and the Level of Brand Association.
The above figure (figure 1) depicts the highest level of brand association is to be found in the 35-40 years old category comparatively.
Figure 2. Age and the Level of Willingness to Invest in Brand.
The above figure (figure 2) depicts the highest level of willingness to invest in brands is to be found in the 25-34 and >40 years old categories relative to other age groups.
Figure 3. Income and the Level of Brand Association.
The above figure (figure 3) depicts the highest level of income category towards brand association is to be found in the $61,000 - $70,000 category relative to other income categories.
Figure 4. Education and the Level of Brand Association.
The above figure (figure 4) depicts the highest level of brand association in relation to level education is to be found in the categories of 1 year of college, 3 years of college, and completed grad school relative to other education levels.
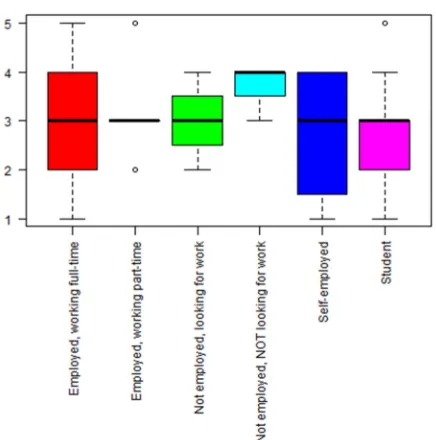
Figure 5. Employment and the Level of Brand Association.
5. Discussion
The implication of these findings for marketing strategies suggests that marketing managers should incorporate all the predictor variables selected by the best model to strategize their brand management activities with the objective of reaping optimal results for organizations when reaching out to millennials and baby boomers as two important market segments.
6. Conclusion
In conclusion, marketing managers should choose the best model that includes all the elements that make up the final marketing communication in order to yield the optimum level of brand equity.
7. Limitations
The study suffered high levels of nonresponse. Of the 267 research participants, 32.6% dropped out during the Brand Loyalty section of the survey, and an additional 22.8% dropped out while answering the Brand Resonance questions. As a result, only 44.6% of the total sample completed the survey. No information was collected from participants to explore their reasons for dropping the survey, but there are a handful of reasons that may be relevant. First, participants were asked to think of a brand of their choosing that they had purchased at some point over the past five years. Specific directions about the type of product or service to consider were not given. The lack of specificity and the long reflection window may have weakened their commitment to completing the survey.
References
[1] Balaji K. V., V., & Indradevi, R. (2015). A Study of The Presence Of Subclinical Narcissistic Tendencies Among Millennial Generation Adults In A Private University. Global Management Review, 10 (1), 1-8.
[2] Barber, N., Dodd, T., & Ghiselli, R. (2008). Capturing the Younger Wine Consumer. Journal of Wine Research, 19 (2), 123-141. doi: 10.1080/09571260802622225.
[3] Brakus, J. J., Schmitt, B. H., & Zarantonello, L. (2009). Brand Experience: What Is It? How Is It Measured? Does It Affect Loyalty? Journal of Marketing, 73 (3), 52-68. doi: 10.1509/jmkg.73.3.52.
[4] Bucic, T., Harris, J., & Arli, D. (2012). Ethical Consumers Among the Millennials: A Cross-National Study. Journal of Business Ethics, 110 (1), 113-131. doi: 10.1007/s10551-011-1151-z.
[5] DeVaney, S. A. (2015). Understanding the Millennial Generation. Journal of Financial Service Professionals, 69
(6), 11-14.
[6] Doster, L. (2013). Millennial teens design and redesign themselves in online social networks. Journal of Consumer Behaviour, 12 (4), 267-279. doi: 10.1002/cb.1407.
[7] Eastman, J. K., Iyer, R., & Thomas, S. P. (2013). The Impact of Status Consumption On Shopping Styles: An Exploratory Look At The Millennial Generation. Marketing Management Journal, 23 (1), 57-73.
[8] Garvey, A. M., Germann, F., & Bolton, L. E. (2016). Performance Brand Placebos: How Brands Improve Performance and Consumers Take the Credit. Journal of Consumer Research, 42 (6), 931-951. doi: 10.1093/jcr/ucv094.
[9] Howe, N., & Strauss, W. (2000). Millennials rising: the next great generation. New York: Vintage Books.
[10] Kakati, R. P., & Choudhury, S. (2013). Measuring Customer-Based Brand Equity Through Brand Building Blocks for Durables. IUP Journal of Brand Management,
10 (2), 24-41.
[11] Kapferer, J.-N. 2005. The new strategic brand management. London: Kogan-Page.
[12] Kaplan Thaler, L., and R. Koval. 2003. Bang! Getting your message heard in a noisy world. New York: Currency. [13] Keller, K. L. (2009). Building strong brands in a modern
marketing communications environment. Journal of Marketing Communications, 15 (2/3), 139-155. doi: 10.1080/13527260902757530.
[14] Keller, K. L., Heckler, S. E., & Houston, M. J. (1998). The Effects of Brand Name Suggestiveness on Advertising Recall.
Journal of Marketing, 62 (1), 48-57.
[15] Kellison, T. B., Yu Kyoum, K., & Magnusen, M. J. (2013). The Work Attitudes of Millennials in Collegiate Recreational Sports. Journal of Park & Recreation Administration, 31 (1), 78-97.
[16] Labrecque, L. I., Krishen, A. S., & Grzeskowiak, S. (2011). Exploring social motivations for brand loyalty: Conformity versus escapism. Journal of Brand Management, 18 (7), 457-472. doi: 10.1057/bm.2011.12.
[17] Lambert-Pandraud, R., & Laurent, G. (2010). Why Do Older Consumers Buy Older Brands? The Role of Attachment and Declining Innovativeness. Journal of Marketing, 74 (5), 104-121. doi: 10.1509/jmkg.74.5.104.
[18] Lam, S. K., Ahearne, M., Hu, Y., & Schillewaert, N. (2010). Resistance to Brand Switching When a Radically New Brand Is Introduced: A Social Identity Theory Perspective. Journal of Marketing, 74 (6), 128-146. doi: 10.1509/jmkg.74.6.128.
[19] Liu-Thompkins, 2013, Y., & Tam, L. (2013). Not All Repeat Customers Are the Same: Designing Effective Cross-Selling Promotion on the Basis of Attitudinal Loyalty and Habit.
Journal of Marketing, 77 (5), 21-36.
[20] Lotfizadeh, F., & Lotfizadeh, F. (2015). Comparing High-involvement and Low-involvement Products: Brand Perspective. International Journal of Management, Accounting & Economics, 2 (5), 404-413.
[22] Mostert, P. G., Petzer, D. J., & Weideman, A. (2016). The interrelationships between customer satisfaction, brand loyalty and relationship intentions of Generation Y consumers towards smart phone brands. South African Journal of Business Management, 47 (3), 25-34.
[23] Putre, L. (2013). The March of the Millennials. H&HN:
Hospitals & Health Networks, 87 (9), 38-42.
[24] Raut, U. R. (2015). A Study on Brand Loyalty and Its Association with Demographics of Consumers: Evidence from the Cellphone Market of India. IUP Journal of Brand Management, 12 (3), 30-44.
[25] Saddlemyer, J., & Bruyneel, S. (2016). Brand Logo Salience as a Signal of Brand Status. Advances In Consumer Research,
44607-608.
[26] Smith K. (2016) Digital marketing strategies that Millennials find appealing, motivating, or just annoying. Journal of Strategic Marketing [serial online]. October 2011; 19 (6): 489-499. Available from: Business Source Premier, Ipswich, MA. Accessed May 25, 2017.
[27] Solomon, M. (2016). 2015 Is the Year of The Millennial Customer: 5 Key Traits These 80 Million Consumers Share. [28] Stocchi, L., Driesener, C., & Nenycz-Thiel, M. (2015). Brand
image and brand loyalty: Do they show the same deviations from a common underlying pattern? Journal of Consumer Behaviour, 14 (5), 317-324. doi: 10.1002/cb.1522.
[29] Von Freymann, J. W. (2006). Age and Generational Cohort Effects in Store Assessments and Choice: A Case Study.
Marketing Management Journal, 16 (2), 203-222.
[30] Yu-Ping, C., Nelson, L. D., & Ming, H. (2015). From "Where" to "What": Distributed Representations of Brand Associations in the Human Brain. Journal of Marketing Research (JMR),