Journal of Water Resources and Ocean Science
2013; 2(3): 33-39Published online June 30, 2013 (http://www.sciencepublishinggroup.com/j/wros) doi: 10.11648/j.wros.20130203.12
Fuzzy set approach–A tool to cluster Holy samples of
groundwater quality parameters at Rameswaram, South
India
V. Sivasankar
1, *, M. Kameswari
2, T. A. M. Msagati
3, M. Venkatapathy
4, M. Senthil Kumar
51Department of Chemistry, Thiagarajar College of Engineering (Autonomous), Madurai – 625 015, Tamil Nadu, India 2Department of Mathematics, Thiagarajar College of Engineering (Autonomous), Madurai – 625 015, Tamil Nadu, India
3
Department of Applied Chemistry, University of Johannesburg, Doornfontein Campus, P. O. Box 17011, Johannesburg, South Africa
4
Department of Chemistry, A.A Government Arts College, Musiri – 621 221, Tamil Nadu, India
5
Department of Civil Engineering, Sethu Institute of Technology, Virudhunagar – 626 115, Tamil Nadu, India
Email address:
[email protected](V. Sivasankar)
To cite this article:
V. Sivasankar, M. Kameswari, T. A. M. Msagati, M. Venkatapathy, M. Senthil Kumar. Fuzzy Set Approach–A Tool to Cluster Holy Samples of Groundwater Quality Parameters at Rameswaram, South India. Journal of Water Resources and Ocean Science.
Vol. 2, No. 3, 2013, pp. 33-39. doi: 10.11648/j.wros.20130203.12
Abstract:
A fuzzy set theoretic approach has been developed to study the potable nature of the holy groundwater samples in summer and winter by clustering method using equivalence relation. The physico-chemical parameters viz., pH, Salinity, TDS, CH, MH, TH, Chloride and Fluoride are considered as attributes to develop the clusters. Based on the WHO recommendations, the linguistic approach has been developed for the water quality parameters of 22 holy groundwater samples in this study. Normalized eucilidean distance chosen for this study, measures the deviation of the determined quality parameters for any two holy groundwater samples. In the present paper, the seasonal changes in the quality of the water samples among the clusters at various rational alpha cuts are derived. The fluctuation in the water quality parameters was apparent such that the clusters contract from summer to winter with an exception of one sample with remarkable quality called Sethumadhava.Keywords: Fuzzy Set, Potable Nature, Groundwater, Fuzzy Cluster, Alpha Cuts
1. Introduction
The physico-chemical quality of drinking water becomes as important as its availability. The water quality parameters with desirable, acceptable and not acceptable values, recommended by World Health Organisation (WHO) create awareness among the public, which enroute them towards the removal techniques [1, 2]. From the WHO guideline values, the groundwater samples are categorized for quality with respect to each water quality parameter. This may lead to a decision but with ambiguity, because it is derived out of only one parameter. So far, numerous research works have been carried out in the determination of water quality using fuzzy synthetic evaluation [3 – 5], fuzzy process capability [6], fuzzy clustering and pattern recognition method [7, 8], fuzzy logic approach [9], fuzzy logical rule [10],fuzzy simulink model [11], fuzzy logic drastic vulnerability map [12], fuzzy GNDCI-CNR method
[13] and fuzzy set theory [14]. In the present work, a new focus has been attempted using fuzzy equivalence relation to arrive at non-overlapping clusters of 22 groundwater samples by considering various agreement levels (alpha cuts).
2. Study Objectives and Methods
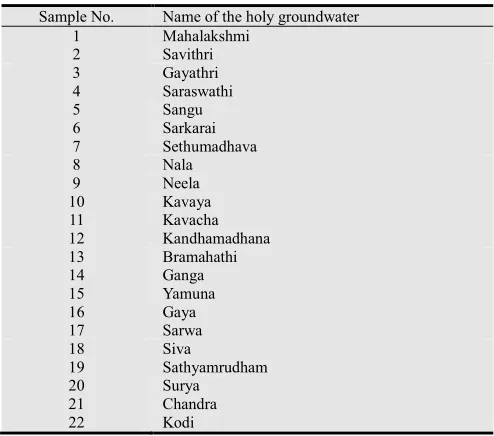
The objective of the present study is to obtain non-overlapping clusters of twenty two holy groundwater samples (Table 1) of Rameswaram temple in the summer and winter seasons based on the water quality parameters
viz., pH, Salinity, Total Dissolved Solids (TDS), Calcium
Hardness(CH), Magnesium Hardness(MH), Total
Hardness(TH), Chloride(Cl) and Fluoride(F). 2.1. Study Area
34 V. Sivasankar et al.: Fuzzy Set Approach–A Tool To Cluster Holy Samples Of Groundwater Quality Parameters At Rameswaram, South India
9º28’North Latitude and 79º3’East Longitude with an average elevation of 10 meters above the MSL, covering an area of 61.8 sq.kms and bearing a population of about 38,000, as on September 2007. This Indian Island having connection with main land assumes a shape of conch, is a Taluk with 1 Firka, 2 Revenue villages and 31 Hamlets. Climate prevails with a minimum temperature of 25ºC in winter and a maximum of 36ºC in summer. The average rainfall is 813mm [15, 16].
Table 1. Name of the holy groundwater samples
Sample No. Name of the holy groundwater
1 Mahalakshmi
2 Savithri
3 Gayathri
4 Saraswathi
5 Sangu
6 Sarkarai
7 Sethumadhava
8 Nala
9 Neela
10 Kavaya
11 Kavacha
12 Kandhamadhana
13 Bramahathi
14 Ganga
15 Yamuna
16 Gaya
17 Sarwa
18 Siva
19 Sathyamrudham
20 Surya
21 Chandra
22 Kodi
2.2. Clustering of Groundwater Samples
Let S1, S2 ...S22 were the twenty two groundwater
samples of Rameswaram temple are considered for clustering based on the criteria C1, C2...C8 viz., pH,
Salinity, TDS, CH, MH, TH, Cl and F.
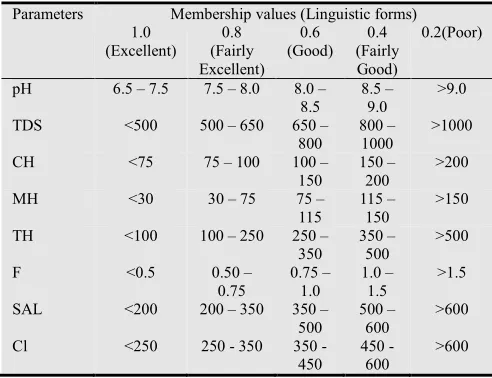
Linguistic terms such as Excellent, Fairly Excellent, Good, Fairly Good and Poor were assigned to the chosen water samples with respect to the recommendations of the World Health Organisation [17].
2.3. Membership Functions and Fuzzy Relations
Membership function (µ) is a critical measure which represents numerically the degrees of elements belonging to a set. Distance measure is a term that describes a difference between fuzzy sets and can be considered as a dual concept of similarity measure.
The linguistic terms (Table 2) were converted into fuzzy numbers (membership functions) using probability technique. Using the fuzzy numbers, the Normalised euclidean distance (eqn.1)
(1)
was used to obtain similarity measures, which was found
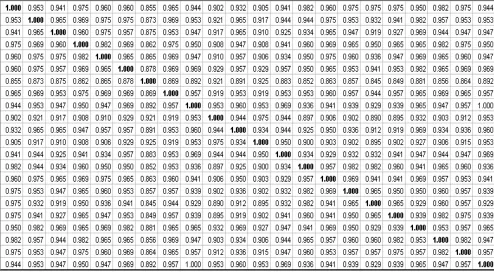
by subtracting the distance measure from 1 using MATLAB (version 7). The obtained similarity measure possesses tolerance relation (R) between the undertaken groundwater samples (Tables 3 and 4). A fuzzy relation (R) is said to be fuzzy tolerance relation if R is reflexive [if µR(x,x)=1, for
every x Є X] and symmetric [if µR[x,y)=µR(y,x) for every
x,y Є X].
A fuzzy relation, R is said to be fuzzy equivalence relation RE, if R is fuzzy tolerance relation and transitive
closure [if µR satisfies µR(x,z)≥ min{µR(x,y), µR(y,z)}for
every x,y,z Є X.
An equivalence relation (RE) in Tables 5 and 6 was
determined from the computed tolerance relation by the following algorithm using Visual C + + on windows platform.
Step 1: R’ =R o (R∪R)
Step 2: If R’ ≠R, make R=R’ and go to step 1. Step 3: Stop: R’ = RE
In the above o is the max-main composition of fuzzy relations and ∪ is the standard fuzzy union. By the consideration of reasonable alpha cuts ({x/µ(x) > α, for some x ЄX}), the groundwater samples were clustered in the non-overlapping nature.
3. Results and Discussion
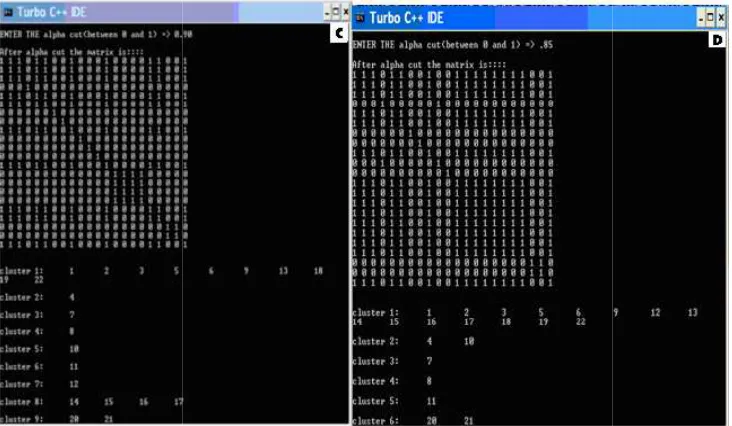
For grouping the 22 groundwater samples with respect to nine water quality parameters according to the WHO recommendations, the present work was initiated with a consideration of two suitable agreement levels (alpha cut), α = 0.85 and 0.90 from four reasonable agreement levels, from α = 0.80, 0.85, 0.9 and 0.95. The remaining two alpha cuts (α = 0.8 and 0.95) generated a minimum number (two) of clusters, which does not reveal any significant impact in grouping the groundwater samples in accordance with the chosen water quality parameters. The non-overlapping clusters (grouped water samples) for the above two suitable alpha cuts in summer and winter seasons are depicted in Fig.1.
From the Fig 1, it can be accounted that the samples 7, 8, 11 and 20 & 21 remain as separate clusters both at 85% and 90% Agreement Level (AL). Thus the above said samples did not have any quality parametric changes at both the agreement levels. The samples 4 and 10 from a similar cluster at 85% AL were found to stay as independent clusters at 90% AL. Similarly, the samples 14, 15, 16 and 17 of same cluster at 85% AL got separated into an individual cluster at 90% AL. From these results, it is observed that, even at 0.05% difference in AL reveal some changes in the water quality characteristics.
Journal of Water Resources and Ocean Science 2013; 2(3): 33-39 35
and 12 from two different clusters in summer grouped into a particular cluster in winter.
In summer, at 0.9 AL, there were nine clusters which get converged into five clusters in winter. Similarly, six clusters in summer at 0.85 AL get grouped and formed three separate clusters in winter.
A cluster with the samples 1,2,3,4,5,6,9,13,18,,19 & 22 in summer breaks into a separate cluster with the samples 9 & 22 and another cluster with the sample designated as 13 in winter. The above cluster separation from summer to winter indicates the change in the water quality parameters with respect to dilution influenced by seasons.
The samples 7 and 11, identified as separate clusters in summer were found to retain the same identity in winter at both agreement levels (0.9 and 0.85). This shows that the water quality parameters of both the samples falls within the standards fixed in this study as per WHO even after the seasonal influence.
In winter, the number of clusters at 0.9 AL and 0.85 AL were computed to be 6 and 3 respectively and this highlights the reduction of clusters indicates the role of dilution which causes recharging of groundwater and setting the water quality parameters with respect to the fixed standards as per WHO. In winter, at 0.9 and 0.85, there were two separate clusters formed with 7 and 10 & 12 as samples. The remaining samples have formed as a separate cluster by indicating their suitability within a particular water quality standard. The agreement level of 0.85 in both summer and winter was found with 6 and 3 clusters respectively.
In this case a separate cluster having the sample no.7 in both summer and winter was observed. Samples 12 and 10 from two separate clusters in summer were found to form a particular cluster in winter. This reflects that these two samples possess the quality characteristics within a particular limit, fixed in the study in accordance with WHO recommendations.
The identity of a single membered cluster containing a groundwater sample No. 7 (Sethumadhava) at both the agreement levels in two different seasons, ascertains the distinct quality of the water sample. Evidently, the present observation was in agreement with our earlier work [18].
4. Conclusions
Based on the above discussions, the following conclusions are drawn.
1. Among the four agreement levels (alpha cuts), the suitability was found for those at α = 0.85 and 0.9, where appreciable number of clusters were generated.
2. From each appreciable cluster containing a group of water samples, the similarity of ground water quality among the samples with respect to the chosen parameters, was identified.
3. A cluster consisting of only one groundwater sample i.e. sample no.7 (Sethumadhava) at the suitable agreement levels in both summer and winter, was found to exhibit a distinct water quality by itself.
4. The contraction of clusters from summer to winter signifies the fluctuations in the water quality parameters at both the agreement levels.
Table 2. Membership values assigned for the water quality parameters
Parameters Membership values (Linguistic forms)
1.0 (Excellent) 0.8 (Fairly Excellent) 0.6 (Good) 0.4 (Fairly Good) 0.2(Poor)
pH 6.5 – 7.5 7.5 – 8.0 8.0 –
8.5
8.5 – 9.0
>9.0
TDS <500 500 – 650 650 –
800
800 – 1000
>1000
CH <75 75 – 100 100 –
150
150 – 200
>200
MH <30 30 – 75 75 –
115
115 – 150
>150
TH <100 100 – 250 250 –
350
350 – 500
>500
F <0.5 0.50 –
0.75 0.75 – 1.0 1.0 – 1.5 >1.5
SAL <200 200 – 350 350 –
500
500 – 600
>600
Cl <250 250 - 350 350 -
450
450 - 600
>600
36 V. Sivasankar et al.: Fuzzy Set Approach
Figure 1. Clustered (non-overlapping) groundwater winter, α = 0.85
Fuzzy Set Approach–A Tool To Cluster Holy Samples Of Groundwater Quality Parameters At Rameswaram, South India
overlapping) groundwater samples by MAT LAB program for A) summer, α = 0.9 B) summer, α = 0.85 C) winter, α = 0.9 D)
Table 3. Tolerance matrix in Summer
A Tool To Cluster Holy Samples Of Groundwater Quality
Journal of Water Resources and Ocean Science
Journal of Water Resources and Ocean Science 2013; 2(3): 33-39
Table 4 Tolerance matrix in winter
Table 5. Equivalance matrix in Summer
38 V. Sivasankar et al.: Fuzzy Set Approach–A Tool To Cluster Holy Samples Of Groundwater Quality Parameters At Rameswaram, South India
Table 6 Equivalance matrix in Winter
Acknowledgement
The authors thank the Principal and management of Thiagarajar College of Engineering (Autonomous), Madurai – 625 015, Tamil Nadu, India.
References
[1] Biswas K, Bandhoyapadhyay D, Ghosh UC, Adsorption kinetics of fluoride on iron(III)-zirconium(IV) hybrid oxide, Adsorption, 13, pp. 83 – 94, 2009.
[2] Karthikeyan M, Satheeshkumar KK, Elango KP, Defluoridation of water via doping of polyanilines, J Hazar. Mater. 163, pp. 1026-1032, 2009.
[3] Lu RS, Lo SL, Hu JY, Analysis of reservoir water quality using fuzzy synthetic evaluation, Stoch. Environ. Res. Risk Assess. 13, pp. 327-336, 1999.
[4] Jianhua W, Xianguo L, Jinghan, T, Ming J, Fuzzy Synthetic Evaluation of Water Quality of Naoli River Using Parameter Correlation Analysis, Chin. Geogra. Sci., 8(4), pp. 361-368, 2008.
[5] Singh B, Dahiya S, Jain S, Use of fuzzy synthetic evaluation for Assessment of groundwater quality for drinking usage: a case study of Southern Haryana, India, Environ. Geol. 54, pp. 249 – 255, 2009.
[6] Kahraman C, Kaya I, Fuzzy process capability indices for quality control of irrigation water, Stoch. Environ. Res. Risk
Assess., 23, pp. 451- 462, 2008.
[7] Chuntao R, Changyou L, Keli J, Sheng Z, Weiping L, Youling C, Water quality assessment for Ulansuhai Lake using fuzzy clustering and pattern recognition, Chinese Journal of Oceanology and Limnology, 26(3), pp. 339-344, 2008.
[8] Yuan-yuan M, Xue-gang A, Lian-Sheng W, Fuzzy pattern recognition method for assessing ground vulnerability to pollution in the Zhangji area, Journal of Zhejiang University Science A, ISSN 1009- 3095(Print); ISSN 1862-1775(Online), 2006.
[9] Muhammetoglu A, Yardimci A, A fuzzy logic approach to assess groundwater pollution levels below agricultural fields, Environ. Monit. Assess. 118, pp. 337-354, 2006.
[10] Sei Z, Fuzzy groundwater classification rule derivation from quality maps, Water quality, Exposure and Health, 1, pp.114 – 122, 2009.
[11] Kumar NV, Mathew S, Swaminathan G, Multifunctional fuzzy approach for the assessment of groundwater quality, J Wat. Res. Prot., 2, pp.597 – 608, 2010.
[12] Rezaei F, Safavi HR, Ahmadi A, Groundwater vulnerability assessment using fuzzy logic: a case study in the zayandehrood aquifers, Iran, Environ Manage., 51, pp.267 – 277, 2013.
[13] Caniani D, Lioi DS, Mancini IM, Masi S, Sdao F, Fuzzy logic model development for groundwater pollution risk assessment, European Water, 35, pp.13 – 22, 2011.
Journal of Water Resources and Ocean Science 2013; 2(3): 33-39 39
Analysis of groundwater quality using fuzzy synthetic evaluation, J Hazard. Mater., 147, pp.938 – 946, 2007. [15] http://www.ramnad.tn.nic.in/SH2006.htm.
[16] http://en.wikipedia.org/wiki/Rameswaram
[17] World Health Organisation, Guidelines for drinking water
quality,vol.2, Health criteria and other supporting information, 2nd ed., Geneva, 2006.