423 | P a g e
Simulation of Hybrid Tabu Search Algorithm for Surface
Roughness Prediction in Dry Milling Operations
D.Ramalingam
1, Dr.M.Saravanan
2, R.Rinu Kaarthikeyen
3, T.Muthumari
4*
1Associate Professor, Nehru Institute of Technology, Coimbatore, (India)
2Principal, SSM Institute of Engineering and Technology, Dindigul, (India)
3Research Associate, Manager – Engineering, TCMPFL, Chennai,(India)
4Research Associate, Nehru Institute of Engg & Tech, Coimbatore, (India)
ABSTRACT
Machining operations on the FRP composite materials always recognized as the major taxing tasks by the manufacturers. Dimensional accuracy along with the good surface finish of the product is the main concern towards the final product functional aspects. Fibre damage and the structural damage known as delamination is the major setback at time of machining by any metal cutting process. Machining speed and toll feed, depth of cut are the three key input variables which took vital role on the end quality of the materials being processed. In order to obtain the desired quality outcome in this investigation the optimisation of machining parameters and forecasting the best suited combination are effected through Tabu search algorithm in MATLAB programming. With the analysis through the regression relationship and linked to the optimisation algorithm to perform the optimised parameter combinations were identified for the minimum delamination on the work material ATLAC 382 -05 (FRP) in dry milling process.
Key words-ATLAC 382-05composite, Milling, Regression, Tabu Search Algorithm, Minitab,
MATLAB.
I. INTRODUCTION
In the midst of machining operations, milling process has its own substantial degree of application in assembling
parts to make into the final product for purpose. With the high strength and rigidity attached with low weight,
excellent fatigue strength and in various aspects, the usage of FRP composite materials are more significant in
the fields aerospace, aircraft, transportation, marine bodies etc, thereby they replace the conventional
engineering materials. The modification to the dimensional accuracy and quality aspects of these composites
into final products is connected with machining by conventional as well as non conventional methods of
machining. During machining operations the common quality problems like delamination, obtaining the
dimensional accuracy and precision, required surface finish is still exist. All such issues are directly linked with
the materials properties and process parameters like machining speed; tool feed rate, tool material and
properties, tool geometry etc. In this investigation the FRP composite namely ATLAC 382-05 is taken for
424 | P a g e
considered in this investigation to forecast the suitable combination of machining parameters through Tabusearch Algorithm application in MATLAB programming..
II. RELATED LITERATURE
Over a period of time many researches are performed serious attempts through several methods and technology
to locate the issues related and suggesting various approaches to achieve the most desired results in various
machining processes on various materials like metals, alloys, composites. Meanwhile productivity and quality
are the two distinct aspects which is necessary for any manufacturing industry. To achieve these, the process
parameters as well as the machining environment should be suitably synchronized as they are contradictory in
nature. It is an accepted fact that maximizing productivity is directly associated to the machining cost. By fact,
productivity can be interpreted in terms of MRR and quality can be interpreted in terms of product
characteristics, i.e. dimensional accuracy, surface smoothness and form stability, etc. Moreover in order to
understand the effects of machining parameters in the various machining many of the researchers used
optimization techniques. Optimisations as well as process modeling are two parallel important criteria in
manufacturing in which such manufacturing processes are entangled through a variety of vigorously interacting
process variables. Delamination is one among such important factors of machining outcome to predict the
concert of any machining operation. The literature includes only soft computing applications and meta-heuristic
methods in the analysis of machining parameters for composite materials. Xinwang et al. [1] have investigated
the thrust force and torque influence while drilling over GFRP, CFRP materials using HSS drills and carbide
drills. They noticed that with the increase in the depth of the hole, the thrust force increased. In addition to that,
the observation lead to identify the increase in the thrust force along the feed rate increases. C.C.Tsao [2] has
studied the usage of Grey - Taguchi method towards optimizing the machining parameters while conducting
milling operations in aluminium alloy. They conclusion was that the grey-Taguchi method is appropriate for
solving the surface finish quality and tool flank wear issues in milling process of A6061P-T651 aluminum
alloy. Wang et al. [4] have investigated on the surface quality prediction and cutting parameters optimization in
high-speed milling of AlMn1Cu using regression and GA. Pathak et al. [5] have presented the preparation of an
aluminium silicon carbide composite. They have also given a detailed discussion about the microstructure and
its different mechanical properties. Neelima Devi et al. [6] also presented about the characterization of an
aluminium silicon carbide composite. In their research, tensile strength experiments were conducted by varying
mass fraction of SiC (5, 10, 15, and 20 %) with aluminium. Palanikumar and Karthikeyan [7] experimented and
examined regarding the input parameters influence on the product outcome variables while machining of Al/SiC
particulate composites, using tungsten carbide tool inserts (K10). Dabade et al. [8] through their experimental
study investigated the surface integrity as a function of process parameters and tool geometry by analysing
cutting forces, surface finish, and microstructures of the machined surfaces on Al/SiC/10p and Al/SiC/30p
composites using cubic boron nitride (CBN) inserts. Hou et al. [9] incorporated Taguchi method, RSM and GA
by integration and applied to set the optimal parameters for a nanoparticle milling process. The fitness function
of GA was obtained by RSM and was applied to find the optimal parameters for a nanoparticle milling process.
425 | P a g e
optimum end mill process parameters guiding to minimum cutting force during shoulder milling of aluminum7075–T6 with different cutting condition and found good agreement of results. Julie et al [11] focused their
attention in a study of the Taguchi design application to optimise surface quality in a CNC face milling
operation. Adeel et al. [12] conducted an experimental study to optimise the cutting parameters when measuring
work piece surface temperature and surface roughness by Taguchi techniques. The results showed that the
workpiece surface temperature can be sensed and used effectively as an indicator to control the cutting
performance and improves the optimisation process. They reported that it is possible to increase machine
utilization and decrease production cost in an automated manufacturing environment. Emel Kuram et al [13]
have utilized the Taguchi based grey relational analysis for multi-objective optimization in micro-milling
process parameters.
In this paper an approach of feeding the regression equation relationship (developed in Minitab) as input instead
of random approach based on the fitness of the equation, thereafter the analysis and prediction of optimized
parametric combination is identified by Tabu Search Optimisation Algorithm through MATLAB programming.
III. EXPERIMENTAL PROCEDURE
Paulo Davim et al. [3] have experimented milling operation on the ATLAC 382-05 composite materials
prepared through hand lay-up to the specification of 22 mm of thickness disc used as the specimen material to
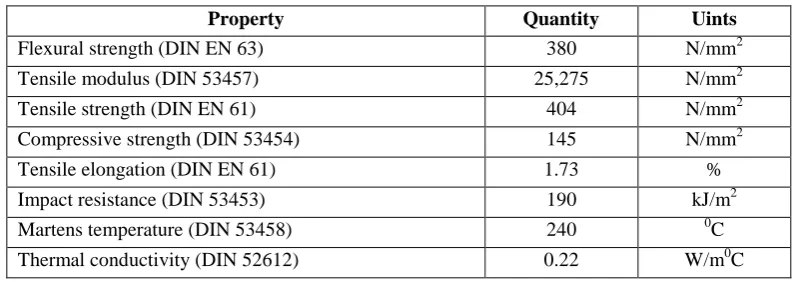
carry out the machining operations. The specific properties of the material are as follows in Table 3.1.
Table 3.1 Properties of ATLAC 382-05 composite
Property Quantity Uints
Flexural strength (DIN EN 63) 380 N/mm2
Tensile modulus (DIN 53457) 25,275 N/mm2
Tensile strength (DIN EN 61) 404 N/mm2
Compressive strength (DIN 53454) 145 N/mm2
Tensile elongation (DIN EN 61) 1.73 %
Impact resistance (DIN 53453) 190 kJ/m2
Martens temperature (DIN 53458) 240 0C
Thermal conductivity (DIN 52612) 0.22 W/m0C
In the ‘‘VCE500 MIKRON’’ machining center which has the maximum spindle speed as 7500 rpm and 11 kW
spindle power the experimental operations were carried out. The cutting tool selected for this a cemented
carbide end mill with 5 mm diameter. The input cutting parameters selection with three levels quoted in the
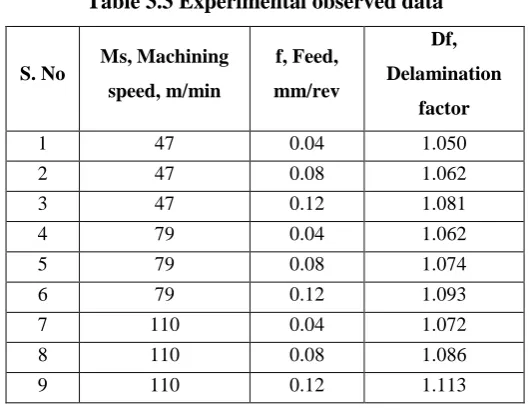
Table 3.2. Taguchi’s L9 array was fixed for the experimental follow up. The output parameters considered for
evaluation of the performance of the operations on the specimen materials were delamination factor (Df).
Table 3.2 Cutting parameters level
Milling operation parameters Level 1 Level 2 Level 3
Cutting speed, m/min. 47 79 110
426 | P a g e
The experiment conducted and the data observed by Paulo Davim et al. [3] taken for this investigation arepresented in the Table 3.3.
Table 3.3 Experimental observed data
S. No Ms, Machining speed, m/min
f, Feed, mm/rev
Df, Delamination
factor
1 47 0.04 1.050
2 47 0.08 1.062
3 47 0.12 1.081
4 79 0.04 1.062
5 79 0.08 1.074
6 79 0.12 1.093
7 110 0.04 1.072
8 110 0.08 1.086
9 110 0.12 1.113
The damage affected on the work material during machining was measured with the microscope Mitutoyo TM
500, with 30 x magnification and 1 µm resolution. Hommeltester T1000 version profilometer was used to
measure the surface roughness and the Kistler type 9257B piezoelectric dynamometer was used to observe the
components of machining forces.
IV. MATHEMATICAL MODELLING
While carrying out the statistical regression analysis in Minitab17 software to analyze the authority of the
machining speed, feed over the delamination, second order regression relationship is of the higher values of the
R – sq comparing to the first order regression. R-sq (adj) and R-sq (pred) values of second order also in line
with the R-sq values. Hence more significant statistical second order equation is selected for further analysis.
First and second order regression model is listed in Table 4.1.
Table 4.1 Regression model comparison for Delamination factor
Parameter Regression S R-sq R-sq(adj) R-sq(pred) Durbin - Watson
Df 1
st
order 0.0036684 97.18% 96.24% 92.71% 2.12627
2nd order 0.0020493 99.56% 98.83% 94.82% 1.96034
Such framed second order regression equations through the Minitab17 for the output parameter in terms of input
parameter combination are, Df = (1.0443) + (0.000064 x Ms) – (0.176 x f) + (0.000001 x Ms2) + (2.812 x f2)
427 | P a g e
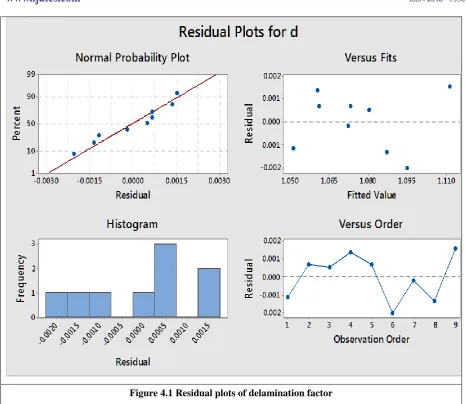
Figure 4.1 Residual plots of delamination factorFigure 4.1 depicts the residual plots through Minitab analysis for the delamination factor. Through performing
the best subset regression analysis the parameter feed is highly influencing on delamination followed by the
speed.
Table 4.2 Input parameters influencing level on the output parameters Output parameters Influence level of Feed Influence level of Speed
Delamination 61.8 % 35.4 %
The influencing level of feed and speed on the output parameter is listed through in Table 4.2. This shows that
the perfect balancing of both the parameters in the optimum level is to be maintained at time of machining so as
to obtain the objectives of the manufacturing.
V. OPTIMISATION METHOD
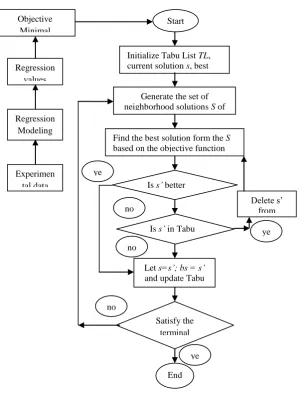
Tabu Search is a Global Optimization algorithm and a Metaheuristic or Meta-strategy for controlling an
embedded heuristic technique. The objective for the Tabu Search algorithm is to constrain an embedded
428 | P a g e
approach is to maintain a short term memory of the specific changes of recent moves within the search spaceand preventing future moves from undoing those changes. Additional intermediate-term memory structures may
be introduced to bias moves toward promising areas of the search space, as well as longer-term memory
structures that promote a general diversity in the search across the search space. Algorithm provides a
pseudocode listing of the Tabu Search algorithm for minimizing a cost function. Tabu Search Algorithm is
applied in this analysis to predict the optimized Delamination factor at time of machining in the experimented
ATLAC 382-05 composite material was programmed with the objective of analyzing the influence of the cutting
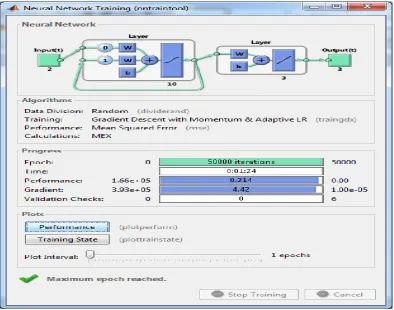
speed and the feed of the tool in the MATLAB R2017 platform with the Elman Back Propagation approach.
With 50000 turns of iterations the values of the output parameters with reference to the input parameters
combinations are computed with the experimental observations individually. Figure 5.1 reveals the progress of
the training data in MATLAB.
Figure 5.1 Data training progress of 50000 iterations
The accuracy level of the each algorithm is assessed with the Mean Squared Error (MSE) 0.026837 in
computation. Tabu Search optimisation is programmed with the fitness condition for computation is modified
with the regression relationship equations instead of taking random selection of combination while computing
through the algorithm. Final results were checked for the accuracy in computations and noticed that the MSE as
0.00883which is further reduced and converges with the lowest deviation. Hence the Regression relationship
based Tabu Search Algorithm results are taken as the optimisation method which suitable for this attempt shown
429 | P a g e
Figure 5.2 Regression feed Tabu search FlowIn view of obtaining the results for the in between values of the level chosen for the experiment, the condition
with uniform step interval is fed into the algorithm computation. The step value taken for speed is 6.3 and feed
is 0.008 (ten equal intervals for both the cases). The computed results through this approach are listed in the
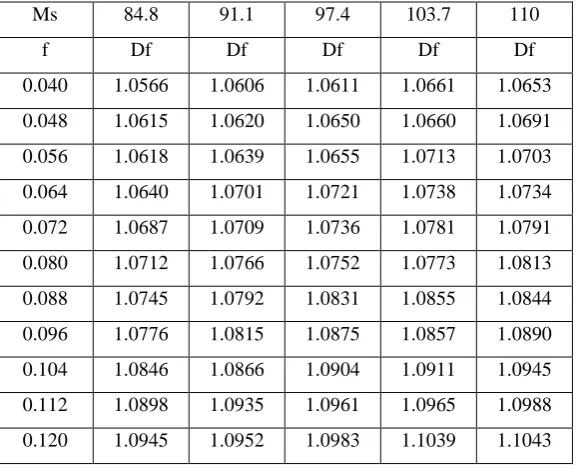
Table 5.1 to Table 5.2.
Table 5.1 Delamination Vs feed for speed 47, 53.3, 59.6, 65.9, 72.2 and 78.5 m /min
Ms 47 53.3 59.6 65.9 72.2 78.5
f Df Df Df Df Df Df
0.040 1.0459 1.0509 1.0504 1.0547 1.0531 1.0563
0.048 1.0479 1.0502 1.0515 1.0556 1.0583 1.0607
0.056 1.0518 1.0544 1.0545 1.0556 1.0579 1.0594
0.064 1.0522 1.0533 1.0555 1.0601 1.0613 1.0632
0.072 1.0541 1.0576 1.0616 1.0637 1.0629 1.0669
Initialize Tabu List TL, current solution s, best solution bs
Let s=s’; bs = s’ and update Tabu
list Start
Is s’ better than bs
Generate the set of neighborhood solutions S of
the current solution s
Find the best solution form the S
based on the objective function value, saved as s’
Delete s’ from candidatese
t Is s’ in Tabu
List
Satisfy the terminal criterion
End
ye s ye
s
ye s no
no no Experimen
tal data Regression
Modeling Regression
values Objective
430 | P a g e
Table 5.1 Delamination Vs feed for speed 47, 53.3, 59.6, 65.9, 72.2 and 78.5 m /min (contd)Ms 47 53.3 59.6 65.9 72.2 78.5
f Df Df Df Df Df Df
0.080 1.0571 1.0625 1.0639 1.0652 1.0658 1.0709
0.088 1.0625 1.0639 1.0671 1.0702 1.0687 1.0722
0.096 1.0653 1.0692 1.0671 1.0734 1.0728 1.0764
0.104 1.0675 1.0730 1.0738 1.0783 1.0790 1.0787
0.112 1.0718 1.0735 1.0790 1.0821 1.0850 1.0849
0.120 1.0772 1.0776 1.0825 1.0835 1.0899 1.0897
Table 5.2 Delamination Vs feed for speed 84.8, 91.1, 97.4, 103.7 and 110 m /min
Ms 84.8 91.1 97.4 103.7 110
f Df Df Df Df Df
0.040 1.0566 1.0606 1.0611 1.0661 1.0653
0.048 1.0615 1.0620 1.0650 1.0660 1.0691
0.056 1.0618 1.0639 1.0655 1.0713 1.0703
0.064 1.0640 1.0701 1.0721 1.0738 1.0734
0.072 1.0687 1.0709 1.0736 1.0781 1.0791
0.080 1.0712 1.0766 1.0752 1.0773 1.0813
0.088 1.0745 1.0792 1.0831 1.0855 1.0844
0.096 1.0776 1.0815 1.0875 1.0857 1.0890
0.104 1.0846 1.0866 1.0904 1.0911 1.0945
0.112 1.0898 1.0935 1.0961 1.0965 1.0988
0.120 1.0945 1.0952 1.0983 1.1039 1.1043
Optimum value of delamination is 1.0459 which obtained for the speed 47 m / min and feed 0.040 mm /rev
0.12 0.11 0.10 0.09 0.08 0.07 0.06 0.05 0.04 0.03 1.080 1.075 1.070 1.065 1.060 1.055 1.050 1.045
Feed mm / rev
D e la m in at io n F ac to r
Scatterplot of Df vs f of Speed 47 m / min
0.12 0.11 0.10 0.09 0.08 0.07 0.06 0.05 0.04 0.03 1.080 1.075 1.070 1.065 1.060 1.055 1.050
Feed mm / rev.
D e la m in at io n F ac to r
Scatterplot of Df vs f of Speed 53.3 m / min
431 | P a g e
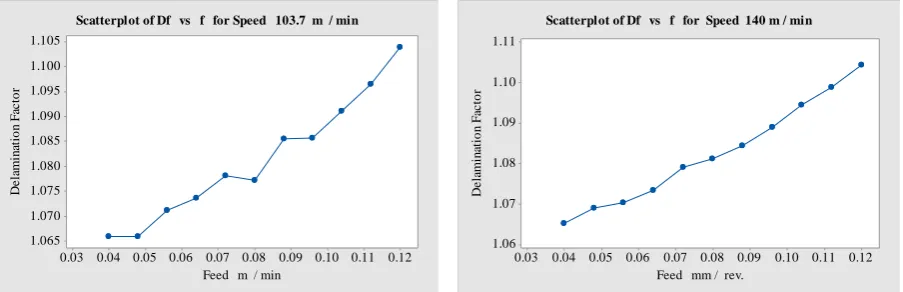
combination. Scatter plots for the framed intervals of feed Vs Delamination for the speed intervals aregraphically presented in Figure 5.3 to Figure 5.6.
0.12 0.11 0.10 0.09 0.08 0.07 0.06 0.05 0.04 0.03 1.085 1.080 1.075 1.070 1.065 1.060 1.055 1.050
Feed mm / rev.
D e la m in at io n F ac to r
Scatterplot of Df vs Feed for Speed 59.6 m / min
0.12 0.11 0.10 0.09 0.08 0.07 0.06 0.05 0.04 0.03 1.085 1.080 1.075 1.070 1.065 1.060 1.055
Feed mm / rev.
D e la m in at io n F ac to r
Scatterplot of Df vs f for Speed 72.2 m / min
Figure 5.4 Delamination effect Vs feed for the speed 59.6, 72.2 m / min
0.12 0.11 0.10 0.09 0.08 0.07 0.06 0.05 0.04 0.03 1.09 1.08 1.07 1.06 1.05
Feed mm / rev.
D e la m in at io n F ac to r
Scatterplot of Df vs f for Speed 78.5 m / min
0.12 0.11 0.10 0.09 0.08 0.07 0.06 0.05 0.04 0.03 1.10 1.09 1.08 1.07 1.06
Feed mm / rev.
D e la m in at io n F ac to r
Scatterplot of Df vs f for Speed 84.8 m / min.
Figure 5.5 Delamination effect Vs feed for the speed 78.5, 84.8 m / min
0.12 0.11 0.10 0.09 0.08 0.07 0.06 0.05 0.04 0.03 1.105 1.100 1.095 1.090 1.085 1.080 1.075 1.070 1.065
Feed m / min
D e la m in at io n F ac to r
Scatterplot of Df vs f for Speed 103.7 m / min
0.12 0.11 0.10 0.09 0.08 0.07 0.06 0.05 0.04 0.03 1.11 1.10 1.09 1.08 1.07 1.06
Feed mm / rev.
D e la m in at io n F ac to r
Scatterplot of Df vs f for Speed 140 m / min
Figure 5.6 Delamination effect Vs feed for the speed 103.7, 110 m / min
VI. RESULTS AND CONCLUSION
432 | P a g e
For optimizing the parameters Tabu Search Algorithm and Genetic algorithm were employed in MATLAB
platform.
Optimum value of delamination is 1.0459 which obtained for the speed 47 m / min and feed 0.040 mm /rev
combination.
Through performing the best subset regression analysis the parameter feed is highly influencing on
delamination followed by the speed. Tool feed is the most influencing input cutting parameter than the
speed.
Tabu search algorithm with regression relationship equation as fitness function converges with the
minimum MSE value of 0.00883. The proposed algorithm may be employed for optimising the machining
parameters.
The plotted graphs give guidelines to the processing Engineers to locate the combination of speed and feed
rate based on the quality requirement on the end product.
REFERENCES
[1] Xin Wang, J.P. Tao., 2004, Investigation on thrust in vibration drilling of fiber-reinforced plastics, Journal of Material Processing Technology, vol. 148, pp. 239-244.
[2] Tsao. C.C., 2009, Grey - Taguchi method to optimize the milling parameters of aluminum alloy, Int. J. Adv. Mfg. Tech, vol.40, pp.41- 48.
[3] Paulo Davim, J., Pedro Reis., Conceicao Antonio, C., 2004, A study on milling of glass fiber reinforced plastics manufactured by hand-lay up using statistical analysis (ANOVA), Composite Structures, vol. 64,
pp. 493-500.
[4] Wang, Z. H., Yuan, J. T., Hu, X. Q., & Dengn, W., 2009, Surface roughness prediction and cutting parameters optimization in high-speed milling AlMn1Cu using regression and genetic algorithm,
International Conference on Measuring Technology and Mechatronics Automation , vol. 3, pp. 334–337.
[5] Pathak, J.P., Singh, J.K., Mohan, S., 2006, Sythensis and characterization of aluminium silicon carbide composite. Indian Journal of Engineering & Material Science, vol. 13, no. 3, p. 238-246.
[6] Neelima Devi, C., Mahesh, V., Selvaraj, N., 2011, Mechanical characterization of aluminium silicon carbide composite. International Journal of Applied Engineering Research, vol. 1, no. 4, p. 793-799.
[7] Palanikumar, K., Karthikeyan, R., 2007, Assessment of factors influencing surface roughness on the machining of Al/ SiC particulate composites, Materials and Design, vol. 28, no. 5, p. 1584-1591.
[8] Dabade, U.V., Joshi, S.S., Balasubramaniam, R., Bhanuprasad, V.V., 2007, Surface finish and integrity of machined surfaces on Al/SiCp composites. Journal of Materials Processing Technology, vol. 192-193, pp.
166-174.
[9] Hou, Chi-Hung Su,Wang-Lin Liu, 2007, Parameters optimization of a nano-particle wet milling process using the Taguchi method, response surface method and genetic algorithm, Powder Tech., vol. 173, pp.
153–162.
433 | P a g e
[11] Julie Zhang, Z., Joseph Chenb, C., Daniel Kirby, E., 2007, Surface roughness optimization in an end-milling operation using the Taguchi design method. Journal of Materials Processing Technology, vol. 184,
pp. 233–239.
[12] Adeel Suhail, H., Ismail, N., Wong, S.V., Abdul Jalil, N.A., 2010, Optimisation of cutting parameters based on surface roughness and assistance of workpiece surface temperature in turning process, American
Journal of Engineering and Applied Sciences, vol. 3, pp. 102-108.
[13] Emel Kuram & Babur Ozcelik, 2013, Multi-objective optimization using Taguchi based grey relational analysis for micro-milling of Al 7075 material with ball nose end mill, Measurement, vol. 46, pp.