Article
Application of a Composite Model in the Analysis of
Creep Deformation at Low and Intermediate
Temperatures
Xinjun Yang 1*, Xiang Ling 21 Jiangsu Key Laboratory of Advanced Food Manufacturing Equipment & Technology, School of Mechanical Engineering, Jiangnan University, Wuxi, 214122, Jiangsu, China; [email protected]
2 Jiangsu Key Laboratory of Process Enhancement and New Energy Equipment Technology, School of Mechanical and Power Engineering, Nanjing Tech University, Nanjing, 211816, Jiangsu, China; [email protected]
* Correspondence: [email protected]; Tel.: +051085910390
Abstract: The creep behaviors of TA2 and R60702 at low and intermediate temperature were presented and discussed in this paper. Experimental results indicated that an apparent threshold stress exhibited in the creep deformation of R60702. Meanwhile, the primary creep phase was found as the main pattern in the room temperature creep behavior of TA2. Compared with exponential law, the power law has been proved to be a proper constitutive model in the description of primary creep phase. It also showed that θ projection method had its significant advantage in the evaluation of accelerated creep stage. Thus, a composite model which combined power law with θ projection method was applied in the creep curves evaluation at low and intermediate temperature. Based on the multiaxial creep deformation results, the model was modified and discussed. A linear relationship existed between composite model parameters and applied load. Finally, the creep life could be accurately predicted and the composite model method is suitable for application in low and intermediate temperature creep life analysis.
Keywords: Creep; Composite constitutive model; θ projection method; low and intermediate temperature
1. Introduction
High temperature failure, due to creep, fatigue and fracture, is a nonnegligible issue in the safety production of modern industry [1]. During the past few decades, a significant amount of research efforts have been done to estimate the high temperature strength of structure component [2]. With the deepening of the study, microstructure evolution, creep damage and constitutive model are gradually discussed and presented in the high temperature steels analysis [3-5]. Finally, a relatively compact framework system for evaluating the high temperature creep properties was established.
Nowadays, a wide variety of metals such as Ti ,Cu and Zr alloys, have been applied in the design of key component, due to their outstanding corrosion resistance, high strength-to-weight ratio and machine deforming character [6]. Different from conventional metallic materials, evident creep deformation of these materials may take place at low and intermediate temperatures. How to describe the low temperature creep characteristics accurately and effectively has attracted more and more attention in the past decade. Kassner et al. presented the significant creep plasticity of 304 stainless steel and proved that the room temperature creep is partially attributed to the high strain-rate sensitivity of material [7]. Peng et al. investigated the primary creep constitutive model of CP-Ti and introduced a partition method in order to analyze the deformation at different stresses and temperatures [8]. With the purpose of evaluating the relaxation mechanism of Zn specimens, Matsunaga et al. analyzed the role of grain boundary and discussed its influence on the low
temperature creep [9]. In addition to creep deformation character, activation energy was also extensively evaluated and proved to be a variate with the increase of temperature [10].
It can be found that creep deformation mechanism and micro damage evolution is the main focus of previous researches. However, low temperature constitutive model, which has guiding significance for the safety design, has not caused widespread attention. How to describe the deformation curve at low and intermediate temperatures accurately, in order to realize the accurate life extrapolation, is still a practical problem need to be solved.
In this paper, the creep characters of TA2 and R60702 were investigated under different stresses and temperatures. According to the creep evolution feature, the primary creep phase and threshold stress were found and discussed. Then, a composite model was introduced and modified, which can be widely used in the creep deformation analysis at the low temperature. Finally, the composite model was used to analysis the low temperature creep behavior of materials under multiaxial deformation states successfully.
2. Experiment
TA2 and R60702 analyzed in this paper were widely used materials in aerospace, transport and petrochemical field. The chemical composition of R60702 is Zr+Hf≥99.2, Hf≤4.5, 0.2Fe+Cr, 0.16O, 0.005H, 0.025N, 0.05C. The chemical composition of TA2 is 0.12Fe, 0.01C, 0.03N, 0.14O, balance Ti. Prior to the experiment, uniaxial creep specimens were wire-electrode cutting and polished to avoid the influence of surface defect. Then, Rectangular cross sections creep specimens with 10 mm in width and 3 mm in depth were obtained and used. According to the service conditions, two temperature conditions (293K and 473K) were selected. Three groups of thermocouple were placed near specimens and the error was controlled in ±1K in order to ensure the accuracy of creep temperature. Finally, the tensile creep tests were accomplished and the creep strain was real-time measured by two extensometers.
3. Results and discussion
3.1 Creep characters
At the room temperature, typical primary creep stages were observed in the creep strain - time curves of TA2 as shown in Figure 1. Comparing with the results at different stresses, the profiles are similar and the creep strain rate decreases with the increase of deformation at 293K. It should be noted that the primary creep behavior lasted more than 2500 hours when the stress is 300MPa. It means that there is no clear steady creep stage in the room temperature creep of TA2 when the stress varies from 240MPa to 330MPa. Meanwhile, a large number of deformation twins were found in the deformation region. The twinning deformation is an important factor for the deformation of TA2. It has been proved that, besides dislocation slip, the low temperature creep of HCP (hexagonal close packed) material is also correlated with twinning deformation [11]. The stress to activate the dislocation slip is temperature dependent. While, the stress to activate twinning deformation is temperature independent, and high stress is acquired to activate the twinning deformation mechanism [8]. All these indicate that the mechanism of low temperature creep cannot be equivalent to that of high temperature creep although the primary creep stage is similar.
0 100 200 300 400 500 600 0
1 2 3 4 5 6 7
St
rain(
%
)
Time(h)
330MPa 300MPa 270MPa 240MPa
Figure 1. The creep strain - time curves of TA2 at room temperature
0 200 400 600 800 1000 1200
0 4 8 12 16 20 24 28 32
Str
ain
(%
)
Time(h)
180MPa 162MPa 145MPa 130MPa 100MPa
Figure 2. The creep strain – time curves of R60702 at 473K
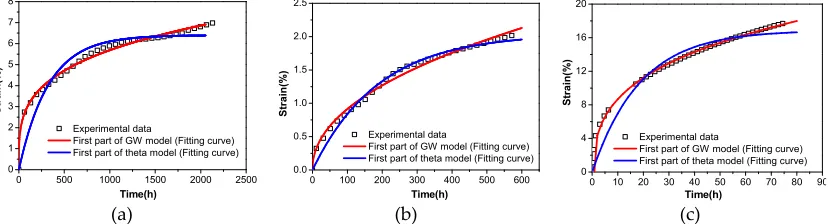
3.2 Description of primary creep phase
In the traditional creep analysis, the basic deformation stages of creep curves are well known: primary creep stage, steady creep stage and accelerated creep stage [12]. However, particular creep deformation character is found at low and intermediate temperature in the previous section. Except slip of dislocation, twinning deformation induced by high stress plays an important role in the creep damage. Especially in the analysis of TA2, only primary creep stage is presented in our creep conditions. Thus, how to describe the constitutive model and deformation feature of primary creep stage is the issue need to be discussed in this paper.
In the traditional high temperature creep deformation study, several models and modifications have been reported to predict the creep behavior. The most known are the Norton model, the Graham-Walles model and the theta model [13-15]. It can be found that the first part of Graham-Walles model is defined as the power law. Meanwhile, the first part of theta model is similar to exponential law as listed below:
1
0 1
c
b t
ε ε
= +
(1)0
b
2[1 exp(
c t
2)]
ε ε
= +
−
−
(2) Where ε is the total strain, ε0 is the initial elastic-plastic strain, t is the creep time, b1, b2, c1 and c2are the material parameters
In terms of engineering assessment requirement, simple form of power law is another important advantage in the deformation analysis. Thus, the power law can be defined as the foundation of low temperature model in order to estimate primary creep behavior accurately.
0 500 1000 1500 2000 2500
0 1 2 3 4 5 6 7 8 Str ain(% ) Time(h) Experimental data
First part of GW model (Fitting curve) First part of theta model (Fitting curve)
(a)
0 100 200 300 400 500 600 0.0 0.5 1.0 1.5 2.0 2.5 Experimental data
First part of GW model (Fitting curve) First part of theta model (Fitting curve)
St ra in (% ) Time(h) (b)
0 10 20 30 40 50 60 70 80 90 0 4 8 12 16 20 Stra in( % ) Time(h) Experimental data
First part of GW model (Fitting curve) First part of theta model (Fitting curve)
(c)
Figure 3. Analysis of primary creep phase: (a) TA2 at 300MPa; (b) TA2 at 270MPa; (c) R60702 at 145MPa
3.3 The composite model analysis
In the previous section, the primary creep model has been discussed and described reasonably. However, most failures of creep take place at the accelerated creep stage in practice engineering. With the increase of strain, the micro-damage and thickness reduction can be perceived in this stage along with the increase of creep strain rate. Thus, more and more constitutive models were proposed to evaluate the accelerated creep stage under different conditions.
As a widely used creep model, θ projection method believes that creep curve contains vast information which can be presented by the function of temperature and stress:
2 4
0 1
(1
)
3(
1)
t t
e
θe
θε ε θ
= +
−
−+
θ
−
(3)
where ε is the creep strain at deformation time t, ε0 is the instantaneous deformation, θ1, θ2, θ3 and
θ4 are material parameters.
With the future development, the focus of research was presented in the steady and accelerated creep stages and a more simplified form which ignored the first creep stage was presented:
4
0 1 3
(
1)
t
t
e
θε ε θ θ
= + +
−
(4) According to the simple form, more and more researches used this model to estimate deformation process. The predicted precision was gradually proved, especially in the third creep stage [16]. Jiang et al. [17] combined the third part of theta model and the first part of G-W model in the prediction of heat resistant steel as shown in equation (5):4
0 3
(
1)
t B
At
e
θε ε
= +
+
θ
−
(5) Meanwhile, the minimum creep strain rate can be defined as:4 1
3 4 m
t B
m
ABt
me
θε
=
−+
θ θ
(6)
Where the tmis the time that reaches the minimum creep strain rate, which can be defined as
follows:
2 2
3 4 4
(
1)
Bexp(
) 0
m m
AB B
−
t
−+
θ θ
θ
t
=
(7)
Based on the previous discussion, it can be found that θ projection method has its apparent advantage in the evaluation of accelerated creep stage. Meanwhile, the power law can be used in the prediction of primary creep stage at low and intermediate temperature environment. Thus, the composite model is also applied in this paper in order to estimate low and intermediate temperature creep deformation.
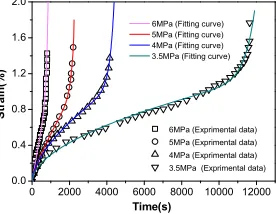
On the other hand, it should be noted that required stress of dislocation slip would be affected by the temperature. Deformation induced by slip of dislocation is easier to happen as the temperature becomes higher. Consequently, to evaluate the applicability of composite model at intermediate temperature, the results of low-temperature sintered nano-silver lap shear joints at 600K [18] are also introduced. Different from the traditional creep analysis, the creep behavior of nano-silver sintered lap shear joints will happen in a shorter time, which is sensitive to the stress and temperature. In spite of the fact that the creep character is diverse, the model has also been applied to estimate creep behavior of nano-silver sintered lap shear joints successfully as shown in Figure 5. It proves that the suitability of composite model will not be affected by the creep deformation mechanism.
Since the focus of creep deformation analysis is to avoid the failure in the actual engineering assessment, how to establish the relationship between model parameters and experiment condition is another main issue needed to be discussed. The analyzed results of A, B, θ3 and θ4 are plotted in
Figure 6. It is well known that there exists a linear relationship between the theta parameters and applied stress in the θ projection method [19]. A similar analysis is also completed here, which indicates that a similar linear relationship can also be found between the composite model parameters and applied stress as follows:
3 4
lg( )
m
= +
a b
σ
(
m A B
=
, , , )
θ θ
(8) Where a and b are material constants.0 25 50 75 100 125 150 175 200 225 0
5 10 15 20 25 30 35
145MPa (Experimental data ) 162MPa (Experimental data ) 180MPa (Experimental data)
St
ra
in
(%
)
Time(h)
145 MPa (Fitting curve) 162 MPa (Fitting curve) 180 MPa (Fitting curve)
Figure 4. Fitting results of composite creep model for R60702 at 473K
0 2000 4000 6000 8000 10000 12000 0.0
0.4 0.8 1.2 1.6 2.0
6MPa (Exprimental data) 5MPa (Exprimental data) 4MPa (Exprimental data) 3.5MPa (Exprimental data)
St
rain
(%
)
Time(s)
6MPa (Fitting curve) 5MPa (Fitting curve) 4MPa (Fitting curve) 3.5MPa (Fitting curve)
Figure 5. Fitting results of composite creep model for nano-silver lap shear joints at 600K
3.5 4.0 4.5 5.0 5.5 6.0
-12 -10 -8 -6 -4 -2 0 2
log(A) log(B) log(θ3)
log(θ4)
log(
A
,
B
,
θ3
,
θ4
)
Figure 6. The relationship between material parameters of composite model and stress
With the increase of stress, the log(A), log(θ3), log(θ4) increase and the log(B) decreases. Thus,
the four parameters under low temperature can be determined and the creep curve can be extrapolated to any temperature and stress [20].
3.4 Multiaxial creep deformation analysis
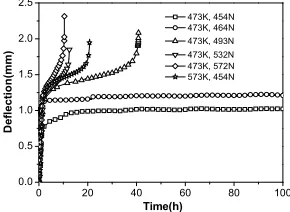
To reveal the deformation and failure character of high temperature creep behavior, conventional uniaxial creep tests are always used in the experimental analysis. However, the deformation and stress state of actual structure is complex and various in the practice engineering. How to describe the multiaxial creep behavior and establish the rational constitutive model gives rise to a new question. In this paper, the creep results of R60702 under multiaxial creep state are obtained by small punch creep tests as shown in Figure 7.
Similar to the uniaxial creep tests results, an obvious threshold stress can be found. Meanwhile, a typical creep deformation curves is obtained when the load is larger than 493N. When the test temperature increases to 573K, the threshold load decreases. And the typical creep failure takes place when the load is 454N. High load leads to a larger deflection which may induce fracture of specimen. So, the percentage of primary creep phase in the whole deformation of high load is apparently larger than that of lower load in this region. The second creep phase would apparently shorten and the creep rate increases with the increase of the load, which is also in accordance with the results in uniaxial creep tests. All these indicate that an approximate equivalent relation can be estimated between the multiaxial creep load and the uniaxial creep stress. Theoretical analysis is shown in Figure 8.
0 20 40 60 80 100
0.0 0.5 1.0 1.5 2.0 2.5
D
efl
ec
tio
n
(m
m
)
Time(h)
473K, 454N 473K, 464N 473K, 493N 473K, 532N 473K, 572N 573K, 454N
Figure 7. The creep deflection – time curves of R60702 at different temperatures and loads
F
h
h0
α r
q
Before deformation
After deformation
Contact boundary of the specimen and the ball
Figure 8. Deformation model of round specimen in the multiaxial deformation status
In the vertical direction, the deformation load F can be described as the function of uniform membrane pressure p [21]:
0
2
cos
Where the r is ball radius, φ is the deformation angle of any point, αis the deformation angle of contact boundary.
The Equation (9) is integrated and then:
2
sin
2F
=
π
r p
a
(10) Meanwhile, the radial stressφ1 and circumferential stressφ2can be described as the function ofmembrane pressure:
1 2
pr
/ 2
h
φ φ
= =
(11) Thus, the equivalent stress is:2 2 2
1 2 2 3 3 1
2
(
)
(
)
(
)
2
mφ
=
φ φ
−
+
φ φ
−
+
φ φ
−
(12)Whereφ3 is the stress along the thickness direction of the specimen, and it is very small compared
withφ1 andφ2, thus
/ 2
m
pr
h
φ
≈
(13) As a result, the equivalent stress can be described as the function of applied load and current thickness. On the other hand, Hyde et al [22] proved that specimen thickness changes with the deformation and can be approximated as:2 0
1
1 1/ tan
h
h
=
+
β
(14)In the composite model, the creep strain can be replaced by the deflection of small punch creep test as discussed by Yang [23]. Meanwhile, an approximate linear relationship between equivalent stress and creep load can be obtained based on the Equation (9), Equation (13) and Equation (14). Thus, the composite model is modified and the parameters can be replaced as listed below:
4
0 3
(
1)
t B
L L
= +
At
+
θ
e
θ−
(15)3 4
lg( )
m
= +
a bF m A B
(
=
, , , )
θ θ
(16) The fitting results are shown in Figure 9 based on Equation (16). The results show that the composite model can be used in the analysis of multiaxial creep deformation. According to the thin specimen, a shorter creep second phase exists in the small punch creep test. Thus, the modified composite model can predict the deformation behavior more accurately.0 20 40
0.0 0.5 1.0 1.5 2.0 2.5
473K, 493N (Experimental data) 473K, 532N (Experimental data) 473K, 572N (Experimental data) 573K, 454N (Experimental data)
D
e
fl
ec
ti
on
(mm)
Time(h)
473K, 493N (Fitting curve) 473K, 532N (Fitting curve) 473K, 572N (Fitting curve) 573K, 454N (Fitting curve)
Figure 9. Fitting results of composite creep model for multiaxial creep results of R60702
4. Conclusions
In this paper, the creep behaviors of TA2 and R60702 at different stresses and temperatures were analyzed. The low and intermediate temperature creep characters were discussed and a composite model was applied in the prediction. Some important conclusions have been obtained as follows:
and intermediate temperature was different from that of high temperature creep deformation. The reason may due to the twinning deformation induced by high stress.
2. Two constitutive models were introduced and compared. It proved that the power law could be used as a proper constitutive model in the description of primary creep phase at low and intermediate temperature.
3. Based on the power law and θ projection method, a composite model was applied in the creep curve evaluation at low and intermediate temperatures. A linear relationship was found between model parameters and applied stress. Thus, the creep life can be accurately predicted by composite model in practice engineering.
4. Under multiaxial creep deformation stage, the composite model was modified and proved that it could be used to predict the creep behavior accurately.
Acknowledgments: The authors wish to acknowledge the financial support provided by the Natural Science Foundation of China (Grant No. 51505189), Open Project of Jiangsu Key Laboratory of Advanced Food Manufacturing Equipment & Technology (FM-2015-05).
Author Contributions: Xinjun Yang and Xiang Ling conceived, designed and performed the experiments; Xinjun Yang and Xing Ling analyzed the data; Xinjun Yang wrote the paper.
Conflicts of Interest: The authors declare no conflict of interest. The founding sponsors had no role in the design of the study; in the collection, analyses, or interpretation of data; in the writing of the manuscript, and in the decision to publish the results.
References
1. Warren A.D.; Griffiths I.J.; Harniman R.L.; Flewitt P.E.J.; Scott T.B. The role of ferrite in Type 316H austenitic stainless steels on the susceptibility to creep cavitation. Mat. Sci. Engi. A2015, 635, 59-69. 2. Dyson C.C.; Sun W.; Hyde C.J.; Brett S.J.; Hyde T.H. Use of small specimen creep data in component life
management: a review. Mater. Sci. Tech. 2016, 32, 1567-1581.
3. Borjali S.; Allahkaram S.R.; Khosravi H. Effects of working temperature and carbon diffusion on the microstructure of high pressure heat-resistant stainless steel tubes used in pyrolysis furnaces during service condition. Mater. Design2012, 34, 65-73.
4. Kwon O.; Thomas C.W.; Knowles D. Multiaxial stress rupture behaviour and stress-state sensitivity of creep damage distribution in Durehete 1055 and 2.25 Cr1Mo steel. Int. J. Pres. Ves. Pip.2004, 81, 535-542. 5. Anderson P.; Bellgardt T.; Jones F.L. Creep deformation in a modified 9Cr-1 Mo steel. Mater. Sci. Tech.
2003, 19, 207-213.
6. Jiang X.J.; Zhou Y.K.; Feng Z.H.; Xia C.Q. Tan C.L.; Liang S.X.; Zhang X.Y.; Ma M.Z.; Liu R.P. Influence of Zr content on β-phase stability in α-type Ti–Al alloys. Mat. Sci. Engi. A2015, 639, 407-411.
7. Kassner M.E.; Geantil P. Ambient temperature creep of type 304 stainless steel. J. Eng. Mater. Tech. 2011, 133, 1-5.
8. Peng J.; Zhou C.Y.; Dai Q.; He X.H. The temperature and stress dependent primary creep of CP-Ti at low and intermediate temperature. Mat. Sci. Engi. A2014, 611, 123-135.
9. Matsunaga T.; Takahashi K.; Kameyama T.; Sato E. Relaxation mechanisms at grain boundaries for ambient-temperature creep of h.c.p. metals. Mat. Sci. Engi. A2009, 510-511, 356-358.
10. Tanaka H.; Yamada T.; Sato E.; Jimbo I. Distinguishing the ambient-temperature creep region in a deformation mechanism map of annealed CP-Ti. Scripta Mater.2006, 54, 121-124.
11. Kameyama T.; Matsunaga T.; Sato E.; Kuribayashi K. Suppression of ambient-temperature creep in CP-Ti by cold-rolling. Mat. Sci. Engi. A2009, 510-511, 364-367.
12. Laha K.; Rao K.B.S.; Mannan S.L. Creep behavior of post-weld heat treated 2.25Cr1Mo ferritic steel base, weld metal and weldments. Mat. Sci. Engi. A 1990, 129, 183-195.
13. Graham A.; Walles K.F.A. Relationships between long and short-time creep and tensile properties of a commercial alloy. Tetsu To Hagane 1955, 179, 105-120.
Creep and Fracture of Engineering Materials and Structures, Swansea, UK, 24–27 March, 1981; Pineridge Press: Swansea, UK, 1982, 135–184.
15. Evans R.W. A constitutive model for the high-temperature creep of particle-hardened alloys based on the
θ projection method. P. Roy. Soc. London A, 2000, 456, 835–868.
16. Zhao Y.P; Gong J.M; Yong J.; Wang X.W; Shen L.M; Li Q.N. Creep behaviours of Cr25Ni35Nb and Cr35Ni45Nb alloys predicted by modified theta method. Mat. Sci. Engi. A2016, 649, 1-8.
17. Jiang F.; Li P.; Cheng C.Q.; Liu C.H.; Zhao J. Comparative analysis of creep behavior prediction of heat resistant steel based on theta projection and composite model. J. Mater. Eng. 2015, 43, 87-92.(in Chinese )
18. Li X.; Chen G.; Wang L.; Mei Y.H.; Chen X.; Lu G.Q. Creep properties of low-temperature sintered nano-silver lap shear joints. Mat. Sci. Engi. A2013, 579,108-113.
19. Law M.; Payten W.; Snowden K. Finite element analysis of creep using Theta project data. Int. J. Pres. Ves. Pip.1998, 75, 437-442.
20. Kim W.G.; Kim S.H.; Lee C.B. Long-Term Creep Characterization of Gr. 91 Steel by Modified Creep Constitutive Equations. Met. Mater. Int. 2011, 17, 497-504.
21. Yang Z.; Wang Z. Research on small punch creep test-analysis of creep stress. J. Press. Vess. Tech. 2002, 19, 5-8. (in Chinese)
22. Hyde T.H.; Stoyanov M.; Sun W.; Hyde C.J. On the interpretation of results from small punch creep tests. J. Strain Anal. Eng.2010, 45, 141-164.