A METHOD FOR COLOR IMAGE
SEGMENTATION USING LOCAL
FEATURES
K.Venkata Subbaiah
Research Scholar, Rayalaseema University, Kurnool, AP, India Assoc. Prof. in Dept. of CSE,
PBR Visvodaya Institute of Technology & Science, Kavali, A.P., India E-Mail: [email protected]
V. Vijaya Kumar
Professor, Dean and Director for CACR
Anurag Group of Institutions (Autonomous), Hyderabad, Telangana, India E-Mail: [email protected]
Abstract:
One of the essential tasks in a wide variety of applications and image processing domains is the need of automatic color segmentation. The aim of color image segmentation is to extract significant features of image, thus understanding, interpretation, description, analysis of the image scene becomes easy. The present paper attempted this by deriving an efficient and simple color segmentation approach. The proposed segmentation approach initially extracts the red, green and blue color components separately. On each color component the present paper computes the fundamental texture units that represent edges, flat regions, corners, spots and other significant local attributes by reducing the dimensionality and by achieving rotational invariance. To fill the narrow gaps in between adjacent edges, corners morphological operation is performed. K-means clustering is performed to segment the local regions of individual color components more significantly. Finally the color components are concatenated to generate the final color segmented textures. The quality measures are applied to test the efficacy of the proposed method. The proposed method is implemented on Wang, Oxford flower, MIT-VisTex databases and compared with state-of-art of the existing methods.
Keywords: Segmentation, K-means, edge, corner, morphology. 1. Introduction
proposed in the literature and they successively adopted fine-to-coarse pixel aggregation for improving segmentation quality [9-11]. The only disadvantage of these methods is they entail tremendous computational complexity. The histogram-based methods are simple, efficient, reduce the computational complexity and they are basically pixel-based approaches and that’s why they are adopted to segmentation process [12–17]. One of the famous histogram-based methods is Otsu’s method [12].
Some researchers examined relatively large blocks of the image for segmentation. The major issue here is usually a large block is unlikely to be entirely contained in a homogeneously textured region and it becomes difficult to correctly determine the boundaries between regions. To address this present paper used a local based approach that derives effectively the local features. However one of the most crucial factors for successful texture segmentation is how to choose highly discriminating local texture features in the presence of noise. The major problem in dealing with local information is a small noise may drastically influence the overall performance of the segmentation or classification system. LBP is a popular tool used to capture local primitives of an image texture precisely and good texture discrimination can be obtained with LBP. The LBP or grey-scale difference operator with statistical measures shown higher performance rates than the existing methods [18, 19]. The LBP, ULBP and other variants of LBP drastically suffers with small noise. The present paper addresses this by transforming the noisy NULBPs into ULBPS. Texture segmentation methods based on pipeline implementation [20] and combination of statistical and morphological operations are also proposed in the literature [21, 22, 23]. Recently segmentation methods to extracts objects from background [24, 25, 26] are also proposed in the literature.
Noise in the image is random change of color information or intensity and usually an aspect of noise is due to electronic parts. It can be originated because of the scanner circuit and sensor or digital camera. Also noise in image can start in ideal photon detector and film grain. Noise in image is an unwanted consequence of image acquisition that adds extraneous and spurious information. The digital images affected with random noise specifically have Gaussian or normal distribution. The magnitude of the error is independent of the entire signal. Because of Gaussian noise in the image, light and dark regions are affected to the equal extent. Another name of Gaussian noise is additive noise as the noisy image is equal to adding of noise having Gaussian probability distribution to the original image. Impulse or salt and pepper noise visually appear as random distribution of black and white pixels in an image. The origins of impulse noise are flaws in sensor components, flaws in storage devices, noise affecting image reconstruction and data transmission. Noise factor affects a lot in accurate, proper and critical segmentation process. Noise may lead to connected regions, edges and boundaries as non-connected, and also vice-versa and also sometimes leads to over segmentation. Any unwanted further splitting of uniform regions is called over segmentation.
The rest of paper is organized as follows. The section 2 describes the related work and the section 3 describes the proposed methodology. The section 4 and 5 describes the results - discussions and conclusions respectively.
2. Local Binary Pattern (LBP)
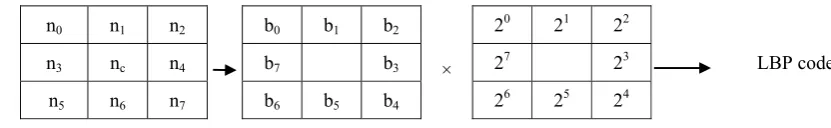
The basic local binary pattern (LBP) is derived on a 3 x 3 neighborhood and it is also represented as (P, R) as (8, 1), where P represent the number of neighboring pixels and R represents the radius of the window. Later, the LBP are derived on (8, 2), (16, 1) and (16, 2). The neighboring pixels of a 3 x 3 window are denoted in the present paper as {nc, n0, n1… n7}, where nc and n0, n1… n7 represents the intensity values of the centre and neighboring pixel. The process of formation of LBP code is shown in the Fig. 1.
n0 n1 n2 b0 b1 b2 20 21 22
n3 nc n4 b7 b3 × 27 23 LBP code
n5 n6 n7 b6 b5 b4 26 25 24
The process of LBP code evaluation is a two-step process. In step one the gray level value of the centre pixel is compared with the neighboring pixels gray level value and based on their sign of grey level value difference the neighboring pixels are allotted to a binary value by the Eqn.1. In step two the LBP code (LBPc) is derived by multiplying the binary values of the neighboring pixels by the binomial weights and these values are summed to generate LBP code for the neighborhood as, given in equation 2. The centre pixel value will be replaced with the LBP code. LBP is invariant to any monotonic grey-scale transformation and it illustrates the spatial structure of the local texture efficiently.
b = S P − P S(x) ≥ 0 then S(x) =1 otherwise S(x) =0 (1)
= ∑ ∗ 2 (2)
Where Pc, Pi represents the gray values of centre pixel and neighborhood pixel i, bi represents the binary value of the corresponding neighboring pixel. LBPc represents the LBP code for the 3x3 and it ranges from 0 to 255 or 28-1.The transformation process of LBP
c is also shown in the Fig.2. Based on Eqn.2 the LBPc for Fig.2 (a) is 69.
73 35 55 1 0 1 20 21 22
22 40 25 0 0 27 23 69
57 20 11 1 0 0 26 25 24
(a) The 3x3
neighborhood of the image
(b) Generation of binary patterns based on Eqn. 1
1(c) Corresponding weights
1(d) LBP code Fig.2: Transformation of LBP code from a gray level image neighborhood.
The basic advantages of LBP are
1) The exact intensities are discarded, and only the relative intensities with respect to the center are preserved. Thus, LBP is less sensitive to illumination variations.
2) By extracting the histogram of micro-patterns in a patch, the exact location information is discarded, and only the patch-wise location information is preserved. Thus, LBP is robust to alignment error.
3) LBP features can be extracted efficiently, with less complexity which enables real-time image analysis. 4) LBP’s are invariant to monotonic grey level transformation means they are resistant to lighting or brightening effects.
The basic disadvantages of LBP are
1) LBP is sensitive to noise. A small noise may convert a homogeneous neighborhood into non-homogeneous. This limits its performance.
2) The reliability of LBP decreases significantly under large illumination variations. Complex local interactions may happen whenever there is a lighting effect. This results the violation of basic LBP assumption that gray-level changes monotonically.
3) The other disadvantage of the basic LBP is it is sensitivity to random and quantization noise in uniform and near-uniform image regions such as the forehead and cheeks.
2.1 Representation of Local Binary Pattern Weights
2
22
32
42
12
22
32
02
12
22
72
02
12
52
62
42
52
72
32
62
22
72
02
12
62
72
02
62
52
42
52
42
3(a) (b) (i) (j)
20 21 22 27 20 21 26 27 20 25 26 27
23 24 22 23 25 21 24 20
25 26 27 24 25 26 24 23 22 23 22 21
(c) (d) (k) (l)
26 27 20 25 26 27 24 25 26 23 24 25
21 22 20 21 23 27 22 26
23 24 25 22 23 24 22 21 20 21 20 27
(e) (f) (m) (n)
24 25 26 23 24 25 22 23 24 21 22 23
27 20 26 27 21 25 20 24
21 22 23 20 21 22 20 27 26 27 26 25
(g) (h) (o) (p)
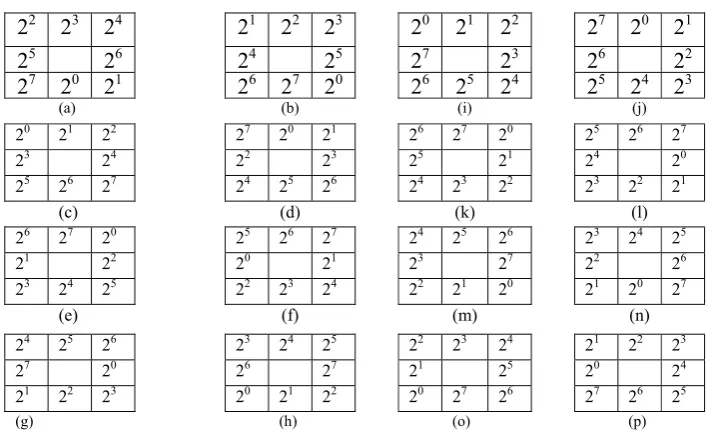
Fig. 3: Representation of basic LBP operator weights in different ways on a 3 x 3 neighborhood. The LBP measure or weight changes by the representation of the corresponding weights. The eight corresponding LBP measures for the figure Fig. 2.1(a) by using the different corresponding weights of the Fig. 2(a) are 148, 74, 37, 146, 73, 82, 41, 69, 162, 81, 168, 84, 42, 21 and 138 respectively.
2.2 Circular Bitwise Transitions on Local Binary Pattern
The histogram methods based on entire LBP is a complex task and LBP codes are not rotationally invariant. To overcome the dimensionality and rotational invariance problem uniform local binary pattern (ULBP) and non-uniform local binary pattern (NULBP) are introduced in the literature [27] . The range of LBP codes will be increased drastically if one increases the number of neighboring pixels (P) from 8 to 16 or 24 over a radius R. A LBP is defined as ULBP if it contains zero or two transitions from 0 to 1 or 1 to 0 in a circular manner. For example the binary code (00001111) will have exactly two transitions from 0 to 1 or 1 to 0 in a circular manner. A LBP with (P, R) where P=8 and R=1 (on a 3 x 3 neighborhood)will have P * (P-1) + 2 = 58 ULBPs out of 2P LBP measures. The present paper established, the advantage of considering ULBP’s because it retains the basic fundamental properties of the image, which is very useful for segmentation, analysis, recognition etc. In the literature [27, 28] it has been proved that most of the textures contains 85% to 95% or even more of the windows as ULBP and it is clarified that one need not necessary to count NULBPs for any classification purpose and can treat all NULBPs as miscellaneous. That is the reason ULBPS are treated as fundamental units of texture. While mapping a LBP image into ULBP image, a separate and unique code is used for each ULBP and all non-uniform patterns are accumulated with a single code and treating them as miscellaneous. The larger the uniformity value U is, the more likely is that spatial transition occurs in the local pattern. Thus considering only ULBP’s reduces overall dimensionality. That’s why ULBP’s are statistically more significant and there is need to estimate more reliably and accurately the occurrence probabilities of ULBPs. In contrast NULBP’s are statistically in significant and they occupy only small portion. In the literature the non-uniform patterns are grouped into one label to suppress noise and by this number of patterns are reduced considerably.
3. Proposed Color Segmentation Scheme
obtain a precise segmentation. The block diagram of the proposed segmentation approach is represented in the Fig. 5. On each color component the present paper derived fundamental units of texture by computing uniform local binary pattern (ULBP).
25/11/2009 8 39 87 15 32 22 13 25 15 37 26 6 9 28 16 10 10 39 65 65 54 42 47 54 21 67 96 54 32 43 56 70 65 99 87 65 32 92 43 85 85 67 96 90 60 78 56 70 99
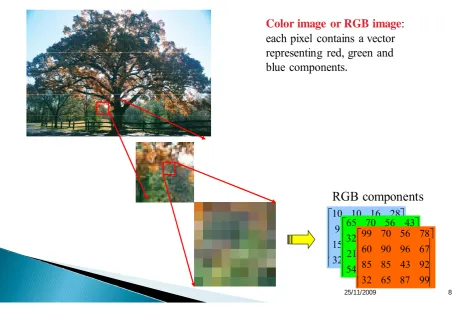
Digital Image Types : RGB Image
Color image or RGB image
:
each pixel contains a vector
representing red, green and
blue components
.
RGB components
Fig.5: Block diagram of proposed segmentation methodology.
Color texture
image
Red component of
texture
Green component of
texture
Blue component of
texture
Identification of
local edges, spots,
corners
Filing of narrow gaps
in between edges,
spots and corners
Closing
Segmented
red
component
Segmented
green
component
+
Concatenation
Final color
segmented image
Red
Green
Blue
Red
Green
Blue
Red
Green
Blue
The advantages of ULBP over basic LBP are:
1) ULBP are rotationally invariant; for example the LBP of Fig. 2 can produce 16 different LBP codes based on the way the binary weights are assigned. The ULBP approach overcomes this by counting the number of transitions in a circular manner and this mechanism makes ULBP as rotationally invariant.
2) The ULBP overcomes the basic disadvantage of LBP histograms from 256 to 58 i.e. reduces the dimensionality.
3) The ULBPS are more suitable to segmentation, they measure the local edges, spots, lines, curves, boundaries more precisely than the basic LBP.
After deriving ULBPs on each of the color component the present paper computes morphological filling operation in the form of closing to fill the narrow gaps in between local edges, curves boundaries etc… Then in each color component a clustering technique is performed to obtain a precise segmentation. The present paper used K-means clustering on each color component texture image, after morphological filling. In the final stage the three color components after clustering are concatenated to generate the final segmented image.
4 Results and Discussions
The proposed color segmentation method is tested on three large databases namely Wang [29], Oxford flowers [30] and MIT-VisTex [31] databases.
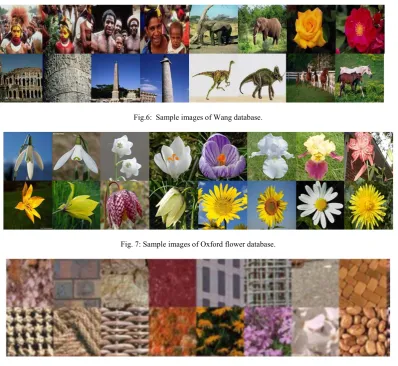
Wang[29]: Wang is a subset of Corel stock photo database of 1000 images. These images are grouped into 10 classes, each class contains 100 images. Within this database, it is known whether any two images are of the same class. Classification of the images in the database into 10 classes makes the evaluation of the system easy. The hefty size of each class and the heterogeneous image class contents made Wang data base as one of the popular database for image retrieval.The present paper considered 7-classes of images and 100 images per each class.
Oxford flower [30]: The Oxford flower database consists of flowers of 17 categories. The flower images are most suitable for segmentation experiments’ because they contain sharp edges with different shapes and different local attributes. In each category there are 80 images. This results to a total of 17 x 80= 1360 images.
MIT-VisTex[31]: All images in the Vision Texture database are stored as raw ppm (P6) files. Currently there are 2 standard sizes for images in VisTex: 512x512, and 128x128. All images in the Reference Texture section and the texture patches from Texture Scenes are available in these sizes. There are 40 classes of textures in MIT-VisTex. In each category there are 16 images. Totally considered 640 texture for segmentation.
Fig.6: Sample images of Wang database.
Fig. 7: Sample images of Oxford flower database.
Fig. 8: Sample images of MIT-VisTex database.
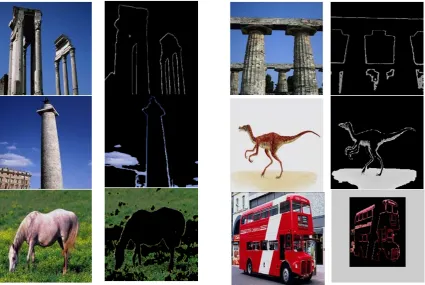
The step wise performance of the proposed color segmentation method is shown in Fig. 9,10 and 11 for the texture databases. The following are noted down from the segmentation metrics derived from the Tables 1 to 4 and Fig. 12 to 15 on the proposed color segmentation and existing methods [25, 32, 33].
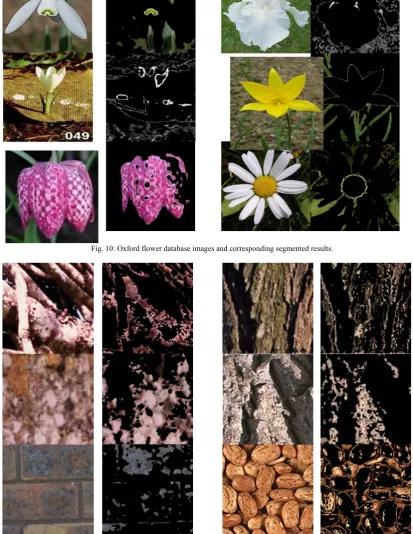
• The proposed method has shown an average discrepancy value (measured on all four database images) of 20.11, which is higher than existing three methods.
• The average entropy value on all considered databases for color segmentation approach is 1.21 indicating a decent segmentation whereas all other existing methods has shown an entropy value of more than 2 indicating to over segmentation.
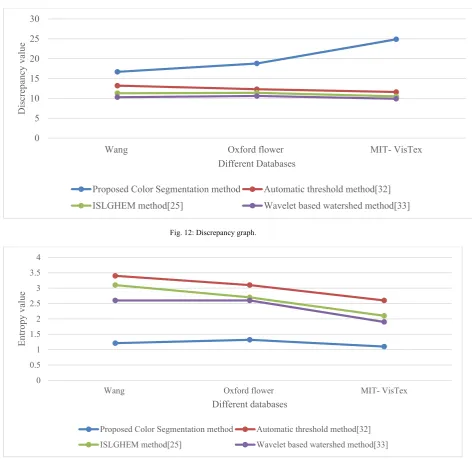
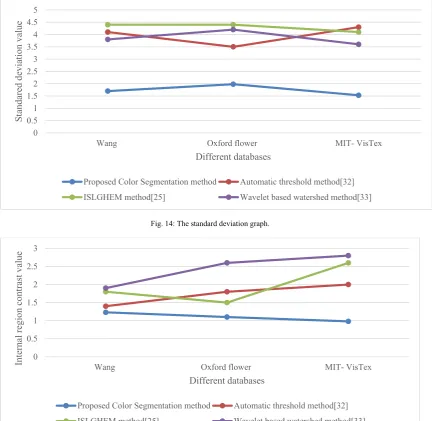
• The proposed color segmentation approach has shown an average standard deviation value of 1.74 and whereas all other segmentation methods have shown a value around 4.
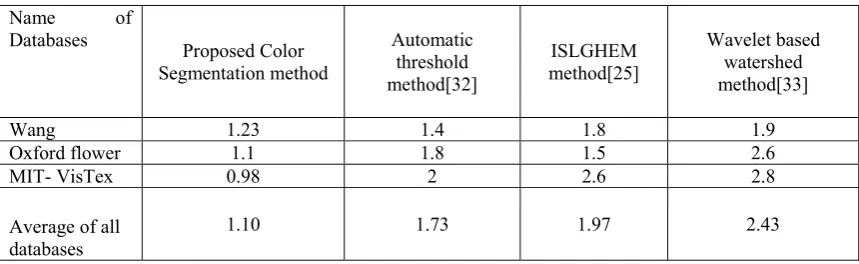
• The existing segmentation methods derived an internal region contrast value around 2 and the proposed method derived a value around 1.10 indicating the proposed method achieved good uniform regions. This is mainly due to the ULBP.
clearly a decent segmentation by the proposed method over the other existing methods. The proposed method is compared with three existing methods ISLGHEM [25], automatic thresholding method [32], and wavelet based watershed method [33]. The segmentation metrics i.e. discrepancy, entropy, standard deviation and internal region contrast are derived on the proposed color segmentation and the existing methods [25, 32, 33] and plotted in the form of graphs (Fig.12 to Fig. 15). The average segmentation metric values of each databases is listed in the Tables 1 to 4.
The considered databases i.e. Wang, Oxford flowers and MIT-VisTex databases original images and their segmental results are shown in. Fig.9, Fig.10 and Fig. 11 respectively.
Fig. 10: Oxford flower database images and corresponding segmented results.
Fig. 12: Discrepancy graph.
Fig. 13: The entropy value graph. 0
5 10 15 20 25 30
Wang Oxford flower MIT- VisTex
Discr
epan
cy
valu
e
Different Databases
Proposed Color Segmentation method Automatic threshold method[32] ISLGHEM method[25] Wavelet based watershed method[33]
0 0.5 1 1.5 2 2.5 3 3.5 4
Wang Oxford flower MIT- VisTex
En
tro
py
val
ue
Different databases
Proposed Color Segmentation method Automatic threshold method[32]
Fig. 14: The standard deviation graph.
Fig. 15: The internal region contrast graph.
Table 1: Average values of discrepancy.
Name of
Databases Proposed Color Segmentation method Automatic threshold method[32] ISLGHEM method[25] Wavelet based watershed method[33]
Wang 16.68 13.2 11.3 10.3
Oxford flower 18.79 12.3 11.4 10.6
MIT- VisTex 24.87 11.6 10.5 9.9
Average of all
databases 20.11 12.37 11.07 10.27
0 0.5 1 1.5 2 2.5 3 3.5 4 4.5 5
Wang Oxford flower MIT- VisTex
St and are d de vi at ion va lu e Different databases
Proposed Color Segmentation method Automatic threshold method[32]
ISLGHEM method[25] Wavelet based watershed method[33]
0 0.5 1 1.5 2 2.5 3
Wang Oxford flower MIT- VisTex
In tern al reg io n con trast value Different databases
Proposed Color Segmentation method Automatic threshold method[32]
Table 2: Average values of entropy.
Name of
Databases Proposed Color Segmentation method
Automatic threshold method[32]
ISLGHEM method[25]
Wavelet based watershed method[33]
Wang 1.21 3.4 3.1 2.6
Oxford flower 1.32 3.1 2.7 2.6
MIT- VisTex 1.1 2.6 2.1 1.9
Average of all
databases 1.21 3.03 2.63 2.37
Table 3: Average values of standard deviation.
Name of
Databases Proposed Color Segmentation method
Automatic threshold method[32]
ISLGHEM method[25]
Wavelet based watershed method[33]
Wang 1.7 4.1 4.4 3.8
Oxford flower 1.98 3.5 4.4 4.2
MIT- VisTex 1.53 4.3 4.1 3.6
Average of all
databases 1.74 3.97 4.30 3.87
Table 4: Average values of internal region contrast.
Name of
Databases Proposed Color Segmentation method
Automatic threshold method[32]
ISLGHEM method[25]
Wavelet based watershed method[33]
Wang 1.23 1.4 1.8 1.9
Oxford flower 1.1 1.8 1.5 2.6
MIT- VisTex 0.98 2 2.6 2.8
Average of all
databases 1.10 1.73 1.97 2.43
5. Conclusions
lines, edges, curves of each color component significantly and the image is coded with 59 patterns. The small holes are filled by the morphological treatment. This established uniform local regions for a better segmentation. The K-means clustering established local boundaries of the image effectively and also removed unwanted non-significant portions of the image. The experimental results on three different types of color texture databases established the fact that, the proposed scheme can yield an accurate segmentation on any color textures.
REFERENCES
[1] Peng, B., Zhang, L., Zhang, D.: Automatic image segmentation by dynamic region merging, IEEE Trans. Image Process., 2011, 20, (12), pp. 3592–3605.
[2] Esmaeil Kheirkhah, Zahra Sadri Tabatabaie,“A Hybrid Face Detection Approach in Color Images with Complex Background”,Indian Journal of Science and Technology,2015 Jan, 8(1), Doi no:10.17485/ijst/2015/v8i1/51337
[3] S. Arumugadevi, V. Seenivasagam ,“Comparison of Clustering Methods for Segmenting Color Images”,Indian Journal of Science and Technology,2015 Apr, 8(7), Doi no:10.17485/ijst/2015/v8i7/62862
[4] Mairal, J., Leordeanu, M., Bach, F., Hebert, M., Ponce, J.: “Discriminative sparse image models for class-specific edge detection and image interpretation”. Proc. 10th European Conf. Computer Vision, 2008, pp. 43–56.
[5] Arbelaez, P., Maire, M., Fowlkes, C., Malik, J.: “Contour detection and hierarchical image segmentation”, IEEE Trans. Patt. Anal. Mach. Intell.,2010, 33, (5), pp. 898–916.
[6] Tao, W., Jin, H., Liu, J.: “Unified mean shift segmentation and graph region merging algorithm for infrared ship target segmentation”, Opt.Eng., 2007, 46, (12), pp. 127002–127002–7.
[7] Mayer, A., Greenspan, H.: “An adaptive mean-shift framework for MRI brain segmentation”, IEEE Trans. Med. Imag., 2009, 28, (8),pp. 1238–1250.
[8] P. Sujatha, K. K. Sudha, “Performance Analysis of Different Edge Detection Techniques for Image Segmentation”,Indian Journal of Science and Technology,2015 July, 8(14), Doi no:10.17485/ijst/2015/v8i14/72946
[9] P. Ganesan, V. Rajini, B. S. Sathish, V. Kalist, S. K. Khamar Basha,“Satellite Image Segmentation Based on YcbCr Color Space”, Indian Journal of Science and Technology,2015 Jan, 8(1), Doi no:10.17485/ijst/2015/v8i1/51281.
[10] Sharon, E., Galun, M., Sharon, D., Basri, R., Brandt, A.: “Hierarchy and adaptivity in segmenting visual scenes”, Nature, 2006, 442, (7104), pp. 810–813.
[11] K. H. Hemalatha, G. Babu, R. Sivakumar, “Lesion Area Detection (LAD) using Superpixel Segmentation”, Indian Journal of Science and Technology,2015.
[12] Otsu, N.: “A threshold selection method from gray-level histograms’, IEEE Trans. Syst., Man, Cybern., 1979, 9, (1), pp. 62–66. [13] Tobias, O.J., Seara, R.: “Image segmentation by histogram thresholding using fuzzy sets”, IEEE Trans. Image Process., 2002,
11, (12), pp. 1457–1465.
[14] Arifin, A.Z., Asano, A.: “Image segmentation by histogram thresholding using hierarchical cluster analysis”, Patt. Recogn.Lett., 2006, 27, (13), pp. 1515–1521.
[15] Chen, T.W., Chen, Y.L., Chien, S.Y.: “Fast image segmentation based on K-means clustering with histograms in HSV color space”. Proc. IEEE Int. Workshop on Multimedia Signal Processing, October 2008, pp. 322–325.
[16] Tan, K.S., Isa, N.A.M.: “Color image segmentation using histogram Thresholding– Fuzzy C-means hybrid approach”, Patt. Recogn., 2011, 44, (1), pp. 1–15.
[17] Tan, K.S., Lim, W.H., Isa, N.A.M.: “Novel initialization scheme for Fuzzy C-Means algorithm on color image segmentation”, Appl. Soft Comput., 2013, 13, pp. 1832–1852.
[18] D. Harwood, T. Ojala, M. Pietika inen, S. Kelman, L.S. Davis, “Texture classification by center-symmetric auto-correlation, using Kullback discrimination of distributions”, Pattern Recognition Lett. 16 (1995) 1-10.
[19] T. Ojala, M. Pietika¬ inen, D. Harwood, “ A comparative study of texture measures with classiÞcation based on feature distributions”, Pattern Recognition,29 (1996) ,51-59.
[20] V.Vijaya Kumar, A. Nagaraja Rao, U.S.N. Raju, B.Eswar Reddy, “Pipeline implementation of new segmentation based on cognate neighborhood approach”, International journal of computer science, Science publications, Vol.35, No.1, pp. 1-6, Feb-2008.
[21] V.Vijaya Kumar, B. Eswar Reddy, A. Nagaraja Rao, U.S.N. Raju, “Texture segmentation methods based on combinatorial of morphological and statistical operations”, Journal of multimedia (JMM), Academy publishers, Vol.3, No.1, pp.36-40.
[22] M.Joseph Prakash, Dr. V,Vijaya Kumar, Dr. A. Vinaya Babu, “Morphology based technique for texture enhancement and segmentation, Signal & Image processing” : An International Journal (SIPIJ), Vol.4, Iss.1, pp:49-56.
[23] T. Venkat Narayana Rao, A. Govardhan,“Efficient Segmentation and Classification of Mammogram Images with Fuzzy Filtering”, Indian Journal of Science and Technology,2015 July, 8(15), Doi no:10.17485/ijst/2015/v8i15/70061.
[24] M.Joseph Prakash, V.Vijayakumar , “A new texture based segmentation method to extract object from background”, Global journal of computer science and technology graphics & vision (GJCST), Vol.12, No.15, pp;1-6, 2012.
[25] V.Vijaya Kumar,Saka Kezia, I.Santi Prabha, “A new texture segmentation approach for medical images”, International journal of scientific & engineering research, Vol. 4, No.1, pp.1-5.
[26] Saka Kezia, I.Santi Prabha, V.VijayaKumar, “A color-texture based segmentation method to extract object from background”, International journal image, and graphics and signal processing, Vol. 5, No. 3, pp.19-25, March-2013.
[28] T. Ahonen, A. Hadid, and M. Pietik¨ainen, “Face description with local binary patterns: Application to face recognition,” IEEE Trans. Pattern Anal. Mach. Intell., vol. 28, no. 12, pp. 2037–2041, Dec. 2006.
[29] http:///wang.ist.psu.edu/docs/related/ [30] http://www.robots.ox.ac.uk/~vgg/data/flowers/
[31] MIT Vision and Modeling Group, Cambridge, „Vision texture‟, http://vismod.media.mit.edu/pub/.
[32] Yuan Been Chen and Oscal.T.C.Chen, "Image Segmentation Method Using Thresholds Automatically Determined from Picture Contents,” in Eurasip journal on image and video processing, vol.2009, pp. 1-16, 2009.
[33] Yu-hua Chai, Li-qun Gao, and Shun Lu, Lei Tian, “Wavelet-based Watershed for Image Segmentation”, in Proc. of the 6th World Congress on Intelligent Control and Automation, Dalian, China, June 21 - 23, 2006
Author’s Profile
Mr. K.Venkata Subbaiah currently working as Assoc. Prof. in Dept. of CSE, PBR Visvodaya Institute of Technology & Science, Kavali, A.P., India. He has completed MCA from University of Madras in April, 1997 and received M.E (CSE) in April 2006, from Satyabhama University, Chennai. He is pursuing Ph.D. in Computer Science in Rayalaseema University, Kunrool, A.P., under the guidance of Dr. V.Vijay Kumar, Dean Dept. of CSE & IT and Director for Centre for Advanced Computational Research (CACR) Anurag Group of Institutions (AGI), Hyderabad, India.