Commerce Division
Discussion Paper No. 71
DIFFERENCES IN THE REPORTED
PERFORMANCES OF FOREIGN-
CONTROLLED AND DOMESTICALLY-
CONTROLLED FIRMS:
SOME UK EVIDENCE
C.R. Emmanuel*
P.B. Oyelere**
July 1999
Commerce Division PO Box 84 Lincoln University
CANTERBURY
Telephone No: (64) (3) 325 2811 Fax No: (64) (3) 325 3847 E-mail: [email protected]
* Professor, Department of Accounting & Finance, University of Glasgow, United Kingdom. ** Lecturer, Accountancy Group, Commerce Division, Lincoln University, New Zealand.
Correspondence Address: Dr. P.B. Oyelere, Accountancy Group, Commerce Division, PO Box 84, Lincoln University, New Zealand; Tel: +64 (3) 325 2811; Fax: +64 (3) 325 3847; E-mail:
Abstract
This study provides empirical evidence on the relative performances of foreign-controlled
domestic companies (FCDCs) operating in the UK as compared to those of UK-controlled domestic companies (UKDCs). One hundred and fifty (150) FCDCs, selected from the Times
1000 (1995), were matched with 150 UKDCs on the bases of size and industry. The reported
performance data of the two sub-samples for five years were extracted from the FT Extel
secured database. Statistical tests were then carried out, on five-year average and annual bases, to establish whether there were differences in the performances of the two groups of
firms. Results revealed statistically significant differences in the reported performances of FCDCs and UKDCs operating in the UK over the five-year period. Foreign-controlled firms
significantly under-performed UKDCs of comparable size and industry. The lower profitability figures reported by these firms were partly as a result of higher trading expenses.
The study also found differences in the year-to-year magnitude of under-performance by FCDCs. While findings in this study corroborate those of earlier US-based studies, the
management and owners of FCDCs’ parents should be interested in the apparent under-performance of their UK-based assets. It is possible, however, that the figures reported do not
reflect real asset performance. In which case, the UK tax authorities may want to take a closer look at FCDCs’ reported performances to establish whether they are the outcome of
income-shifting practices. Future studies could examine how the performances of the managers of these foreign-located assets are evaluated and rewarded and explore other
Contents
List of Tables i
1. Introduction 1
2. Related Literature 1
3. Justification for Current Study 4
4. Research Hypothesis 5
5. Research Design 5
5.1 Sample Selection 5
5.2 Data Collection 7
5.3 Data Analysis 9
6. Discussion of Results 11
7. Conclusion 14
i
List of Tables
1. Average Size of Sample Companies by Industry 6
2. Definition of Research Variables and Ratios 8
3. Wilcoxon matched-pairs signed-ranks test of the equality of mean
performances of FCDCs and UKDCs (5-year average) 10
4. Wilcoxon matched-pairs signed-ranks test of the equality of mean
1
1. Introduction
The reported performances of foreign-controlled domestic companies (FCDCs) relative to those of indigenously-controlled domestic firms is a subject of immense interest, not least to
tax authorities in various countries. While these interests have resulted in a considerable number of research studies in countries such as the US, little has so far been reported on the performances of FCDCs in other countries. This paper aims to provide empirical evidence on the relative profitability of FCDCs operating in the UK. Their reported performances are compared with those of UK-controlled domestic companies (UKDCs), matched by size and industry over a five-year period. Results indicate statistically significant differences in the profitability of the two samples of firms. FCDCs significantly and consistently under-performed UKDCs over the five years covered by this study. The magnitude of differences in performance however differed from one year to the other.
The rest of this paper is organised as follows. The relevant literature is discussed in the next section, followed by a presentation of justification for the current study. The research hypothesis is then stated. The penultimate section contains the research design, including samples, data collection and analysis. Finally, discussions of research results and conclusions, including possible limitations of the study and areas for further study, are presented.
2. Related
Literature
2
Wheeler (1988) examined the rates of return on the assets of US-based FCDCs and compared them to those of US-controlled firms. He found that US-owned firms' rate of return were six times larger than those of foreign-owned firms. In a statement presented before the US House of Representative's Ways and Means Oversight Subcommittee on Tax underpayments by Foreign-owned US Subsidiaries, Wheeler (1990) reported illogical comparative trends in the asset base, profitability and dividend distributions of foreign-owned US subsidiaries between 1983 and 1987. He identified international transfer pricing (ITP) manipulations as a possible explanation for these differences. He however failed to undertake formal statistical analysis to isolate the significance of his results.
Kim and Lyn (1990) went a step further than Wheeler in this regard. As part of a broad-ranging study of the monopolistic power, performance, growth opportunities, risk, efficiency, etc. of foreign MNEs in the US, they examined the profitability of foreign-owned firms in comparison to those of US-owned ones. Using five different ratios (earnings per share, return on equity before tax, return on equity after tax, gross profit margin and operating profit
margin) they compared the average performances of a group of 54 foreign firms with an unmatched group of 54 US firms. Kim and Lyn's analysis of the financial data over a five-year period seems to confirm under-performance by foreign-owned firms as trends rather than one-off occurrences. They failed, however, to disaggregate and examine their data on an annual basis to establish whether there were year-to-year variations in performances. In addition, the statistical power of the study is limited by the lack of any form of matching (by industry, asset, turnover, or any other measure) of the two samples.
This particular limitation was addressed in Crain and Stitts’ (1994) study. As part of a larger survey of international transfer pricing (ITP) practices, they investigated the differences in the gross profit margins (GPM) of foreign- and US-controlled firms, matching their two samples on the bases of SIC codes and sales. They found that the mean GPM of the two groups were significantly different. Foreign-controlled firms reported significantly lower GPMs than US-controlled firms. Crain and Stitts’ study revealed under-performance by FCDCs even when size and industry are controlled for.
3
Grubert et al (1993) compared the taxes paid by FCDCs operating in the US to those of USDCs. They found significant differences in the taxable income (as a percentage of total assets and sales) of the two groups. The income of FCDCs were substantially lower than those of US-owned domestic companies. After accounting for a number of possible extraneous factors such as age and industrial classification of firms, they found that a significant proportion of the differences remained unexplained. They suggested income shifting, through ITP, as a possible explanation for most of these differences1. Hines and Rice (1990), Grubert and Mutti (1991), Harris et al (1993) and Jacob (1996) have all reported evidence suggesting income-shifting behaviour based on inter-jurisdictional tax rate differentials2.
Hardly any evidence exists on the comparative performances of UK-based FCDCs. A few exceptions are Nitsch et al (1995), Munday and Peel (1997) and Oyelere and Emmanuel (1998). Nitsch et al reported on the characteristics and performances of Japanese FDIs located in seven Western European countries including the UK. They found statistically
significant differences in inter-country performances, industry, mode of entry and reasons for making investments.
Oyelere and Emmanuel conducted a study into the performance and post-performance distributions of UK-based FCDCs. Matching them with UK-owned firms on the basis of total assets, they found differences between the profitability and dividend payouts of the two groups. It was possible, from their logistic regression to predict the control location (that is, either foreign- or UK-controlled) of sampled firms. A firm in their sample was more likely to be foreign-controlled than UK-controlled if it reported a combination of lower profitability and higher dividend distributions. Oyelere and Emmanuel's study was however limited by the low number of sampled firms (72 in all) and the limited period (two years) for which data was collected.
Munday and Peel undertook a wide-ranging comparison of the performances of Japanese owned manufacturing firms operating in the UK with those of their UK-owned counterparts. They found that Japanese-owned firms significantly under-performed UK-owned ones with
1
Gideon (1990), Mackie-Mason (1993) and Crain & Stitts, while generally recognising this explanation, are cautious about whether ITP is the primary reason. “Other factors, such as start-up expenses, acquisition indebtedness, the age of the investment, the experience and skills of management, the product being produced, and the nature of the manufacturing process” (Crain and Stitts, p. 97) could also be partly responsible for these performance differentials.
2
4
respect to profitability, asset efficiency, stock efficiency and credit risk, and suggested that Japanese firms may be engaging in ITP strategies which have the effect of minimising liability to UK corporate tax. Buckley and Hughes (1997) provide an intuitively appealing explanation of Japanese companies' behaviour, which relates to the resale price method of ITP and target costing being preferred. Munday and Peel is limited in two respects: (1) it applies to a one-year period only; their results could therefore be a one-off event rather than sustained under-performance by Japanese firms; and (2) only Japanese-owned firms’ performances, rather than those of foreign-owned firms of varied national backgrounds, were examined. The authors suggested that future studies should consider eliminating these limitations.
3.
Justification for Current Study
The lack of a substantial body of literature on the relative profitability of UK-based foreign operations is surprising. The UK's economic environment is one of the most open and deregulated in the world. It attracted overseas investments totaling £364,756 million from 1987 to 1997 inclusive (Office of National Statistics 1998). Some of the country's industries, automobile production for example, are exclusively dominated by FCDCs. The magnitude and prevalence of this form of investment activity therefore justifies investigation of the relative performances of FCDCs as compared to locally-controlled firms. Extensions to current knowledge in the area will also be provided by assuaging for the limitations identified in previous studies as reviewed above. In this regard, the following procedures were incorporated in the research design of the current study:
1. Controlling for both size and industry by matching sampled FCDCs and UKDCs when undertaking formal statistical testing;
2. Using performance data extending beyond a two-year period; and examining the
5
4. Research
Hypothesis
The objective of this study is to compare empirically the performances of FCDCs operating in the UK with those of their UK-owned counterparts. The main research queries are: Do UK-owned MNEs substantially out-perform their foreign-owned counterparts? Are the reported profits of large UK-owned firms significantly and consistently greater than those of
foreign-owned companies? To answer these questions, a null hypothesis is stated as follows:
H0: There are no significant differences between the performance of foreign-owned firms operating in the UK and those of their UK-owned counterparts.
5. Research
Design
5.1 Sample Selection
The samples for this study were selected from the 1995 edition of the Times 1000 which lists the top 1000 companies operating in the UK. Dun and Bradstreet's Who Owns Whom (1995) was used to stratify the population into FCDCs3 and UKDCs. One hundred and fifty (150) FCDCs were randomly selected and carefully matched with an equal number of UKDCs on the basis of industry and size (capital employed). A breakdown of the sample according to
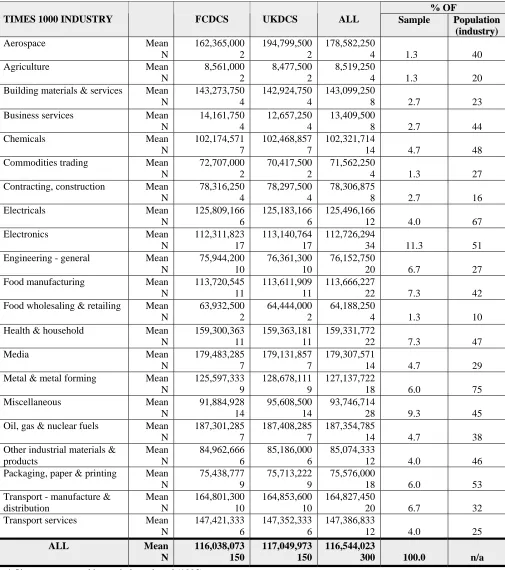
industrial classification and size is presented in Table 1.
3
6
Table 1
Average Size of Sample Companies by Industry
*
% OF TIMES 1000 INDUSTRY
FCDCS
UKDCS
ALL Sample PPooppuullaattiioonn (
(iinndduussttrryy))
Aerospace Mean N 162,365,000 2 194,799,500 2 178,582,250 4
1.3 40
Agriculture Mean N 8,561,000 2 8,477,500 2 8,519,250 4
1.3 20
Building materials & services Mean N 143,273,750 4 142,924,750 4 143,099,250 8
2.7 23
Business services Mean N 14,161,750 4 12,657,250 4 13,409,500
8 2.7 44
Chemicals Mean N 102,174,571 7 102,468,857 7 102,321,714 14
4.7 48
Commodities trading Mean N 72,707,000 2 70,417,500 2 71,562,250 4
1.3 27
Contracting, construction Mean N 78,316,250 4 78,297,500 4 78,306,875 8
2.7 16
Electricals Mean N 125,809,166 6 125,183,166 6 125,496,166 12
4.0 67
Electronics Mean N 112,311,823 17 113,140,764 17 112,726,294 34
11.3 51
Engineering - general Mean N 75,944,200 10 76,361,300 10 76,152,750 20
6.7 27
Food manufacturing Mean N 113,720,545 11 113,611,909 11 113,666,227 22
7.3 42
Food wholesaling & retailing Mean N 63,932,500 2 64,444,000 2 64,188,250 4
1.3 10
Health & household Mean N 159,300,363 11 159,363,181 11 159,331,772 22
7.3 47
Media Mean N 179,483,285 7 179,131,857 7 179,307,571 14
4.7 29
Metal & metal forming Mean N 125,597,333 9 128,678,111 9 127,137,722 18
6.0 75
Miscellaneous Mean N 91,884,928 14 95,608,500 14 93,746,714 28
9.3 45
Oil, gas & nuclear fuels Mean N 187,301,285 7 187,408,285 7 187,354,785 14
4.7 38
Other industrial materials & products Mean N 84,962,666 6 85,186,000 6 85,074,333 12
4.0 46
Packaging, paper & printing Mean N 75,438,777 9 75,713,222 9 75,576,000 18
6.0 53
Transport - manufacture & distribution Mean N 164,801,300 10 164,853,600 10 164,827,450 20
6.7 32
Transport services Mean N 147,421,333 6 147,352,333 6 147,386,833 12
4.0 25
ALL Mean N 116,038,073 150 117,049,973 150 116,544,023
300 100.0 n/a
7
Table 1 reveals a near-exact size and industrial classification matching of the two groups of companies in this study. Intra-industrial size matching is a particularly important methodological extension for investigations in this area. The Oil, gas and nuclear fuels industry had the highest mean capital employed of about £187 million. This is followed by the Media and Transport (manufacturing and distribution) industries with about £179 and £165 millions mean capital employed, respectively. The lowest average capital employed of about £8.5 million was in the Agriculture industry.
In terms of inter-industrial spread of the sample, the Electricals industry, was the highest (about 11%) represented of the twenty-one Times 1000 industrial classes in the sample. The Aerospace, Agriculture, Commodities trading and Food wholesaling and retailing industries,
with four companies (about 1%) each, had the least representation.
5.2 Data Collection
8
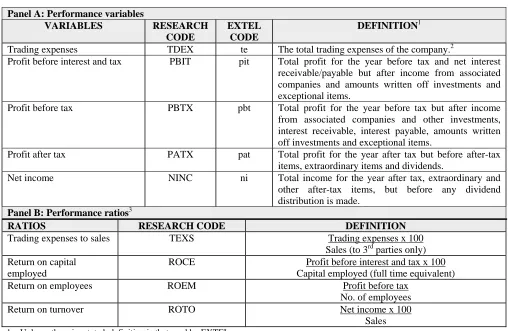
Table 2
Definition of Research Variables and Ratios
Panel A: Performance variables
VARIABLES RESEARCH
CODE
EXTEL CODE
DEFINITION1
Trading expenses TDEX te The total trading expenses of the company.2
Profit before interest and tax PBIT pit Total profit for the year before tax and net interest receivable/payable but after income from associated companies and amounts written off investments and exceptional items.
Profit before tax PBTX pbt Total profit for the year before tax but after income from associated companies and other investments, interest receivable, interest payable, amounts written off investments and exceptional items.
Profit after tax PATX pat Total profit for the year after tax but before after-tax items, extraordinary items and dividends.
Net income NINC ni Total income for the year after tax, extraordinary and other after-tax items, but before any dividend distribution is made.
Panel B: Performance ratios3
RATIOS RESEARCH CODE DEFINITION
Trading expenses to sales TEXS Trading expenses x 100 Sales (to 3rd parties only) Return on capital
employed
ROCE Profit before interest and tax x 100 Capital employed (full time equivalent)
Return on employees ROEM Profit before tax
No. of employees
Return on turnover ROTO Net income x 100
Sales
1. Unless otherwise stated, definition is that used by EXTEL.
2. The constituents of trading expenses were presented in two different ways by different companies, either by function or by nature. 3. Ratios are researcher-defined.
9
Despite the meticulous attempt at matching of FCDCs and UKDCs in this study, the level of comparability of data collected could still be limited by the fact that FCDCs’ activities and practices are, to some extent, subject to controls by their parents as well as accounting and other rules and regulations in the parents’ home countries. However, these firms, insofar as they operate within the UK like the UKDCs in the sample, are expected to meet UK legal and accounting regulations. This assumption, as made in previous studies, provide a valid premise for the comparisons undertaken here.
5.3 Data Analysis
The research hypothesis was set up to investigate the a priori notion that, ceteris paribus, the reported financial performances of FCDCs do not differ substantially from those of UKDCs. As reported above, data on both groups’ performances (PBIT, NINC, etc.) have been collected on an annual and average bases over five years. The Wilcoxon matched-pairs signed-ranks test was used to test the hypothesis of equal mean performances by members of
10 Table 3
Wilcoxon matched-pairs signed-ranks test of the equality of mean performances of FCDCs and UKDCs (5-year average)
Research Mean rank
Variable FoDCs UKDCs FoDC > UKDC FoDC < UKDC Ties Z Significance (2-tailed)
TDEX 70.41 62.22 69 63 0 1.0652 .2868
PBIT 62.33 69.48 55 77 0 -2.1827 .0291b
PBTX 56.00 73.37 54 78 0 -3.0299 .0024a
PATX 60.18 70.48 51 81 0 -2.9981 .0027a
NINC 61.63 69.57 51 81 0 -2.83 .0047a
TEXS 72.30 57.58 80 52 0 -3.1684 .0015a
ROCE 63.82 68.19 51 81 0 -2.5756 .0100a
ROEM 67.42 65.80 57 75 0 -1.2401 .2149
ROTO 60.63 70.20 51 81 0 -2.9458 .0032a
N, the number of matched pairs, is 132 for all performance variables. a and b indicate significance at 1% and 5% levels respectively.
TDEX = Trading expenses; PBIT = Profit before interest and tax; PBTX = Profit before tax; PATX = Profit after tax; NINC = Net income; TEXS = Trading expenses to sales; ROCE = Return on capital employed; ROEM = Return on employees; ROTO = Return on turnover.
11
6.
Discussion of Results
From the results presented in Table 3 above, the hypothesis of no difference is rejected for almost all the performance variables in this study. There are differences in the performances of UKDCs and FCDCs and these differences are significant at the 1 per cent level for PBTX, PATX, NINC, TEXS and ROTO; and at the 5 per cent level for PBIT and ROCE. With
respect to all the performance variables, FCDCs reported a combination of lower mean profitability and higher mean trading expenses.
These results generally confirm the findings of Wheeler (1988), Kim and Lyn (1990), Gideon (1990), Crain and Stitts (1994), Munday and Peel (1997) and Oyelere and Emmanuel (1998), who all found that foreign-owned firms returned lower profits than their domestically-owned counterparts. This raises questions on the current validity of a number of advantage-based FDI theories that proposed that MNEs move abroad after developing certain firm-specific advantage(s), which they transport across national boundaries into a foreign location, with the rational economic expectation being that these advantages should generate returns over and above those which locally-owned firms are capable of generating. The findings of this study suggest that such returns are either not being generated or are not being fully reported by foreign-owned companies. A revision of these theories and a more careful examination of figures disclosed in FCDCs’ annual reports and accounts is necessary.
Initial tests on TDEX did not reveal a statistically significant difference between the groups. However when TDEX was normalised by sales (TEXS), FCDC’s were found to be significantly higher than UKDC’s. From a transfer pricing perspective, trading expenses is one of the most important profit and loss account items. The fact that it is higher for UK-based FCDCs may be a pointer to significant overpricing by their suppliers, who are most likely to be related parties located abroad. Kim and Lyn also reported a similar finding in relation to the trading expenses of foreign-owned firms operating in the US.
12 Table 4
Wilcoxon matched-pairs signed-ranks test of the equality of mean performances of FCDCs and UKDCs (Annual)
1990 1991
Research Mean rank FoDC > FoDC < Mean rank FoDC > FoDC <
Variable FoDCs UKDCs UKDC UKDC Z Sig. (2-tailed) FoDCs UKDCs UKDC UKDC Z Sig. (2-tailed)
TDEX 66.79 66.12 75 57 -1.408 .159 66.90 65.91 79 53 -2.035 .042b
PBIT 64.62 67.84 55 77 -1.897 .058c 63.28 69.18 60 72 -1.345 .179
PBTX 67.96 65.67 48 84 -2.560 .010b 62.64 69.26 55 77 -2.144 .032b
PATX 62.46 69.13 52 80 -2.592 .010b 65.13 67.45 54 78 -1.981 .048b
NINC 66.40 66.56 52 80 -2.126 .034b 65.63 67.10 54 78 -1.919 .055c
TEXS 70.18 61.02 79 53 -2.623 .009a 68.19 63.90 80 52 -2.421 .015b
ROCE 73.72 62.10 50 82 -1.597 .110 62.17 69.89 58 74 -1.778 .075c
ROEM 68.66 64.59 62 70 -.300 .764 67.93 65.34 59 73 -.865 .387
ROTO 67.80 65.71 50 82 -2.269 .023b 63.12 68.70 52 80 -2.514 .012b
N, the number of matched pairs, is 132 for all performance variables. a b and c indicate significance at the 1, 5 and 10% levels respectively.
TDEX = Trading expenses; PBIT = Profit before interest and tax; PBTX = Profit before tax; PATX = Profit after tax; NINC = Net income; TEXS = Trading expenses to sales; ROCE = Return on capital employed; ROEM = Return on employees; ROTO = Return on turnover.
Table 4 (continued)
Wilcoxon matched-pairs test of the equality of mean performances of FCDCs and UKDCs (Annual)
1992 1993
Research Mean rank FoDC > FoDC < Mean rank FoDC > FoDC <
Variable FoDCs UKDCs UKDC UKDC Z Sig. (2-tailed) FoDCs UKDCs UKDC UKDC Z Sig. (2-tailed)
TDEX 70.86 61.43 71 61 -1.458 .145 68.41 62.31 68 62 -.917 .359
PBIT 61.15 69.97 52 80 -2.746 .006a 58.84 69.80 51 79 -2.920 .004a
PBTX 62.51 68.63 46 86 -3.438 .001a 63.67 66.47 45 85 -3.236 .001a
PATX 62.59 68.59 46 86 -3.430 .001a 62.67 67.00 45 85 -3.340 .001a
NINC 62.21 68.87 47 85 -3.327 .001a 62.13 67.35 46 84 -3.252 .001a
TEXS 71.96 58.36 79 53 -2.944 .003a 70.26 57.63 81 49 -3.331 .001a
ROCE 69.98 64.51 48 84 -2.339 .019b 60.29 66.78 45 83 -3.365 .001a
ROEM 63.62 68.76 58 74 -1.588 .112 63.22 66.55 60 69 -.939 .348
ROTO 62.81 68.54 47 85 -3.264 .001a 56.83 70.57 48 82 -3.554 .000a
N, the number of matched pairs, is 132 for all performance variables. a and b indicate significance at 1% and 5% levels respectively.
13
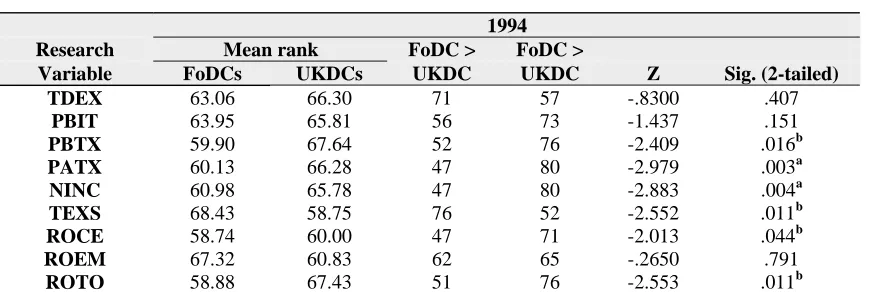
Table 4 (continued)
Wilcoxon matched-pairs test (Annual)
1994 Research Mean rank FoDC > FoDC >
Variable FoDCs UKDCs UKDC UKDC Z Sig. (2-tailed)
TDEX 63.06 66.30 71 57 -.8300 .407
PBIT 63.95 65.81 56 73 -1.437 .151
PBTX 59.90 67.64 52 76 -2.409 .016b
PATX 60.13 66.28 47 80 -2.979 .003a
NINC 60.98 65.78 47 80 -2.883 .004a
TEXS 68.43 58.75 76 52 -2.552 .011b
ROCE 58.74 60.00 47 71 -2.013 .044b
ROEM 67.32 60.83 62 65 -.2650 .791
ROTO 58.88 67.43 51 76 -2.553 .011b
N, the number of matched pairs, is 132 for all performance variables. a and b indicate significance at 1% and 5% levels respectively. TDEX = Trading expenses; PBIT = Profit before interest and tax; PBTX = Profit before tax; PATX = Profit after tax; NINC = Net income; TEXS = Trading expenses to sales; ROCE = Return on capital employed; ROEM = Return on employees; ROTO = Return on turnover.
The test procedures were also applied to the annual performance data variables for each of the five years covered by the study to investigate the year-to-year variability in comparative performance. Results as presented in Table 4 reveal that while performance differentials are consistently present in each of the five years of study, the degree of differences in the comparative performances of the two sub-samples vary from one year to the other. Differences in performance are more pronounced in years 3 and 4 than in others, as indicated by the levels of statistical significance (1%) in PBIT, PBTX, PATX, NINC, TEXS, ROCE and ROTO. This finding is an interesting one; it justifies the collection of performance data for periods extending beyond one or two years and may indicate inter-annual shifting or smoothing of income by UK-based foreign-controlled firms. Evidence of such shifts among US-based firms was reported in Altshuler and Newlon (1993) and Harris (1993).
14
7. Conclusion
This study revealed differences in the reported performances of FCDCs and UKDCs operating in the UK over a five-year period. Foreign-controlled firms significantly under-performed UKDCs of comparable size and industry over the period. Lower profitability figures are reported by these firms, partly as a result of higher reported trading expenses.
While previous studies in this area have pinpointed the use of ITP for tax-minimisation purposes, as a likely reason for performance differentials, this assertion remains debatable, given the fact that UK nominal corporate tax rate is lower than those of the countries where the parents of most of the FCDCs in this study are located. In the search for other possible explanations, Buckley and Hughes (1997) suggested target costing, rather than ITP, as a more plausible reason for differences in the reported performances of Japanese-controlled firms operating in the UK. Future studies may compare the ITP practices of FCDCs with those of their locally-owned counterparts to provide empirical evidence on the relationship between ITP and the reported performances of FCDCs.
Findings in the current study have implications for a number of interested parties. The management and owners of FCDCs’ parents should be interested in the apparent under-performance of their UK-based assets. Apart from the benefits associated with diversification, there is little justification for continued investment in the UK going by their reported financial accounting figures. It is possible, however, that reported figures do not reflect asset performance in reality. In which case, the UK tax authorities may want to take a closer look at FCDCs’ reported performances to establish whether they are the outcome of income-shifting practices. It will be interesting to examine how the performances of the managers of these foreign-located assets are evaluated and rewarded.
Given the potential limitation of financial accounting measures of performance, future researchers may consider including some other measures to capture other aspects of firms’
15
country of ownership basis to observe whether salient nationalistic tendencies exist with regards to their performances.
References
Altshuler, R. and T.S. Newlon (1993) The effects of US tax policy on the income repatriation patterns of US multinational corporations. In Studies in International Taxation, ed. A. Giovannini, R.G. Hubbard and J. Slemrod, 77-115. National Bureau of Economic Research (NBER) Project Report. Chicago: The University of Chicago Press.
Buckley, P.J. and J.F. Hughes (1997) Japanese transfer pricing policy: A note. Applied Economic Letters 4: 13-17.
Buckley, P.J. and M.C. Casson (1976) The Future of the Multinational Enterprise. London: Macmillan.
Buckley, P.J. and M.C. Casson (1991) The Future of the Multinational Enterprise. 2nd edition. London: Macmillan.
Crain, T.L and R.H.Stitts (1994) A comparison of gross profit margins between foreign-controlled domestic corporations and comparable US-foreign-controlled domestic corporations. Journal of International Accounting, Auditing and Taxation, 3(1): 85-101.
Dun and Bradstreet (1995) Who Owns Whom. Bucks: Dun and Bradstreet International.
Gideon, K.W. (1990) Statement before the Ways and Means Oversight Subcommittee hearing on foreign-owned businesses in the US. Daily Tax Report (June 13): L25-L29.
Grubert, H., T. Goodspeed and D. Swenson (1993) Explaining the low taxable income of foreign-controlled companies in the United States. In Studies in International Taxation, ed. A. Giovannini, R.G. Hubbard and J. Slemrod, 237-270. National Bureau of Economic Research (NBER) Project Report. Chicago: The University of Chicago Press.
Grubert, H. and J. Mutti (1991) Taxes, tariffs and transfer pricing in multinational corporate decision-making. Review of Economics and Statistics (May): 285-293.
16
Harris, D.G., R. Morck, J. Slemrod and B. Yeung (1993) Income shifting in US multinational corporations. In Studies in International Taxation, ed. A. Giovannini, R.G. Hubbard and J. Slemrod, 277-302, National Bureau of Economic Research (NBER) Project Report. Chicago: The University of Chicago Press.
Hines, J.R. and E.M. Rice (1990) Fiscal paradise: Foreign tax havens and American business. NBER Working Paper No. 3477.
Howell, D.C. (1997) Fundamental Statistics for the Behavioral Sciences. 3rd edition. Boston, Mass.: PWS-KENT Publishing Company.
Jacob, J. (1996) Taxes and transfer pricing: Income shifting and the volume of intrafirm transfers. Journal of Accounting Research 34(2): 301-312.
Kim, W.S. and E.O. Lyn (1990) FDI theories and the performance of foreign multinationals operating in the US. Journal of International Business Studies (First Quarter): 41-54.
Mackie-Mason, J.K. (1993) "Comment" on Grubert, H, T. Goodspeed and D. Swenson. Explaining the low taxable income of foreign-controlled companies in the United States. In Studies in International Taxation, ed. A. Giovannini, R.G. Hubbard and J. Slemrod, 270-275, National Bureau of Economic Research (NBER) Project Report. Chicago: The University of Chicago Press.
Munday, M. and M.J. Peel (1997) The Japanese manufacturing sector in the UK: A performance appraisal. Accounting and Business Research (Winter) 28(1): 19-39.
Nitsch, D., P. Beamish and S. Makino (1995) Characteristics and performance of Japanese foreign direct investment in Europe. European Management Journal 13(3): 276-285.
Norusis, J. (1993) SPSS® for Windows: Base System User’s Guide – Release 6.0. Chicago, Ill: SPSS Inc.
Office of National Statistics (1998) Annual Abstract of Statistics - 1998, No. 134. London: The Stationery Office.
Oyelere, P.B. (1998) International transfer pricing practices, performance and post-performance distribution differences among UK-based multinational enterprises: A foreign-owned versus UK-owned firms' comparison. Unpublished PhD Thesis, The Queen's University of Belfast.
Oyelere P.B. and C.R. Emmanuel (1998) International transfer pricing and income shifting: Evidence from the UK. European Accounting Review 7(4): 623-635.
Rugman, A. (1980) A new theory of the multinational enterprise: Internationalisation versus internalisation. Columbia Journal of World Business (Spring): 23-29.
Rugman, A.M., D.J. Lecraw and L.D. Booth (1985) International Business: Firm and Environment. New York: McGraw-Hill.
17
The Times (1994) Times 1000 – 1995. London: Times Books.
Wheeler, J.E. (1988) An academic look at transfer pricing in a global economy. Tax Notes (July 4): 87-96.