www.orientjchem.org
An International Open Free Access, Peer Reviewed Research Journal
2016, Vol. 32, No. (5): Pg. 2407-2423
Optimisation of Arsenic (III) by Colorimetric
Incorporated with Image Processing Technique
JIN HOONG LEONG
1, KEAT KHIM ONG
2*, WAN YUNUS WAN MD ZIN
3,
FITRIANTO ANWAR
4, UMMUL FAHRI ABDUL RAUF
2, CHIN CHUANG TEOH
5,
HUSSIN ABDUL GHAPOR
3and MOHD JUNAEDY OSMAN
21Faculty of Engineering, Universiti Pertahanan Nasional Malaysia,
Kem Sungai Besi, 57000 Kuala Lumpur, Malaysia.
2,3Centre for Defence Foundation Studies, Universiti Pertahanan Nasional Malaysia,
Kem Sungai Besi, 57000 Kuala Lumpur, Malaysia.
4Faculty of Science, Universiti Putra Malaysia, 43400 UPM Serdang, Selangor, Malaysia. 5Malaysian Agricultural Research and Development Institute Headquarter,
G. P.O. Box 12301, 50774 Kuala Lumpur, Malaysia. *Corresponding author E-mail: [email protected]
http://dx.doi.org/10.13005/ojc/320512
(Received: September 05, 2016; Accepted: October 12, 2016)
ABSTRACT
Inorganic arsenic contamination has caused a remarkable impact on the contamination of soil and groundwater in many countries. Consequently, determination of inorganic arsenic on site is very crucial especially arsenic (III) which is more toxic than arsenic (V). Thus, a more rapid, simple and ecofriendly approach was developed in this study to determine arsenic (III) by incorporation of image processing technique into colorimetric method. The effects of various factors were evaluated by a 24 full factorial design with a blocking factor. The mass ratio of sulfamic acid to zinc powder was
the most significant factor affected red, green and blue (RGB) color values and followed by reaction period. The optimum conditions for the detection were found to be using 1 g of sulfamic acid and 0.5 g of zinc powder at 5 minutes. This work also demonstrates that the developed method is able to detect arsenic (III) rapidly and easily.
Keywords: Arsenic (III), Colorimetric, Factorial design analysis, Image Processing, Optimisation.
INTRODUCTION
Continuous exposures to toxic chemicals for example arsenic could cause a significant risk to public health1 as it is a highly toxic element even at
low concentration2. Arsenic occurs in nature water in
various forms of inorganic and organic3 and mainly
found in two inorganic forms i.e. As3+ and As5+,
whereby As (III) is more toxic than As (V)4. According
to Shen et. al (2013)5, As (III) is able to bind to
a specific protein which could alter the protein’s conformation, leading to a deterioration in cellular functions. In addition, based on the report by Bednar
species is crucial due to the extensive variation in the toxicology, mobility, and absorptivity of each species.
Laboratory instruments can provide highly accurate and precise analysis to measure arsenic in water samples, but it is time consuming and costly, consequently various arsenic test kits have been developed based on colorimetric method. However the results obtained is normally based on comparison of the color formed on the test strip with a reference color scale which is rather subjective and operator-dependent. Thus there is a need for improvement for in-situ analysis of arsenic. According to Wang et al. (2011)7, an ideal field deployable sensor would be able
to detect low µg/L concentration of analyte directly on-site with little or no sample preparation as well as persistence to interference ions. In fact, colorimetric methods can provide results nearly as accurate and reliable as those from analytical laboratories when the reaction is automatically evaluated by means of a color detector8. An electronic device for
measuring color has been introduced to minimize human error in interpreting the color with naked eyes for determination of arsenic. For example, Anderson
et al. (2008)9 measured reflectance of the developed
color spot and convert it to digital signal by an electronic transducer which requires 30 to 40 minutes to detect of arsenic.
Thus, a more rapid, simple and ecofriendly approach was developed in this study to determine arsenic (III) by incorporation of image processing technique into colorimetric method. The effects of different factors were investigated by a 24 full factorial
design with a blocking factor. The effects consists of weight load used for drying silver nitrate-impregnated filter paper, drying period of silver nitrate-impregnated filter paper, mass ratio of sulfamic acid to zinc powder and reaction period between arsine gas generated and silver nitrate which were evaluated at two levels to determine the significant factors before optimize the detection of arsenic (III).
MATERIALS AND METHODS
Reagents and Materials
Arsenic (III) stock solution containing 1,000 mg As (III)/L (Merck, Germany) was used to prepare As (III) working standard solutions. Sulfamic acid,
silver nitrate and zinc powder were also obtained from Merck (Germany). All the chemicals used in this study were of analytical grade.
Preparation of As (III) working standard solutions
As (III) working standard solutions containing 0 to 300 µg/L of As (III) were freshly prepared from the As (III) stock solution by proper dilutions using ultrapure water.
Preparation of 5% (w/v) silver nitrate solution
A 5% solution of silver nitrate was prepared by dissolving the silver nitrate using ultrapure water in a 100 mL volumetric flask.
Preparation of silver nitrate-impregnated filter paper
Whatman filter paper No.3 was cut into a 2.5 cm (diameter) round-shaped piece of the paper. It was then dipped into the silver nitrate solution for period of 2 seconds and followed by drying it between two pieces of dry Whatman filter papers which was pressed using a 100 or 500 g load for 20 or 60 seconds. This silver nitrate-impregnated filter paper was used as arsine sensor paper.
Colored complex formation
Minitab software (version 17.0) (USA) was utilized to randomize the ninety-six experimental runs with all possible combinations of factors in duplicates at high and low levels to investigate the effect of weight load (100 or 500 g) used for drying silver nitrate-impregnated filter paper (DW), drying period of silver nitrate-impregnated filter paper (DP) (20 or 60 s), mass ratio of sulfamic acid to zinc powder (MSZ) (1.0 g: 0.5 g or 4.0 g: 2.0 g), and reaction period (RP) (5 or 10 minutes).
colored arsine sensor paper was removed from the cap and used for image analysis.
Color image processing
For each colored arsine sensor paper, two images were captured by a digital camera (Sony Cyber-shot, DSC-W610) at the distance of 15 cm. All conditions including distance, lighting conditions (automatic mode) and camera setting were kept constant for all experiments. The color (red, green and blue) of the images were transformed into digital readings from 0 to 225 using Image J software and used for further statistical analysis.
Statistical Analysis
To determine significant factors, Analysis of Variance (ANOVA), Student’s t-analysis, correlation between response variables, linear regression analysis were carried out. Main and interaction effects plots were also formed for each color value. All these data analysis was performed using Minitab software (version 17.0) (USA). Besides that, normal probability and residual versus fitted value plots were also formed using the software.
Optimisation of detection
Optimisation plot was constructed to suggest the optimum conditions of arsenic (III) detection using the Minitab software. Validation of the suggested optimum conditions was performed by conducting the detection experiments at the suggested conditions in 5 replications. The experiments was carried out similar to the procedure as mentioned in the section of Colored complex formation at the suggested optimum conditions.
Data Analysis
To determine the significant factors that affect the detection of arsenic (III), all data analysis including linear regression analysis, Analysis
of Variance (ANOVA), Student’s t-analysis and correlation between response variables were implemented using the Minitab software version 17.0 (Minitab Inc., PA, USA). Main effects plot was also developed for each color value for significant contribution factors.
RESULTS AND DISCUSSION
Colorimetric method used in this work was based on modification of the methods developed by Cherukuri and Anjaneyulu (2005)10 and later by Ong
et al. (2015)11.
Red, green and blue (RGB) color values are the responses in this work which produced by a change in the level of a factor. The regression analysis of red, green and blue color values are displayed in Table 3, 4 and 5, respectively. The results revealed that the main effects of mass ratio of sulfamic acid to zinc powder (MSZ) and reaction period (RP) were significant at a 5% of probability level (P< 0.05) for all color values. However, for interaction effect, drying weight-drying period of silver nitrate-impregnated filter-paper-reaction period (DW x DP x RP) interaction and drying weight-mass ratio of sulfamic acid to zinc powder -reaction period (DW x MSZ x RP) interaction were significant at a 5% of probability level (P < 0.05) for red and green. However, such interaction effects do not exist in blue color.
Equations 1, 2 and 3 indicate the models that relate the levels of parameter and red, green and blue color values, respectively.
Red color value = 103.04 + 0.910X1 + 0.899X2 -3.803X3 -8.053X4 – 1.046X1X2 + 0.116X1X3 + 0.048X1X4 +0.116X2X3 + 0.517X2X4-0.500X3X4 + 0.530X1X2X3 + 2.266X1X2X4 -1.991X1X3X4 +
Table 1: Low and High Levels of Factors
Factor Low High
level(-1) level (+1)
Weight load used for drying silver nitrate-impregnated filter paper (DW)(X1), g 100 500
Reaction period (RP)(X4), min. 5 10
Table 2: Experimental results for detection of arsenic (III)
DW DP MSZ RP Arsenic (III) Color value Std Run Center
(g) (s) (min) Concentration Red Green Blue Order Order Pt
(µg/L)
100 20 1 5 0 134.929 153.018 147.315 1 1 1
100 20 1 5 10 133.998 151.394 145.087 2 2 1
100 20 1 5 50 132.183 149.634 141.730 3 3 1
100 20 1 5 100 114.965 117.107 83.968 4 4 1
100 20 1 5 200 81.996 75.166 37.681 5 5 1
100 20 1 5 300 69.744 60.594 29.444 6 6 1
100 20 4 5 0 130.952 149.481 141.914 7 7 1
100 20 4 5 10 129.994 148.549 139.079 8 8 1
100 20 4 5 50 128.233 142.955 119.901 9 9 1
100 20 4 5 100 109.984 107.052 54.206 10 10 1
100 20 4 5 200 76.035 66.674 39.770 11 11 1
100 20 4 5 300 62.758 54.816 25.165 12 12 1
100 20 1 10 0 127.595 146.614 140.348 13 13 1
100 20 1 10 10 126.131 143.815 136.440 14 14 1
100 20 1 10 50 124.349 139.430 125.608 15 15 1
100 20 1 10 100 94.167 90.073 46.823 16 16 1
100 20 1 10 200 66.920 57.250 27.520 17 17 1
100 20 1 10 300 55.009 47.087 26.081 18 18 1
100 20 4 10 0 127.838 145.430 139.492 19 19 1
100 20 4 10 10 124.303 140.702 130.960 20 20 1
100 20 4 10 50 116.619 127.183 88.124 21 21 1
100 20 4 10 100 81.522 79.398 31.002 22 22 1
100 20 4 10 200 63.480 56.726 23.869 23 23 1
100 20 4 10 300 45.391 43.210 22.024 24 24 1
100 60 1 5 0 136.792 153.882 147.563 25 25 1
100 60 1 5 10 132.738 149.684 140.869 26 26 1
100 60 1 5 50 129.333 142.622 127.591 27 27 1
100 60 1 5 100 120.250 130.602 104.074 28 28 1
100 60 1 5 200 112.361 111.685 71.303 29 29 1
100 60 1 5 300 106.105 100.668 51.942 30 30 1
100 60 4 5 0 127.069 144.288 133.833 31 31 1
100 60 4 5 10 126.768 143.310 131.752 32 32 1
100 60 4 5 50 128.274 144.533 127.201 33 33 1
100 60 4 5 100 111.125 115.634 66.637 34 34 1
100 60 4 5 200 92.451 81.186 44.570 35 35 1
100 60 4 5 300 71.154 59.406 30.447 36 36 1
100 60 1 10 0 133.098 152.654 148.877 37 37 1
100 60 1 10 10 126.638 145.583 142.822 38 38 1
100 60 1 10 50 112.648 129.302 127.987 39 39 1
100 60 1 10 100 95.679 89.897 45.293 40 40 1
100 60 1 10 200 63.582 55.871 24.001 41 41 1
100 60 1 10 300 49.367 42.740 22.007 42 42 1
100 60 4 10 0 122.400 139.719 133.587 43 43 1
100 60 4 10 10 127.090 143.890 135.080 44 44 1
100 60 4 10 50 121.196 130.382 89.783 45 45 1
100 60 4 10 200 68.112 62.123 21.130 47 47 1
100 60 4 10 300 54.150 47.651 21.993 48 48 1
500 60 1 10 0 136.793 155.491 152.644 49 49 1
500 60 1 10 10 131.622 149.281 146.564 50 50 1
500 60 1 10 50 135.405 151.637 146.537 51 51 1
500 60 1 10 100 114.595 121.003 93.401 52 52 1
500 60 1 10 200 104.155 98.945 52.794 53 53 1
500 60 1 10 300 94.655 86.561 43.278 54 54 1
500 60 1 5 0 133.138 149.563 141.373 55 55 1
500 60 1 5 10 132.178 148.875 140.904 56 56 1
500 60 1 5 50 125.615 139.866 117.701 57 57 1
500 60 1 5 100 113.730 115.078 64.876 58 58 1
500 60 1 5 200 101.051 94.947 39.514 59 59 1
500 60 1 5 300 83.001 73.410 26.479 60 60 1
500 20 1 5 0 128.106 145.621 139.839 61 61 1
500 20 1 5 10 130.079 147.265 140.111 62 62 1
500 20 1 5 50 130.201 145.643 129.774 63 63 1
500 20 1 5 100 102.316 102.132 63.249 64 64 1
500 20 1 5 200 70.654 61.166 29.168 65 65 1
500 20 1 5 300 59.520 50.683 24.021 66 66 1
500 20 4 5 0 131.697 150.428 147.854 67 67 1
500 20 4 5 10 125.379 141.680 131.462 68 68 1
500 20 4 5 50 96.648 106.171 70.494 69 69 1
500 20 4 5 100 76.423 71.536 25.635 70 70 1
500 20 4 5 200 49.939 45.328 22.642 71 71 1
500 20 4 5 300 46.059 42.446 25.182 72 72 1
500 20 1 10 0 130.418 148.622 145.224 73 73 1
500 20 1 10 10 131.638 148.659 144.986 74 74 1
500 20 1 10 50 126.705 143.390 138.145 75 75 1
500 20 1 10 100 119.817 124.719 91.182 76 76 1
500 20 1 10 200 90.857 88.574 55.037 77 77 1
500 20 1 10 300 78.105 70.236 32.173 78 78 1
500 20 4 10 0 128.167 144.262 137.551 79 79 1
500 20 4 10 10 129.817 146.586 140.104 80 80 1
500 20 4 10 50 123.058 136.867 119.304 81 81 1
500 20 4 10 100 114.697 115.249 65.165 82 82 1
500 20 4 10 200 89.996 81.248 30.444 83 83 1
500 20 4 10 300 72.356 60.805 23.572 84 84 1
500 60 4 5 0 135.358 153.436 148.180 85 85 1
500 60 4 5 10 131.337 149.016 143.035 86 86 1
500 60 4 5 50 127.215 142.622 128.297 87 87 1
500 60 4 5 100 109.072 108.769 62.776 88 88 1
500 60 4 5 200 82.429 69.917 27.049 89 89 1
500 60 4 5 300 56.139 48.689 21.712 90 90 1
500 60 4 10 0 132.673 150.651 143.491 91 91 1
500 60 4 10 10 116.933 131.173 112.984 92 92 1
500 60 4 10 50 121.582 124.256 70.959 93 93 1
500 60 4 10 100 83.550 74.764 26.496 94 94 1
500 60 4 10 200 66.479 55.596 19.859 95 95 1
Table 3: Statistical Parameters for 24 full factorial design of red color value
Term Effects Coefficients Standard Error T-value P-value
Constant - 103.04 1.21 122.11 0.000
DW 1.820 0.910 0.862 1.06 0.295
DP 1.798 0.899 0.862 1.04 0.301
MSZ -7.607 -3.803 0.862 -4.41 0.000
RP -16.106 -8.053 0.862 -9.34 0.000
DW x DP -2.091 -1.046 0.862 -1.21 0.229
DW x MSZ 0.232 0.116 0.862 -0.80 0.429
DW x RP 0.096 0.048 0.862 0.06 0.956
DP x MSZ 0.232 0.116 0.862 -0.80 0.429
DP x RP 1.034 0.517 0.862 0.60 0.551
MSZ x RP -1.000 -0.500 0.862 -0.58 0.564
DW x DP x MSZ 1.060 0.530 0.862 0.61 0.541
DW x DP x RP 4.532 2.266 0.862 2.63 0.010
DW x MSZ x RP -3.982 -1.991 0.862 -2.31 0.024
DP x MSZ x RP 1.974 0.987 0.862 1.14 0.256
DW x DP x MSZ x RP -1.438 -0.719 0.862 -0.83 0.407
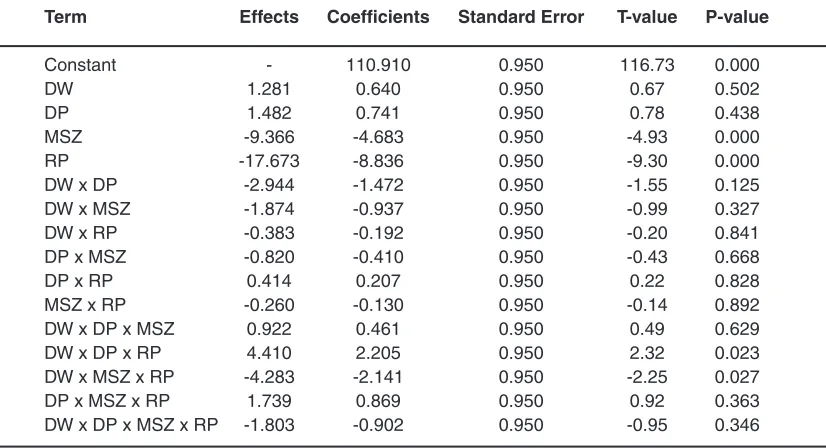
Table 4: Statistical Parameters for 24 full factorial design of green color value
Term Effects Coefficients Standard Error T-value P-value
Constant - 110.910 0.950 116.73 0.000
DW 1.281 0.640 0.950 0.67 0.502
DP 1.482 0.741 0.950 0.78 0.438
MSZ -9.366 -4.683 0.950 -4.93 0.000
RP -17.673 -8.836 0.950 -9.30 0.000
DW x DP -2.944 -1.472 0.950 -1.55 0.125
DW x MSZ -1.874 -0.937 0.950 -0.99 0.327
DW x RP -0.383 -0.192 0.950 -0.20 0.841
DP x MSZ -0.820 -0.410 0.950 -0.43 0.668
DP x RP 0.414 0.207 0.950 0.22 0.828
MSZ x RP -0.260 -0.130 0.950 -0.14 0.892
DW x DP x MSZ 0.922 0.461 0.950 0.49 0.629
DW x DP x RP 4.410 2.205 0.950 2.32 0.023
DW x MSZ x RP -4.283 -2.141 0.950 -2.25 0.027
DP x MSZ x RP 1.739 0.869 0.950 0.92 0.363
DW x DP x MSZ x RP -1.803 -0.902 0.950 -0.95 0.346 0.987X2X3X4 -0.719 X1X2X3X4
...(1) Green color value = 110.910 +0.640X1 + 0.741X2 -4.683X3 -8.836X4 – 1.472X1X2 – 0.937X1X3 -0.192X1X4 - 0.140X2X3 + 0.207X2X4 -0.130 X3X4 + 0.461X1X2X3 + 2.205X1X2X4 -2.141X1X3X4 +0.869 X2X3X4 -0.902 X1X2X3X4
...(2)
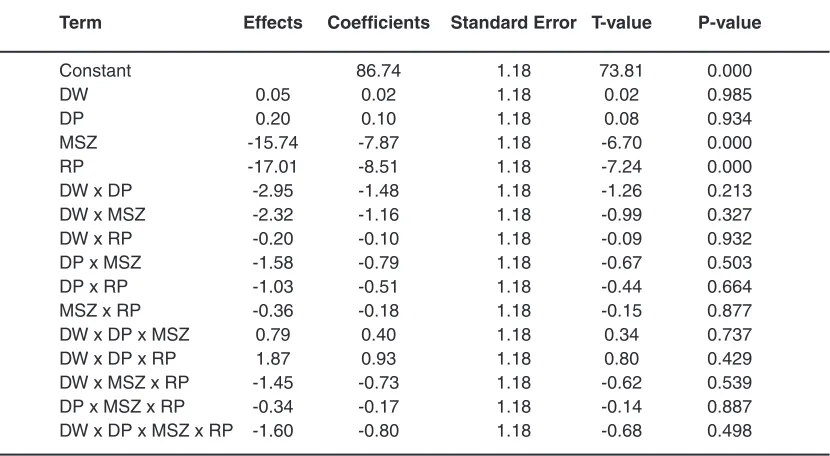
Blue color value = 86.74 + 0.02X1 + 0.10X2 -7.87X3 -8.51X4 – 1.48X1X2 – 1.16X1X3 -0.10X1X4 - 0.79X2X3- 0.51X2X4-0.18X3X4 + 0.40X1X2X3 + 0.93X1X2X4 -0.73X1X3X4 -0.17X2X3X4 -0.80X1X2X3X4
...(3)
Table 5: Statistical Parameters for 24 full factorial design of blue color value
Term Effects Coefficients Standard Error T-value P-value
Constant 86.74 1.18 73.81 0.000
DW 0.05 0.02 1.18 0.02 0.985
DP 0.20 0.10 1.18 0.08 0.934
MSZ -15.74 -7.87 1.18 -6.70 0.000
RP -17.01 -8.51 1.18 -7.24 0.000
DW x DP -2.95 -1.48 1.18 -1.26 0.213
DW x MSZ -2.32 -1.16 1.18 -0.99 0.327
DW x RP -0.20 -0.10 1.18 -0.09 0.932
DP x MSZ -1.58 -0.79 1.18 -0.67 0.503
DP x RP -1.03 -0.51 1.18 -0.44 0.664
MSZ x RP -0.36 -0.18 1.18 -0.15 0.877
DW x DP x MSZ 0.79 0.40 1.18 0.34 0.737
DW x DP x RP 1.87 0.93 1.18 0.80 0.429
DW x MSZ x RP -1.45 -0.73 1.18 -0.62 0.539
DP x MSZ x RP -0.34 -0.17 1.18 -0.14 0.887
DW x DP x MSZ x RP -1.60 -0.80 1.18 -0.68 0.498 from low to high level or vice versa, while if the colors
are red, green and blue formed a high level of the same factors, it is negative effect. Figures 1, 2 and 3 illustrate the main effects of the factors for red, green and blue color values.
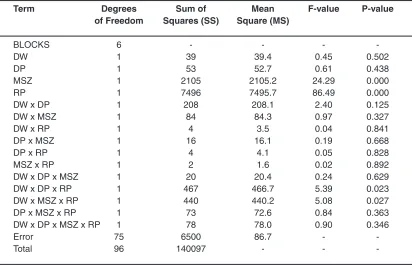
Tables 6, 7 and 8 show the results of Analysis of Variance for three response colors, respectively. The sum of squares used to estimate the factors’ effects and F-ratios are also presented in the tables. The results revealed that the main effects of MSZ and RP are highly significant (at 5% level of significance). However, the MSZ and RP interaction are not significant and most of the interaction effects are insignificant as compared to other effects accepts for DW x DP x RP and DW x MSZ x RP. Therefore, recalculation of regression coefficients, standard error, t and p-values were conducted and the results are shown in Tables 9, 10 and 11 for red, green and blue color values, respectively.
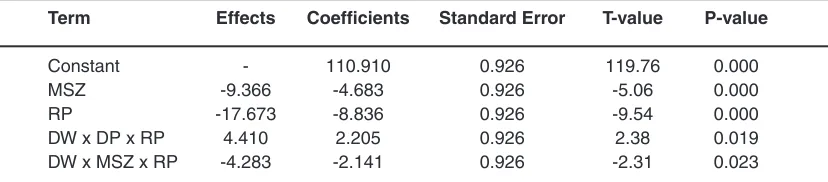
In equations 4, 5 and 6, respectively, shows a reduced model equation with resultant coefficients for red, green and blue color values.
Red color value = 103.04 -3.803X3 -8.053X4 + 2.266X1X2X4 -1.991X1X3X4 ...(4)
Green color value = 110.910 - 4.683X3 -8.836X4 + 2.205X1X2X4 -2.141X1X3X4 ...(5) Blue color value = 86.74 -7.87X3 -8.51X4
Table 6: Analysis of Variance (ANOVA) for red color value
Term Degrees Sum of Mean F-value P-value
of Freedom Squares (SS) Square (MS)
BLOCKS 6 - - -
-DW 1 79.5 79.5 1.11 0.295
DP 1 77.6 77.6 1.09 0.301
MSZ 1 1388.6 1388.6 19.45 0.000
RP 1 6226.0 6226.0 87.18 0.000
DW x DP 1 104.9 104.9 1.47 0.229
DW x MSZ 1 45.2 45.2 0.63 0.429
DW x RP 1 0.2 0.2 0.00 0.956
DP x MSZ 1 1.3 1.3 0.02 0.894
DP x RP 1 25.7 25.7 0.36 0.551
MSZ x RP 1 24.0 24.0 0.34 0.564
DW x DP x MSZ 1 26.9 26.9 0.38 0.541
DW x DP x RP 1 492.9 492.9 6.90 0.010
DW x MSZ x RP 1 380.5 380.5 5.33 0.024
DP x MSZ x RP 1 93.5 93.5 1.31 0.256
DW x DT x MSZ x RP 1 49.6 49.6 0.69 0.407
Error 75 5355.9 71.4 -
-Total 96 74467.4 - -
-S = 8.45055 R-sq = 92.81% R-sq(adj) = 90.89%
Table 7. Analysis of Variance (ANOVA) for green color value
Term Degrees Sum of Mean F-value P-value
of Freedom Squares (SS) Square (MS)
BLOCKS 6 - - -
-DW 1 39 39.4 0.45 0.502
DP 1 53 52.7 0.61 0.438
MSZ 1 2105 2105.2 24.29 0.000
RP 1 7496 7495.7 86.49 0.000
DW x DP 1 208 208.1 2.40 0.125
DW x MSZ 1 84 84.3 0.97 0.327
DW x RP 1 4 3.5 0.04 0.841
DP x MSZ 1 16 16.1 0.19 0.668
DP x RP 1 4 4.1 0.05 0.828
MSZ x RP 1 2 1.6 0.02 0.892
DW x DP x MSZ 1 20 20.4 0.24 0.629
DW x DP x RP 1 467 466.7 5.39 0.023
DW x MSZ x RP 1 440 440.2 5.08 0.027
DP x MSZ x RP 1 73 72.6 0.84 0.363
DW x DP x MSZ x RP 1 78 78.0 0.90 0.346
Error 75 6500 86.7 -
-Total 96 140097 - -
Table 8: Analysis of Variance (ANOVA) for blue color value
Term Degrees Sum of Mean F-value P-value
of Freedom Squares (SS) Square (MS)
BLOCKS 6 - - -
-DW 1 0 0.1 0.00 0.985
DP 1 1 0.9 0.01 0.934
MSZ 1 5947 5947.2 44.85 0.000
RP 1 6944 6944.2 52.37 0.000
DW x DP 1 209 209.2 1.58 0.213
DW x MSZ 1 129 129.3 0.98 0.327
DW x RP 1 1 1.0 0.01 0.932
DT x MSZ 1 60 60.2 0.45 0.503
DT x RP 1 25 25.3 0.19 0.664
MSZ x RP 1 3 3.2 0.02 0.877
DW x DP x MSZ 1 15 15.1 0.11 0.737
DW x DP x RP 1 84 83.8 0.63 0.429
DW x MSZ x RP 1 51 50.5 0.38 0.539
DP x MSZ x RP 1 3 2.7 0.02 0.887
DW x DP x MSZ x RP 1 62 61.6 0.46 0.498
Error 75 9946 132.6 -
-Total 96 239449 - -
-S = 11.5157 R-sq = 95.85% R-sq(adj) = 94.74%
Table 9: Statistical parameters for 24 full factorial design
of red color value for reduced model
Term Effects Coefficients Standard Error T-value P-value
Constant - 103.04 0.844 124.75 0.000
MSZ -7.607 -3.803 0.844 4.50 0.000
RP -16.106 -8.053 0.844 -9.54 0.000
DW x DP x RP 4.532 2.266 0.844 2.68 0.009
DW x MSZ x RP -3.982 -1.991 0.844 -2.36 0.021
Table 10: Statistical parameters for 24 full factorial
design of green color value for reduced model
Term Effects Coefficients Standard Error T-value P-value
Constant - 110.910 0.926 119.76 0.000
MSZ -9.366 -4.683 0.926 -5.06 0.000
RP -17.673 -8.836 0.926 -9.54 0.000
DW x DP x RP 4.410 2.205 0.926 2.38 0.019
Table 11: Statistical parameters for 24 full factorial
design of blue color value for reduced model
Term Effects Coefficients Standard Error T-value P-value
Constant 86.74 1.12 77.48 0.000
MSZ -15.74 -7.87 1.12 -7.03 0.000
RP -17.01 -8.51 1.12 -7.60 0.000
Table 12: Analysis of Variance (ANOVA) of Red Color Value for reduced model
Term Degrees Sum of Mean F P
of Freedom Squares (SS) Square (MS)
BLOCKS 6 - - -
-MSZ 1 1388.6 1388.6 20.29 0.000
RP 1 6226.0 6226.0 90.99 0.000
DW x DP x RP 1 492.9 492.9 7.20 0.009
DW x MSZ x RP 1 380.5 380.5 5.56 0.021
Error 87 5884.3 68.4 -
-S = 8.27180 R-sq = 92.10% R-sq(adj) = 91.27%
Table 13: Analysis of Variance (ANOVA) of Green Color Value for reduced model
Term Degrees Sum of Mean F P
of Freedom Squares (SS) Square (MS)
BLOCKS 6 - - -
-MSZ 1 2105 2105.2 25.57 0.000
RP 1 7496 7495.7 91.04 0.000
DW x DP x RP 1 467 466.7 5.67 0.019
DW x MSZ x RP 1 440 440.2 5.35 0.023
Error 87 7081 82.3 -
-S = 9.07367 R-sq = 94.95% R-sq(adj) = 94.42%
Table 14: Analysis of Variance (ANOVA) of Blue Color Value for reduced model
Term Degrees Sum of Mean F P
of Freedom Squares (SS) Square (MS)
BLOCKS 6 - - -
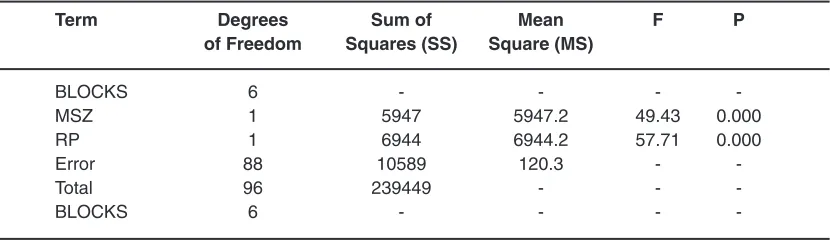
-MSZ 1 5947 5947.2 49.43 0.000
RP 1 6944 6944.2 57.71 0.000
Error 88 10589 120.3 -
-Total 96 239449 - -
-BLOCKS 6 - - -
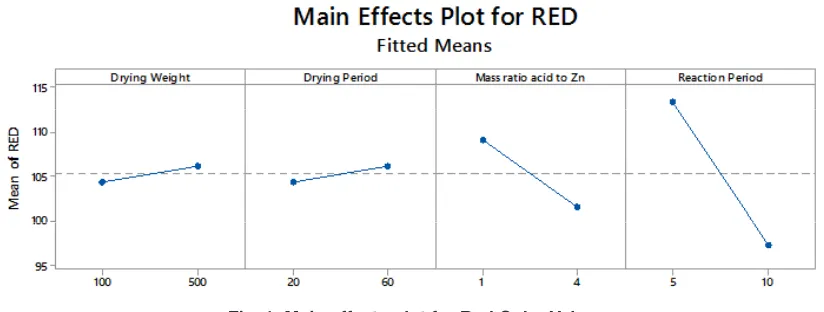
Fig. 1: Main effects plot for Red Color Value
Fig. 2: Main effects plot for Green Color Value
Fig. 3: Main effects plot for Blue Color Value
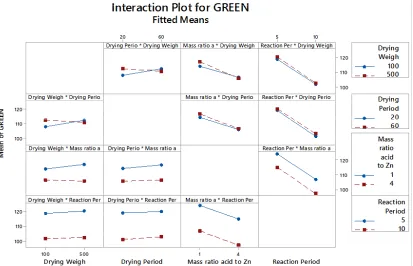
Figures 4, 5 and 6 present the interaction effects of red, green and blue color values, respectively. It is evident that, the effects of both MSZ
Fig. 4: Interaction effects of reduced model for Red Color Value
Fig. 6: Interaction effects for Blue Color Value
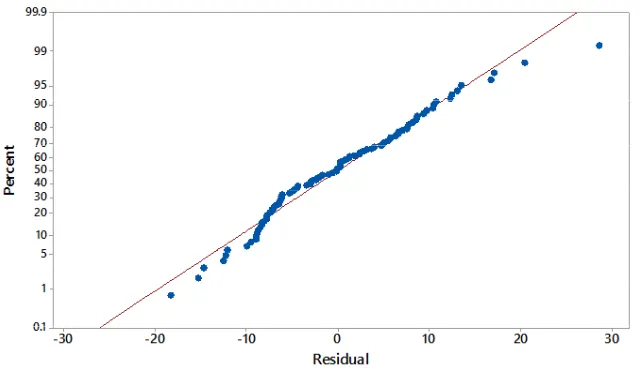
Fig. 7: Normal probability plot of residual values for red color value Normal distribution plot
The estimate values for all response colors showed that the experimental data are normally distributed as the experimental points were reasonably aligned, as shown in Figures 7, 8 and 9 of the normal probability plots of residual values. The
Fig. 8: Normal probability plot of residual values for green color value
Fig. 9: Normal probability plot of residual values for blue color value Main effect of reaction period
Figures 1 to 3 show that red, green and blue values decreased by 15.79%, 14.29% and 17.89%, respectively, when the reaction period increased from 5 minutes to 10 minutes. The results from Tables 9 to 11 also exhibited that the reaction period also plays a significant role on color values. This can be explained by the fact that more arsenic (III) is reduced to arsine gas which will react with silver ions and produce darker color compound on the impregnated filter paper when longer reaction period was used.
Main effect of mass ratio of sulfamic acid to zinc powder
Fig. 10: Residual versus fitted value plot for red color value
Fig. 11: Residual versus fitted value plot for green color value
higher mass ratio of sulfamic acid to zinc powder was applied which resulted in more production of arsine gas which reacts with silver nitrate on the impregnated filter paper. Thus, it can be said that the effect of mass ratio of sulfamic acid to zinc powder is negative in color values, but it is positive effect in detection of arsenic (III) as darker color has lower color value.
Interaction effect of drying weight-drying period of silver nitrate-impregnated filter- paper-reaction period (DW x DP x RP) interaction and drying weight-mass ratio of sulfamic acid to zinc powder -reaction period (DW x MSZ x RP) interaction
Apart from main effect, interaction effects between the parameters were also investigated in this study and results are presented in Figures 7 to 9. Among all the interaction effects, there were only two of the three interaction effects i.e. drying weight-drying period of silver nitrate-impregnated filter- paper-reaction period (DW x DP x RP) interaction and drying weight-mass ratio of sulfamic acid to zinc powder-reaction period (DW x MSZ x RP) interaction were significantly affect all color values except blue color value on the production of color compunds on the silver nitrate-impregnated filter paper.
Optimisation of Arsenic (III) Detection
Fig. 12: Residual versus fitted value plot for red color value
Fig. 13: Optimization plot for Arsenic (III) detection
2.5 g: 1.25 g and 4.0 g: 2.0 g, and different reaction periods (RP) (5 minutes, 7.5 minutes and 10 minutes) were conducted to validate the optimum conditions by optimisation plot using Minitab software version 17, whereas the weight load used for drying silver nitrate-impregnated filter paper (DW) and drying period of silver nitrate-impregnated filter paper (DP) were fixed at low levels i.e. 100 g and 20 seconds, respectively, as both were found to be insignificant factors. The
optimization plot (Fig. 13) shows the effect of each factor on the responses or composite desirability. The vertical red lines on the graph represent the current factor settings. The numbers displayed in bracket show the current factor level settings (in red). Both horizontal blue dash lines and numbers indicated by y which represents the responses for the current factor level. The plot displays the optimum mass ratio of sulfamic acid to zinc powder (MSZ) and the optimum
reaction period (RP) were 1 g of sulfamic acid and 0.5 g of zinc powder, and 5 minutes, respectively.
Comparison of arsenic detection performance
Arsenic detection performance of this present method was compared with the methods developed by previous researcher. The performance was evaluated in terms of linear detection range and reaction period. In general, a longer reaction period is required for detection of arsenic using the method developed by previous researcher except the reaction period reported by Shrivas et al. (2015)12,
which was similar to reaction period found in this study. Previous researcher such as Siangproh
et al.(2016)13 reported that 7 minutes is required
to detect 0.5 to 30 mg/L of total inorganic arsenic, whereas Huang et al. (2015)14 have developed a
bacterial biosensor to detect 10 to 500 µg/L of As in 3-h reaction time. Kiso et al. (2015)15 documented
detection tube method. Besides that, a novel whole-cell arsenite biosensor was developed using the photosynthetic bacterium Rhodopseudomonas palustris no. 7 for detection of arsenite (0-500 µg/L) after 24 hours (Yoshida et al., 2008)16. Das et al.
(2014)17 used two different kits for detection of 10
µg/L–250 µg/L of total arsenic in water in 7 minutes. In addition, the present method was simple, rapid and sensitive compared to the method developed by previous workers.
CONCLUSION
In this work, various effects were investigated using 24 full factorial design for detection of arsenic
(III) by colorimetric incorporated with image processing technique. The mass ratio of sulfamic acid to zinc powder was the most significant factor affected RGB color values and followed by reaction
period. Drying weight-drying period of silver nitrate-impregnated filter-paper-reaction period (DW x DP x RP) interaction as well as drying weight-mass ratio of sulfamic acid to zinc powder-reaction period (DW x MSZ x RP) interaction significantly affected red and green color values, thus significantly influenced the detection. The optimum conditions for detection of arsenic (III) were found to be using 1 g of sulfamic acid and 0.5 g of zinc powder at 5 minutes. The present work also demonstrates that the developed method can be used to detect arsenic (III) rapidly and easily.
ACKNOWLEDGMENTS
The authors thank to Ministry of Higher Education for financing this work via research grant (PRGS/1/2012/STWN01/UPNM/02/1) and Universiti Pertahanan Nasional Malaysia for providing the research facilities.
REFERENCES
1. Naujokas, M. F.; Anderson, B.; Ahsan, H.; Vasken Aposhian, H.; Graziano, J.H.; Thompson, C.; Suk,W.A.; K. Environ. Health Perspect, 2013, 121(3), 295-302.
2. Nordstrom, D.K. Science, 2002, 296, 2143. 3. Cullen W. R.; Reimer K. J. Chem. Rev. 1989,
89(4), 713–64.
4. Mizumura, A.; Watanabe, T.; Kobayashi, Y.; Hirano, S. Toxicol. Appl. Pharmacol. 2010,
242(2), 119–125.
5. Shen, S.; Li, X.-F.; Cullen, W.R.; Weinfeld, M.; Le, X.C. Chem. Rev. 2013, 113(10), 7769-7792.
6. Bednar, A.J.; Garbarino, J.R.; Burkhardt, M.R.; Ranville J.F.; Wildeman T.R. Water Res.,
2004, 38, 355–364.
7. Wang, Y.; Pan, G.; Wang, K.Q. Nanotech 2011: Technical Proceedings of the 2011 NSTI Nanotechnology Conference and Expo, Boston, MA, 2011, 3, 521-524.
8. Safarzadeh-Amiri, A.; Fowlie, P.; Kazi, A.I.; Siraj, S.; Ahmed, S.; Akbor, A. Sci. Total Environ. 2011, 409, 2662–2667.
9. Anderson, R.D.; McNeill, L.S.; Edwards, M.;
Morton, S.C. J. Environ. Eng. 2008, 134(5), 382-388.
10. Cherukuri, J.; Anjaneyulu, Y. Int. J. Environ. Res. Public Health. 2005, 2(2), 322 - 327. 11. Ong, K. K.; Zainuddin, M.; Teoh, C. C.; Yusof,
N. A.; Wan Yunus, W. M. Z.; Mohd Azmi, A. F.
Environ. Eng. Manag. J. 2015, 14(8), 1963-1968.
12. Shrivas, K.; Shankar, R.; Dewangan, K.
Sensor. Actuat. B – Chem. 2015, 220, 1376– 1383.
13. Siangproh, W.; Chailapakul, O.; Songsrirote, K. Talanta. 2016, 153, 197–202.
14. Huang, C.-W.; Wei, C.-C.; Vivian Liao, H.-C.
Chemosphere. 2015, 141, 44–49.
15. Kiso, Y.; Asaoka, S.; Kamimoto, Y.; Tanimoto, S.; Yokota, K. J. Environ. Chem. Eng. 2015, 3, 40–45.
16. Yoshida, K.; Inoue, K.; Takahashi, Y.; Ueda, S.; Isoda, K.; Yagi, K.; Maeda, I. Appl. Environ. Microbiol. 2008, 74(21), 6730–6738. 17. Das, J.; Sarkar, P.; Panda, J. Pal, P. J. Environ.