DOI: 10.30954/0424-2513.4.2018.29
©2018 New Delhi Publishers. All rights reserved
Millets’ Consumption Probability and Demand in India: An
Application of Heckman Sample Selection Model
M. Umanath
1*, R. Balasubramaniam
2and R. Paramasivam
11Madras Institute of Development Studies, Chennai, India
2Department of Market Extension, Tamil Nadu Agricultural University, Coimbatore, India
*Corresponding author: [email protected]
ABSTRACT
This paper aims to analyze the determinants of the choice probability of millet consumption and the demand for major millets at household level in India. For this, we used consumer expenditure survey data collected by the National Sample Survey Organization (NSSO) for the years 2004-05 and 2011-12. Heckman sample selection model was used to estimate the functional relationship between household level characters and millet consumption as zero expenditure is encountered for many of the households in the data set. The analysis revealed that the prices of millets and other food commodities had statistically
significant effect on both millet consumption probability and the quantity demanded of millets while per capita income was not an important determinant. It is confirmed that the millets continue to be treated
as inferior goods in India. Besides, age of household head has a positive relationship with the millet consumption, whereas larger household size and higher educational level decreased the probability of
millet consumption and quantity demanded.
Keywords: Millets, prices, income, Heckman, maximum likelihood, households, food
Millets are considered as ideal food to human beings because of their high nutritive values. Millets contain high level of proteins, minerals, vitamins, antioxidants, and they are non-glutinous and non-acid forming diets compared to other cereals and therefore called as ‘nutritious millets’
or ‘nutricereals’. Specifically, pearl millet and finger
millets provide protein at the rate of 11.8 and 7.4 g per 100 gram grain, respectively, and the fat content is low in these millets (around 1.3 g per
100 g grain) (Sakamoto, 1982; Muthamilarasan et
al. 2015). Besides, millets have higher levels of low
Glycemic Index (GI) non-starch polysaccharides
and dietary fibers which protects against diabetes.
The important millets cultivated and consumed in
India include sorghum, pearl millet, finger millet
(ragi), foxtail millet (kangni), kodo millet (kodo), proso millet (cheena), barnyard millet (sawan)
and little millet (kutki) (NAAS, 2013). These millet
crops are mainly grown in the semi-arid regions
of Asia and Africa, accounting for an area of 32.12
M ha (million hectare) and production of 28.76 M t (million tonnes) in 2013. Most millet crops have shorter life cycle of 60-90 days, and are able to withstand the situation of minimal moisture, high
temperature and soil with poor nutrients (Lata et
al. 2013; Bergamini et al. 2013). The salient features
contributing for wider adoption of these crops in the cropping systems of semi-arid regions include climate resilience, low labour and market input
requirement, resistance to pests and diseases and their capability to sequester carbon and reduce the
burden of greenhouse gas thereby supporting low carbon agriculture. Despite the easy availability of nutritionally rich food through millet consumption, India still faces malnutrition problems. National Family Health Survey found that about 46 percent
of the children under five years of age are moderate
to severely underweight (thin for age), 38 percent are moderate to severely stunted (short for age), and nearly 19 percent are moderate to severely futile
Online ISSN : 0976-4666
2007), which have resulted in poorest performance of India in Human Development Index with
123rd rank out of 162 countries in 2015. India’s
expenditure on the prevention of micronutrient malnutrition was about 0.8 to 2.4 percent of the
GDP. The annual per capita intake of sorghum at
the national level decreased drastically from 8.5 kg to 1.58 kg in urban areas and by 19.2 kg to 2.424 kg in rural areas between 1972-73 and 2011-12; while pearl millet intake also declined rapidly from 11.5 kg to 0.97 kg in rural areas and from 4 kg to 2.82
kg in urban areas (Rao et al. 2009; Basavaraj et al.
2010; NSSO, 2012).
The reason for the decline of millet intake is over-dependency on rice and wheat, which may provide over 50 percent of the average Indian household’s caloric intake. In recent times, notable changes in
the dietary pattern of households across the state
have been observed from cereals to high value food commodities such as livestock products,
fruits, vegetables and beverages (Kumar et al. 2011;
Chatterjee et al. 2006; Bansil, 1999; Radhakrishna, 2005); increase in per capita income, growing urbanisation, and changing tastes and preferences (Chand, 2007) and less attention by researchers on these so-called neglected and underutilized species (Padulosi and Hoeschle-Zeledon, 2004)
affects neglected nutrition and health opportunities
(Smith, 1982; Frison et al. 2006; Hawtin, 2007; Smith
and Longvah, 2009). Markets for millet grains is imperfect and shallow in nature particularly during surplus production. In turn, millet producers received lower prices as compared to the millets purchased for consumption at the retail level
(Nagarajan et al. 2005). Processing of millets for
consumption at household level is tedious and often
time consuming while the tastes and preferences of
younger generations are shifting away from millets. All these factors have contributed for millets being
treated as inferior food with low to negative income elasticity of demand and positive price elasticity.
Along with other factors such as easy access to
irrigation and markets for high-value crops, the millet crops have been slowly and steadily replaced by high-value crops in their traditional production
areas (Chandrakanth and Akarsha, 2011).
Several studies have reported that such a transition in food consumption pattern is influenced by increasing growth in income and employment,
availability of expected fresh and processed food products in the market, improvements in transportation and storage facilities and rise of
supermarkets (Kumar et al. 2011; Vasileska and
Rechkoska, 2012; Chengappa et al. 2007). Besides
these macro drivers, a few specific household-level characteristics also influence the purchasing and
consumption of different food products. These characteristics include prices of foods, disposable income of households, age, education level and gender of household head, asset position, household size, location of the dwelling, heterogeneous culture
of different ethnic groups, changing lifestyles and
increasing health consciousness (Quah and Tan,
2009; Pazarlioglu et al. 2007). In the case of millet,
there is limited literature on economic / econometric analysis of millet consumption pattern and its determinants (Green and Park, 1998; Jones and
Akbay, 2000; Hsu and Kao, 2001; Schmit et al. 2002;
Hatirli et al. 2004; Pazarlioglu et al. 2007).
Although the human consumption demand is
likely to play a major role in the development of millets, detailed information on the nature of demand and preferences of consumers regarding millet products is unavailable. Such information is needed for producers and market actors to take market-oriented production decisions to benefit
from growing markets (Lapar et al. 2010). Given
their essentiality in households’ diet, it is crucial for policy makers and other stakeholders involved in production, marketing and processing of millets to understand the factors determining the consumption of these products. Most of the studies in India have largely focused on the magnitude of changes in the
consumption pattern of food commodities, but none of these studies focused on the factors affecting
the food consumption transition at household
level (Kumar et al. 2007). Only a few studies have
comprehensively looked into the impact of price and per capita income by estimating demand elasticities
in India (Kumar et al. 2014; Kumar et al. 2011;
Mittal, 2007; Mittal, 2010). This highlights the fact that the influence of household level characteristics on consumption of millet products is insufficiently
understood in India. Therefore, this paper focusses
on filling this gap in knowledge by analyzing their
relationship which is crucial for policy formulation.
and the amount of consumption of millet in the Indian context.
DATA BASE AND METHODOLOGY
DataThe household data on dietary pattern and consumer
expenditures collected by the National Sample Survey Organization (NSSO), Government of India at national level, pertaining to the periods 2004-05 and 2011-12, were used for this study to capture the temporal and spatial variation in the prices of the commodities, income, and taste and preferences of the consumers. These comprehensive National Sample Survey (NSS) data with a sample size of over 100,000 households covering both rural and urban areas has a high acceptance in research and policy. The detailed sampling procedure has been given in the reports on Household Consumption of Various Goods and Services in India for 2004-05 and 2011-12, released by the Planning Commission, Government of India.
Methodology
It is a common problem in the expenditure survey data on food commodities that large number of respondents may report non-participation or zero consumption of some of the food commodities
due to taste and preference on specific food, and
socioeconomic and cultural limits confronted by the respondents (Cheah and Tan, 2014). In case of such
a censored data, the use of ordinary least squares
regression analysis yields biased, inconsistent and inefficient regression parameters since limiting the range of the dependent variable leads to a non-zero mean of the error term (Greene, 2007).
Though the single equation censored Tobit (Tobin,
1958) model is used to deal with such censored data, it should be stressed that the model is unduly restrictive as it implicitly assumes that the independent variables have the same impact on the probability of preference and the consumption of food commodities. In our study, Heckman sample selection model is employed to accommodate such a kind of zero consumption or non-participation problem encountered in consumer expenditure survey data on millets. Following the notations from Yen and Rosinski (2008), the Heckman sample
selection model can be written as follows:
log 0, 0 0,
˙˙˙
y if z u
β α
α = ′ + ′ + >
= ′ + ≤
…(1)
where, y denotes the dependent variable of the
model; x and z represent the vectors of independent
variables which explain the dependent variable; β
and α denote conformable vectors of parameters;
u and v are the error terms which are distributed
as bi-variate normal with zero means and a finite covariance matrix:
2
0 1 ~ ,
0
u N v
σρ σρ σ
…(2)
where, σ denotes the standard deviation of v, and
the correlation between u and v is represented by
ρ. The standard deviation of u is not known, thus
it is set at unity, given that the selection outcomes are observed as binary, which means that the value
is either 1 or 0. The sample likelihood function is:
(
)
(
)
(
2)
1/ 20 0
1
log / 1
1 log
1
y y
z y x
L z
x y
α ρ β σ
α
ρ β
φ
σ σ
= >
−
+ −
′ ′
− Φ ′ Φ
−
− ′
∏
∏
…(3)
where, y-1 is the Jacobian transformation from log
y to y, and φ (.) and Φ(.) are the standard normal
probability density function (pdf) and cumulative distribution function (cdf), respectively. When the
errors are independent (ρ = 0), (3) reduces to that
of a two-part model, in the case where the
log-likelihood function is separable in parameters α
and [β, ρ], and therefore estimation can be broken
down to a probit model (to estimate α) using the
whole sample and a linear regression of log y on
x (to estimate β, and ρ) using only the on-limit
observations.
There is continued interest in the marginal effect
calculation in the sample selection model. Based on the procedure given by Yen and Rosinski (2008),
the conditional mean of the dependent variable y is:
(
)
(
)
(
) ( )
2
˙˙˙
/
E y y x
z z
β σ
α σρ α
> = ′ +
Φ ′ + Φ ′ …(4)
Since the marginal probability of a positive
Online ISSN : 0976-4666
(
)
( )
Pr y>0 = Φ ′zα …(5)
the unconditional mean of y is:
( )
exp(
2/ 2)
(
)
E y = x′β σ+ Φ z′α σρ+ …(6)
Differentiating Equations (4), (5) and (6) gives the marginal effects on probability, conditional mean
and unconditional mean of a common element of
x and z (say xj = zj):
(
)
( )
Pr y 0 / xj φ α αz j
∂ > ∂ = ′ …(7)
(
)
( )
(
)
{
( ) (
)
( ) (
)
(
)
}
2
2
| 0 /
exp / 2 [
j
j j
E y y x z
x z z
z z z
α ℜℜℜ
φ α α σρ α α σρ β
−
∂ > ∂ = Φ ′
+ Φ +
′ ′ ′
− ′ Φ ′ + + Φ ′ + …(8)
( )
(
)
(
)
(
)
2
/ exp / 2
j
j j
E y x x
z z
β σ
φ α σρ α α σρ β
∂ ∂ = ′ +
′ + + Φ ′ +
…(9)
These marginal effects can be evaluated at data points of interest, such as the sample means of explanatory variables.
Variables Selection
Heckman sample selection (ML) model was estimated for each millet consumption individually. Quantity consumed of these millets (in kg) was taken as the dependent variable rather than expenditure.
Based on the equation (1), the dependent variable refers to the natural logarithm of the quantity
of millets consumed by a household in a year.
Independent variables are as follows: prices1 of
millets and other food groups (in rupees), monthly
per capita income2 (in rupees), household size (in
numbers), age of household head (in years), and
1Price response was obtained on the basis of unit values. Unit price
for different food groups was derived by dividing the value of these food items by total quantity consumed by a particular respondent in a region. Price for these food items which is not consumed by any respondent in a region was given the average price of the corresponding region. The use of the unit value as a price for a food item have been thoroughly applied by Deaton (1990; 1997), Crawford et al. (2003) and Kedir (2005). The prices of the food
items were deflated with consumer prices index (CPI) of respective
years to convert them into real term.
2We used total monthly per capita expenditure on food and non-food
commodities as a proxy for per capita income.
dummy variables for education level3, gender of
household head (1 for woman headed households and 0 for man headed households), presence of dwelling units (1 for owning dwelling units and 0 for non-owning), presence of regular salary earners (1 for having regular salary earners and 0 for not having), intercept dummy for own production of millets (1 for own production of millets and 0 for others), for possibility of having food away from
home (FAFH) (1 for FAFH and 0 for others), for
time period (1 for the households in 2011-12 and 0 for households in 2004-05) and for economic
classes4. Choosing independent variables is one of
the important empirical issues in the estimation of
Heckman regression model. As in the other sample
selection model, we used exclusion conditions to
identify the model parameters. Although there is no a priory exclusion conditions for the current samples, we excluded the age variable in the consumption
equation which was used in the selection equation. Use of such different sets of variables in the two equations ensures that the model is identified. Stata
version 13.0 was used to estimate the log likelihood function of the Heckman sample selection model.
RESULTS AND DISCUSSION
Profile of Socio-economic Characters and Millet Consumption of Sample Households
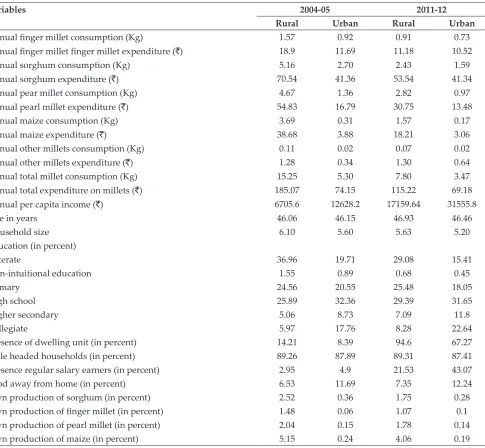
Descriptive statistics of millet consumption
profile and related variables pertaining to sample
households are presented in Table 1. It is observed that, sorghum occupied larger proportion of total
millet consumption in terms of both quantity and
value. Pearl millet was the second predominantly consumed millet in India. It is assumed that millets are treated as inferior commodities and their consumption would decrease as income increases. During 2004-05, average annual per capita income
3Education levels- illiterates, non-institutional education, primary
education, high schooling, higher secondary and collegiate and above.
4We used state wise poverty line to classify the entire sample size
as poor, middle and high income class. For this, poverty estimates,
released by the Planning Commission, Government of India for 2004-05 and 2011-12 were used for each individual states.
was ` 6705 for rural households and ` 12628.2 urban
households, whereas the corresponding figures for
the year 2011-12 were ` 17159.64 and ` 31555.8.
Real income has increased in both rural and urban areas, but the per capita income of the rural people about 50 percent lesser than the urban household income. On an average, during 2004-05, Indian rural households consumed 5.16, 4.67, 3.69 and 1.57 kg
per year of sorghum, pearl millet, maize and finger
millet, respectively. Whereas urban households consumed 2.7, 1.36, 0.31 and 0.92 kg of the same
millets during the same period. A comparison of
millet consumption during 2004-05 and 2011-12
revealed that there was a declining trend in the
millet consumption pattern over the period. Millet
consumption has decreased by nearly 50 percent in rural areas and 35 percent in urban areas during the year 2011-12 over the year 2004-05. Further, rural households are considered as the largest
consumer than urban households, and the difference
between rural and urban households in total millet consumption was nearly 10 kg in 2004-05 and 4 kg in 2011-12. Hence, higher income and urbanization have led to reduced consumption of millets. The average year of age of household head was 46
in both rural and urban regions. Education level is
Table 1: Descriptive statistics of millet consumption and related variables
Variables 2004-05 2011-12
Rural Urban Rural Urban
Annual finger millet consumption (Kg) 1.57 0.92 0.91 0.73
Annual finger millet finger millet expenditure (`) 18.9 11.69 11.18 10.52
Annual sorghum consumption (Kg) 5.16 2.70 2.43 1.59
Annual sorghum expenditure (`) 70.54 41.36 53.54 41.34
Annual pear millet consumption (Kg) 4.67 1.36 2.82 0.97
Annual pearl millet expenditure (`) 54.83 16.79 30.75 13.48
Annual maize consumption (Kg) 3.69 0.31 1.57 0.17
Annual maize expenditure (`) 38.68 3.88 18.21 3.06
Annual other millets consumption (Kg) 0.11 0.02 0.07 0.02
Annual other millets expenditure (`) 1.28 0.34 1.30 0.64
Annual total millet consumption (Kg) 15.25 5.30 7.80 3.47
Annual total expenditure on millets (`) 185.07 74.15 115.22 69.18
Annual per capita income (`) 6705.6 12628.2 17159.64 31555.8
Age in years 46.06 46.15 46.93 46.46
Household size 6.10 5.60 5.63 5.20
Education (in percent)
Illiterate 36.96 19.71 29.08 15.41
Non-intuitional education 1.55 0.89 0.68 0.45
Primary 24.56 20.55 25.48 18.05
High school 25.89 32.36 29.39 31.65
Higher secondary 5.06 8.73 7.09 11.8
Collegiate 5.97 17.76 8.28 22.64
Presence of dwelling unit (in percent) 14.21 8.39 94.6 67.27
Male headed households (in percent) 89.26 87.89 89.31 87.41
Presence regular salary earners (in percent) 2.95 4.9 21.53 43.07
Food away from home (in percent) 6.53 11.69 7.35 12.24
Own production of sorghum (in percent) 2.52 0.36 1.75 0.28
Own production of finger millet (in percent) 1.48 0.06 1.07 0.1
Own production of pearl millet (in percent) 2.04 0.15 1.78 0.14
Own production of maize (in percent) 5.15 0.24 4.06 0.19
Online ISSN : 0976-4666
classified into six groups. Around 37 percent of the
head of the households in rural areas were illiterate in 2004-05 whereas only around 18 percent of the household heads were illiterate in urban regions in the same period. In the country, primary and high school level education together, shared more than 50 percent in all the periods. Household head having higher secondary and collegiate level education was more in urban regions than rural region. It is a worthy to notice that there was declining trend in the share of illiterate considerably in both the regions. More than 85 percent of household head were male and they are the main decision maker in the household. Households having regular salary earners were more in urban region in both period and it increased tremendously in both regions in 2011-12. Nowadays, having food away from home is a common practice followed by Indian households. Households owning dwelling units were more in rural regions than urban regions and more in
2011-12 over 2004-05. Also, the share of households
having food away from home in both regions increased remarkably in 2011-12. It was practiced by 6.53 percent households in rural regions in 2004-05 whereas it was 11.69 percent in urban regions during the same period. Households producing the millets in their own farm were more in rural regions than the urban region and the trend decreased in 2011-12. Own production of millet in the farms
ensures more quantity consumption.
Estimation results of Heckman Sample
Selection Model
In this section, we discuss the results of the estimated functional relationship between the
quantity consumed of different millets and the independent variables which affect consumption
behavior of millets at the household level. For this, we employed Heckman sample selection model because the data set used for the analysis consisted of zero expenditure for many households. The results of ML estimation for pearl millet and maize show that the estimated error correlation
coefficient (ρ) between selection and consumption
equations and its corresponding covariance term
(λ) are significant. Besides, Likelihood Ratio (LR)
test rejected independence of the error terms of
the selection and consumption equations. But, in the case of finger millet and sorghum, LR test did
not reject independence of the error terms of the
selection and consumption equations. All these
suggest the importance of selectivity correction in the present analysis of pearl millet and maize
consumption. Most of the estimated coefficients in both the selection and consumption equations of these millets were statistically significant (Appendix
I).
With the separate equations to accommodate
sample selection and level, and with the logarithmic transformation in the dependent variable, the
effects of explanatory variables on the probability
and the level of consumption are non-trivial. Further, as discussed in the methodology section, marginal effects on probability, conditional and
unconditional levels (Equations 7, 8 and 9) were
worked out to explore the impacts of household characters on the probability of preference and
the quantity of millet consumption. The effects on
the conditional level explain what makes those consuming millets consume either more or less i.e.,
the conditional marginal effects measure how the consumption of millets changes due to a specific
independent variable for current millet consumers. The effects on probability explain the binary
decision on consumption, viz., to consume or not
to consume, i.e., the marginal effects of probability
measure how those consumers who are at zero consumption start consuming millets due to the
influence of independent variables. The effects of
unconditional level provide an overall assessment of what contributes to a consumption level by increasing (or decreasing) either the probability or conditional level.
Impact of Changes in the Own Price of Different Millets on Household Consumption
To assess the impact of independent variables on
the given millets consumption, marginal effect was
calculated using the maximum likelihood results obtained from the Heckman sample selection
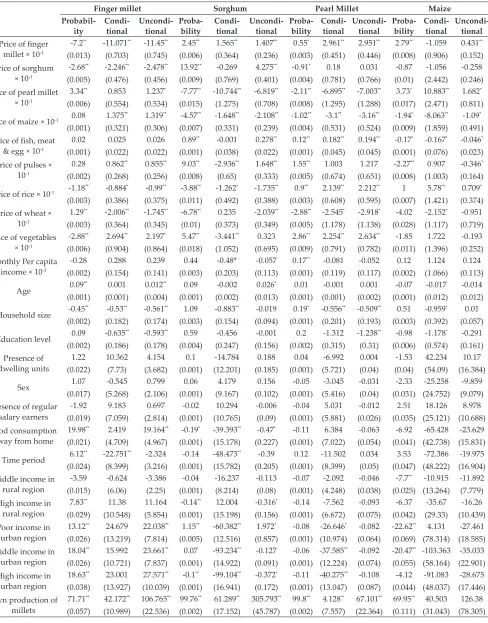
model. The respective estimated marginal effects
on probability, conditional and unconditional
levels for finger millet, sorghum, pearl millet and maize are presented in Table 2. Except sorghum,
own price of all the millets significantly affects the consumption probability of these millets. For
instance, an increase in the price of finger millet by
Table 2: Determinants (Marginal effect) of consumption probability and demand for finger millet, sorghum, pearl
millet and maize
Finger millet Sorghum Pearl Millet Maize
Probabil
-ity Condi-tional Unconditional - Probability- Condi-tional Unconditional - Probability- Condi-tional Unconditional - Probability- Condi-tional Unconditional
-Price of finger
millet × 10-1
-7.2** (0.013) -11.071** (0.703) -11.45** (0.745) 2.45** (0.006) 1.565** (0.364) 1.407** (0.236) 0.55* (0.003) 2.961** (0.451) 2.951** (0.446) 2.79** (0.008) -1.059 (0.906) 0.431** (0.152) Price of sorghum
× 10-1
-2.68** (0.005) -2.246** (0.476) -2.478** (0.456) 13.92** (0.009) -0.269 (0.769) 4.275** (0.401) -0.91* (0.004) 0.18 (0.781) 0.031 (0.766) -0.87 (0.01) -1.056 (2.442) -0.258 (0.246) Price of pearl millet
× 10-1
3.34** (0.006) 0.853 (0.554) 1.237* (0.534) -7.77** (0.015) -10.744** (1.275) -6.819** (0.708) -2.11** (0.008) -6.895** (1.295) -7.003** (1.288) 3.73* (0.017) 10.883** (2.471) 1.682* (0.811)
Price of maize × 10-1 0.08 (0.001) 1.375** (0.321) 1.319** (0.306) -4.57** (0.007) -1.648** (0.331) -2.108** (0.239) -1.02** (0.004) -3.1** (0.531) -3.16** (0.524) -1.94* (0.009) -8.063** (1.859) -1.09* (0.491)
Price of fish, meat
& egg × 10-1
0.02 (0.001) 0.025 (0.022) 0.026 (0.022) 0.89** (0.001) -0.001 (0.038) 0.278** (0.022) 0.12** (0.001) 0.182** (0.045) 0.194** (0.045) -0.17* (0.001) -0.167* (0.076) -0.046* (0.023) Price of pulses ×
10-1 0.28 (0.002) 0.862** (0.268) 0.855** (0.256) 9.03** (0.008) -2.936** (0.65) 1.648** (0.333) 1.55** (0.005) 1.003 (0.674) 1.217 (0.651) -2.27** (0.008) 0.907 (1.003) -0.346* (0.164)
Price of rice × 10-1 -1.18** (0.003) -0.884* (0.386) -0.99** (0.375) -3.88** (0.011) -1.262* (0.492) -1.735** (0.388) 0.9** (0.003) 2.139** (0.608) 2.212** (0.595) 1 (0.007) 5.78** (1.421) 0.709* (0.374) Price of wheat ×
10-1 1.29** (0.003) -2.006** (0.364) -1.745** (0.345) -6.78** (0.01) 0.235 (0.373) -2.039** (0.349) -2.88** (0.005) -2.545* (1.178) -2.918* (1.138) -4.02 (0.028) -2.152* (1.117) -0.951 (0.719) Price of vegetables
× 10-1
-2.88** (0.006) 2.694** (0.904) 2.197* (0.864) 5.47** (0.018) -3.441** (1.052) 0.323 (0.695) 2.86** (0.009) 2.254** (0.791) 2.634** (0.782) -1.85 (0.011) 1.722 (1.396) -0.193 (0.252) Monthly Per capita
income × 10-3
-0.28 (0.002) 0.288 (0.154) 0.239 (0.141) 0.44 (0.003) -0.48* (0.203) -0.057 (0.113) 0.17** (0.001) -0.081 (0.119) -0.052 (0.117) 0.12 (0.002) 1.124 (1.066) 0.124 (0.113)
Age 0.09**
(0.001) 0.001 (0.001) 0.012** (0.004) 0.09 (0.001) -0.002 (0.002) 0.026* (0.013) 0.01 (0.001) -0.001 (0.001) 0.001 (0.002) -0.07 (0.001) -0.017 (0.012) -0.014 (0.012) Household size -0.45**
(0.002) -0.53** (0.182) -0.561** (0.174) 1.09 (0.003) -0.883** (0.154) -0.019 (0.094) 0.19* (0.001) -0.556** (0.201) -0.509** (0.193) 0.51 (0.003) -0.959* (0.392) 0.01 (0.057)
Education level 0.09
(0.002) -0.635** (0.186) -0.593** (0.178) 0.59 (0.004) -0.456 (0.247) -0.001 (0.156) 0.2 (0.002) -1.312 (0.315) -1.238** (0.31) -0.98 (0.006) -1.178* (0.574) -0.291 (0.161) Presence of dwelling units 1.22 (0.022) 10.362 (7.73) 4.154 (3.682) 0.1 (0.001) -14.784 (12.201) 0.188 (0.185) 0.04 (0.001) -6.992 (5.721) 0.004 (0.04) -1.53 (0.04) 42.234 (54.09) 10.17 (16.384) Sex 1.07 (0.017) -0.545 (5.268) 0.799 (2.106) 0.06 (0.001) 4.179 (9.167) 0.156 (0.102) -0.05 (0.001) -3.045 (5.416) -0.031 (0.04) -2.33 (0.031) -25.258 (24.752) -9.859 (9.079) Presence of regular
salary earners -1.92 (0.019) 9.183 (7.059) 0.697 (2.814) -0.02 (0.001) 10.294 (10.765) -0.006 (0.09) -0.04 (0.001) 5.031 (5.881) -0.012 (0.026) 2.51 (0.035) 18.126 (25.121) 8.978 (10.688) Food consumption
away from home
19.98** (0.021) 2.419 (4.709) 19.164** (4.967) -0.19* (0.001) -39.393** (15.178) -0.47* (0.227) -0.11 (0.001) 6.384 (7.022) -0.063 (0.054) -6.92 (0.041) -65.428 (42.738) -23.629 (15.831)
Time period 6.12**
(0.024) -22.751** (8.399) -2.324 (3.216) -0.14 (0.001) -48.473** (15.782) -0.39 (0.205) 0.12 (0.001) -11.502 (8.399) 0.034 (0.05) 3.53 (0.047) -72.386 (48.222) -19.975 (16.904) Middle income in
rural region -3.59 (0.015) -0.624 (6.06) -3.386 (2.25) -0.04 (0.001) -16.237 (8.214) -0.113 (0.08) -0.07 (0.001) -2.092 (4.248) -0.046 (0.038) -7.7** (0.025) -10.915 (13.264) -11.892 (7.779) High income in
rural region 7.83** (0.029) 11.38 (10.548) 11.164 (5.854) -0.14** (0.001) 12.004 (15.198) -0.316* (0.156) -0.14 (0.001) -7.562 (6.672) -0.093 (0.075) -6.37 (0.042) -35.67 (29.33) -16.26 (10.439) Poor income in
urban region 13.12** (0.026) 24.679 (13.219) 22.038** (7.814) 1.15** (0.005) -60.382** (12.516) 1.972* (0.857) -0.08 (0.001) -26.646* (10.974) -0.082 (0.064) -22.62** (0.069) 4.131 (78.314) -27.461 (18.585) Middle income in
urban region 18.04** (0.026) 15.992 (10.721) 23.661** (7.837) 0.07 (0.001) -93.234** (14.922) -0.127 (0.091) -0.06 (0.001) -37.585** (12.224) -0.092 (0.074) -20.47** (0.055) -103.363 (58.164) -35.033 (22.901) High income in
urban region 18.63** (0.038) 23.001 (13.927) 27.571** (10.039) -0.1** (0.001) -99.104** (16.941) -0.372* (0.172) -0.11 (0.001) -40.275** (13.047) -0.108 (0.087) -4.12 (0.044) -91.083 (48.037) -28.675 (17.446) Own production of
Online ISSN : 0976-4666
7.2 percent. Similarly, the consumption probability of pearl millet and maize was reduced by 2.11 and 1.94 percent, respectively, when own prices of these
millets increase by ` 10 per kg.
Conditional (current consumers) and unconditional
(average consumers) level consumption of finger
millet, pearl millet and maize were inversely related to increased prices of their own. For example, the conditional and unconditional annual
consumption of finger millet in India are expected
to reduce by 11.07 kg and 11.45 kg, respectively,
when ` 10 increases in the own price of the finger
millet. Similarly, the quantity consumed of pearl
millet and maize decreased by 6.89 kg and 8.06 kg at conditional level and 7.00 kg and 1.09 kg at unconditional level, respectively, as the own prices
of pearl millet and maize increase by ` 10 (Table 2).
Impact of Changing Cross Prices and Income on Millet Consumption
An increase in the price of finger millet leads to
higher consumption probability and demand for all other millets. Similarly, increased price of pearl
millet causes increased consumption of finger millet and maize and increased price of maize influences
the consumption of finger millet positively. It revealed that there was a substitution relationship
between finger millet and pearl millet; and between finger millet and maize.
The increased price of fish, meat and egg increased
the probability of consuming pearl millet and decreased the maize consumption. The increased price of rice was less likely to consume and
demand finger millet and sorghum. Probability and
consumption demand for all millets was less when the price of wheat increases further.
There was no significant impact of increased income on the millet consumption. All coefficients are non-significant except current consumption of sorghum
and the probability of more consumption of pearl millet. The less impact of income on the millet consumption and complementary nature with rice and wheat may be due to smaller budget share of millets to total expenditure. This indicates that all millets are treated as inferior goods and there was a changing food habits and taste within the food system not including millets (Table 2).
Impact of Changes in Household Level Characters on Millet Consumption
As age of household head increases, the consumption
probability and demand for finger millet and sorghum increased. Household size was inversely
related to the consumption of finger millet, sorghum and pearl millet. Education level was also inversely related to the consumption of finger millet, pearl
millet and maize. Habit of eating food away from home increases the choice probability and
demand for finger millet whereas it reduced the
choice probability of demand for sorghum. When compared to the year 2004-05, there was a more
probability to consume finger millet in 2011-12 but quantity consumed has decreased over the years.
When compared to the poor people in rural regions, high income groups in rural areas and all income groups in urban areas were more likely to consume
finger millet. Also, quantity demand of finger millet
was more among these income groups. In the case of sorghum and pearl millet, only urban income groups show significant relationship between
income and quantity consumed but the relationship was negative. All these indicate that sorghum and
pearl millet were not preferred by urban consumers, while they were favourable towards consuming
finger millet. This is possibly because of the fact that finger millet is available in the form of flour for long time while availability of flour form of sorghum and pearl is limited. All the millets have higher probability and quantity consumption when
they are produced in the own farm of households.
CONCLUSION
More emphasis is being placed on production and consumption of millets in recent times for
many reasons. As climate change is going to
impact food security through reduced yield of rice due to increase in temperature and increased
frequency of flood / drought, future food security
has to lean on millets which are more resilient to bio-physical stresses. Further, the nutritional
benefits of millets has brought millets to the centre
stage as a major contributor to the nutritional security of the households. This study has made an attempt to understand the factors affecting the demand for millets in rural and urban areas.
The own price effects for all millets were negative
consume when own prices of these millet increases.
Analysis of cross price effects indicates that increase in the price of finger millet leads to higher
consumption probability and demand for all other millets. Similarly, increased price of pearl millet
causes increased consumption of finger millet and maize and increased price of maize influences the consumption of finger millet positively. Though
most of the household categories preferred to
consume finger millet over the other millets, finger
millet was found to be substituted by pearl millet
and maize, in the event of rise in finger millet prices.
Income was not the main factor determining the amount of millet consumption, probably because millets are the traditional staples for low income households, while high income groups have also started consuming millets in recent times due to the health concerns arising out of consuming major millets. Region-wise preference of millets indicates
that finger millet is preferred by the urban people
while other millets are less likely to be consumed
in urban as compared to the rural poor. Among the
household characteristics, age of the household head has a positive relationship with millet consumption. This might be due to the importance given for the traditional food values by the old aged people. Contrastingly, higher education level has a negative relationship with the consumption of millets. This could be because of consumption of high value commodities like polished rice or wheat, acts as a societal prestige at one end when compared to the consumption of so-called inferior good like millets. In order to increase the consumption of millets, awareness should be created explicitly among the children and youth about the superior level of millets in nutritional chart. Besides, like the major cereals such as rice and wheat, millets could be supplied in the Public Distribution System (PDS). Since the study results showed the inverse relationship between consumption of millets and its own price, supplying millets in PDS at a fair price would boost both the production and consumption of millets. Value addition and modernization of the
processing sector of millets may benefit the urban
and high-income households to consume more
quantity of millets or millets-based food products.
Improvement and dissemination of post-harvest processing technologies related to millets in rural areas may create employment and agribusiness
opportunities.
REFERENCES
Basavaraj, G., Parthasarathy Rao, P., Bhagavatula, S. and
Ahmed, W. 2010. Availability and Utilisation of Pearl
Millet in India. Journal of SAT Agricultural Research, 8: 1-6.
Bergamini, N.P.S., Bala, R.S. and Yenagi, Nirmala. 2013.
Minor millets in India: a neglected crop goes mainstream. In: Diversifying Food and Diets: Using Agricultural
Biodiversity to Improve Nutrition and Health, Biodiversity,
Eds. D. Fanzo., T. Hunter., F. Borelli. and Mattei, Journal of International, Rome, 313–325.
Chand, R. 2007. Demand for Food grains. Economic & Political Weekly, 42(52): 10-13.
Chandrakanth, M.G. and Akarsha, B.M. 2011. Green Development for Sustainable Agriculture. FKCCI Journal, Karnataka.
Chatterjee, S., Rae, A. and Ray, R. 2006. Food consumption, trade reforms and trade patterns in contemporary India: How do Australia and NZ fit in?. In: Conference Paper, Massy University, New Zealand: Department of Applied and International Economics.
Cheah, Y.K. and Tan, A.K. 2014. Determinants of leisure-time physical activity: Evidence from Malaysia. The Singapore Economic Review, 59(02): 1450017.
Chengappa, P.G., Achoth, L., Mukherjee, A., Reddy, B.R., Ravi, P.C. and Dega, V. 2007. Evolution of food retail chains in
India. Agricultural Diversification and Smallholders in South
Asia, New Delhi, Academic Foundation.
Crawford, I., Laisney, F. and Preston, I. 2003. Estimation of
household demand systems with theoretically compatible
Engel curves and unit value specifications, Journal of Econometrics, 114(2): 221-241.
Deaton, A. 1990. Price elasticities from survey data: extensions
and Indonesian results, Journal of Econometrics, 44(3):
281-309.
Deaton, A. 1997. The analysis of household surveys: a
micro-econometric approach to development policy. World Bank Publications.
Frison, E.A., Smith, I.F., Johns, T., Cherfas, J. and Eyzaguirre, P.B. 2006. Agricultural biodiversity, nutrition and health:
Making a difference to hunger and nutrition in the developing world. Food and Nutrition Bulletin, 27: 167–179.
Green, G.M. and Park, J.L. 1998. Retail demand for whole vs.
low-fat milk: new perspectives on loss leader pricing. In: Annual Meeting of the American Agricultural Economics Association held at Salt Lake City, UT.
Greene, W. 2007. Econometric analysis. Prentice Hall, New York.
Hatirli, S.A., Ozkan, B., Aktas, A.R. 2004. Factors affecting fluid milk purchasing sources in Turkey. Food Quality and Preference, 15(6): 509-515.
Online ISSN : 0976-4666
Hsu J.L. and Kao, J.S. 2001. Factors affecting consumers’ fluid milk purchasing patterns in Taiwan: product comparisons
and marketing implications. Journal of Food Products Marketing, 7(3): 41-51.
Jones, E. and Akbay, C. 2000. An analysis of consumers’ purchasing behavior for high-and low-fat milk: A focus
on healthy drinking. Journal of Food Distribution Research,
31(1): 124-131.
Kanjilal, B., Mazumdar, P.G., Mukherjee, M. and Rahman,
M.H. 2010. Nutritional status of children in India:
household socio-economic condition as the contextual determinant. International Journal for Equity in Health, 9–19.
Kedir, A.M. 2005. Estimation of own-and cross-price elasticities using unit values: econometric issues and evidence from urban Ethiopia. Journal of African Economies,
14(1): 1-20.
Kumar, Praduman, Mruthyunjaya and Dey, Madan M. 2007. Long-term changes in food basket and nutrition in India. Economic and Political Weekly, 3567-3572.
Kumar, A., Joshi, P.K., Kumar, P. and Parappurathu, S. 2014.
Trends in the consumption of milk and milk products in
India: implications for self-sufficiency in milk production,
Food Security, 6(5): 719-726.
Kumar, P., Kumar, A., Parappurathu, S. and Raju, S.S. 2011. Estimation of demand elasticity for food commodities in
India. Agricultural Economics Research Review, 24(1): 1-14. Lapar, M.L.A., Choubey, M., Patwari, P., Kumar, A.,
Baltenweck, I., Jabbar, M.A. and Staal, S. 2010. Consumer preferences for attributes of raw and powdered milk in Assam, Northeast India. ILRI, pp. 103.
Lata, C., Gupta, S. and Prasad, M. 2013. Foxtail millet: a model
crop for genetic and genomic studies in bioenergy grasses. Critical Review in Biotechnology, 33: 328–343.
Mittal, S. 2007. What affects changes in cereal consumption?,
Economic and Political Weekly, 42(5): 444-447.
Mittal, S. 2010. Application of the QUAIDS model to the
food sector in India. Journal of Quantitative Economics,
8(1): 42-54.
Muthamilarasan, M., Dhaka, A., Yadav, R. and Prasad, M. 2015. Exploration of millet models for developing nutrient
rich Graminaceous crops, Plant Science. http://dx.doi.
org/10.1016/j.plantsci.2015.08.023.
NAAS, 2013. Role of Millets in Nutritional Security of India.
Policy Paper No. 66, National Academy of Agricultural Sciences, New Delhi: 16p.
Nagarajan, Latha., Smale, Melinda. and Glewwe, Paul. 2005. Comparing farm and village-level determinants of millet
diversity in marginal environments of India: the context
of seed systems. International Food Policy Research Institute, Discussion paper 139.
Padulosi, S. and Hoeschle-Zeledon, I. 2004. Underutilized
plant species: what are they?, LEISA, 20(1): 56.
Pazarlioglu, M.V., Miran, B., Üçdoğruk, S. and Abay, C. 2007. Using econometric modelling to predict demand for fluid and farm milk: A case study from Turkey. Food Quality and Preference, 18(2): 416-424.
Quah, S.H. and Tan, A.K. 2009. A Heckman sample selection approach to the demand for organic food products: An
exploratory study using Penang data. Journal of Food Products Marketing, 15(4): 406-419.
Radhakrishna, R. 2005. Food and nutrition security of the
poor: emerging perspectives and policy issues. Economic and Political Weekly, 40(18): 1817-21.
Rajaram, S., Zottarelli, L.K. and Sunil, T.S. 2007. Individual,
household, programme and community effects on childhood malnutrition in rural India. Maternal & Child Nutrition, 3(2): 129–140.
Rao, P.P., Basavaraj, G., Bhagavatula, S. and Ahmed, W. 2009. An Analysis of Availability and Utilisation of Sorghum
Grain in India, Journal of SAT Agricultural Research 8. Sakamoto, S. 1982. Waxy endosperm and perisperm of cereals
and grain Amaranth and their geographical distribution.
Journal of the Japanese Society of Starch Science, 29: 41–59.
Schmit, T.M., Dong, D., Chung, C., Kaiser, H.M. and Gould,
B.W. 2002. Identifying the effects of generic advertising on the household demand for fluid milk and cheese: a
two-step panel data approach. Journal of Agricultural and Resource Economics, 27(1): 165-186.
Smith, I.F. 1982. Leafy vegetables as source of minerals in southern Nigerian diets. Nutrition Report International,
26:679–688.
Smith, I.F. and Longvah, T. 2009. Mainstreaming the use of nutrient-rich underutilized plant food resources in diets can positively impact on family food and nutrition
security – data from Northeast India and West Africa. Acta Horticulturae, 806:375–384.
Tobin, J. 1958. Estimation of relationships for limited dependent
variables. Econometrica: Journal of the Econometric Society,
26(1): 24-36.
Vasileska, A. and Rechkoska, G. 2012. Global and regional food consumption patterns and trends. Procedia-Social and Behavioral Sciences, 44: 363-369.
Yen, S.T. and Rosinski, J. 2008. On the marginal effects of
variables in the log-transformed sample selection models.
Appendix I
Estimated Heckman Sample Selection (Maximum Likelihood) model
Variables Finger millet Sorghum Pearl millet Maize
Selection Consumption Selection Consumption Selection Consumption Selection Consumption
Price of finger millet ×
10-1
-0.266**
(0.026) -0.174
**
(0.038) 0.359
**
(0.02) -0.003
**
(0.025) -0.124
**
(0.039) 0.01** (0.05) -0.054
**
(0.058) -0.044* (0.134)
Price of sorghum × 10-1 0.332**
(0.038) 0.065** (0.044) -0.201
**
(0.039) -0.345 (0.041) -0.287
**
(0.059) -0.439 (0.071) (0.065)0.23 0.526 (0.1)
Price of pearl millet × 10-1 0.008**
(0.01) 0.108 (0.024) -0.118
**
(0.017) -0.055
**
(0.011) -0.14
**
(0.024) -0.198
**
(0.034) -0.119
**
(0.051) -0.401
**
(0.127)
Price of maize × 10-1 -0.714
(0.06) -0.863
**
(0.042) 0.063
**
(0.015) 0.051** (0.012) 0.075
**
(0.021) 0.188** (0.026) 0.172
*
(0.026) -0.095** (0.05)
Price of fish, meat & egg
× 10-1
0.002
(0.002) 0.002 (0.002) 0.023
**
(0.002) 0.001 (0.002) 0.016
**
(0.002) 0.012** (0.003) -0.011
**
(0.003) -0.007 (0.005)
Price of pulses × 10-1 0.027
(0.018) 0.068** (0.022) 0.233
**
(0.018) -0.09** (0.021) 0.212
**
(0.026) 0.067 (0.043) -0.14
**
(0.031) 0.08 (0.052)
Price of rice × 10-1 -0.117**
(0.024) -0.069* (0.031) -0.1
**
(0.029) -0.042
**
(0.016) 0.123
**
(0.026) 0.137** (0.036) 0.062
*
(0.032) 0.293** (0.073)
Price of wheat × 10-1 0.128**
(0.015) -0.159
**
(0.025) -0.175
**
(0.022) 0.005 (0.013) -0.392
**
(0.067) -0.167* (0.075) -0.248
**
(0.094) -0.059
**
(0.041)
Price of vegetables × 10-1 -0.285**
(0.043) 0.214** (0.067) 0.141
*
(0.045) -0.107
**
(0.034) 0.39
**
(0.073) 0.149** (0.052) -0.114 (0.065) 0.118 (0.07) Monthly Per capita
income × 10-3
-0.028
(0.016) 0.023 (0.012) (0.007) -0.0160.012 * (0.007) 0.023
**
(0.007) -0.005 (0.008) (0.01)0.008 0.058 (0.06)
Age (0.002)0.009** - (0.002)0.003* (0.002)0.001 (0.003)-0.004
Household size -0.044(0.009)** -0.042(0.015)** (0.007)0.028** -0.028(0.005)** (0.009)0.026** -0.035(0.012)** (0.014)0.032** -0.058(0.019)**
Education level (0.011) -0.050.009 ** (0.014) 0.016
(0.01) -0.015 (0.008) (0.014) -0.082 (0.018)0.027 -0.061
**
(0.021) -0.049 (0.03) Presence of dwelling
units (0.062)0.036 0.108 (0.07) (0.06)0.111 -0.06 (0.056) (0.086) -0.112 (0.112)0.046 (0.117)-0.045 0.305 (0.262)
Sex (0.05)0.032 -0.008 (0.059) (0.046)0.071 0.019 (0.038) (0.07)-0.07 -0.059 (0.083) (0.088) -0.217 (0.168)-0.069
Presence of regular
salary earners (0.057)-0.058 0.1 (0.066) (0.049)-0.017 0.041 (0.041) (0.065)-0.054 0.07 (0.082) (0.094)0.071 0.124 (0.151) Food consumption away
from home 0.531
**
(0.046) 0.01 (0.052) -0.429
**
(0.056) -0.185
**
(0.069) -0.23
**
(0.083) 0.068 (0.098) (0.123) -0.718 (0.394)-0.212
Time period (0.068)0.173* -0.297(0.079)** -0.266(0.062)** -0.227(0.063)** (0.101) -0.184 (0.126)0.139 (0.135)0.099 -0.911(0.276)**
Middle income in rural
region -0.11
*
(0.045) -0.004 (0.068) (0.039) -0.07-0.046 * (0.035) -0.124
*
(0.052) -0.05 (0.07) -0.238
**
(0.073) -0.045 (0.107) High income in rural
region 0.219
*
(0.075) 0.112 (0.099) -0.253
**
(0.065) 0.043 (0.059) -0.336
**
(0.091) -0.171 (0.113) (0.138) -0.304 (0.272)-0.194 Poor income in urban
region 0.358
**
(0.061) 0.231** (0.106) 0.619
**
(0.053) -0.27** (0.042) (0.101)-0.135 -0.566* (0.23) -0.922
**
Online ISSN : 0976-4666
Middle income in urban
region 0.483
**
(0.057) 0.148 (0.092) (0.054)0.077 -0.477
**
(0.044) (0.077)-0.098 -0.918
**
(0.107) -0.783
**
(0.124) -1.677
**
(0.344) High income in urban
region 0.497
**
(0.089) 0.212* (0.109) (0.082)-0.151 -0.522
**
(0.075) -0.227
*
(0.106) -1.046
**
(0.129) (0.142) -1.33-0.123 * (0.535) Own production of
millets 203.139
**
(0) 0.329** (0.077) 9.159
**
(0.111) 0.299** (0.039) 125.164
**
(0.00) 0.489** (0.102) 13.795
**
(1.068) -0.051 (0.188)
Constant -0.575(0.167) 4.244** ** (0.196) -2.82**
(0.151) 5.198** (0.16) -2.868
**
(0.241) 3.36** (0.364) (0.317) 4.692-0.523 ** (0.601)
Rho (ρ) (0.053)-0.058 (0.034)0.036 (0.064)0.162** -0.281(0.083)**
Sigma (σ) (0.014)0.791** 0.678(0.01)** (0.018)0.85** (0.033)0.954**
Lambda (λ) (0.042)-0.046 (0.023)0.025 (0.056)0.138** -0.268(0.083)**
Wald test of independent
of equations (rho=0) chi2 1.19 1.14 6.2* 10.27**