Scientia Iranica B (2015) 22(4), 1517{1533
Sharif University of Technology
Scientia IranicaTransactions B: Mechanical Engineering www.scientiairanica.com
Ecient packet replication control for a geographical
routing protocol in sparse vehicular delay tolerant
networks
I.-C. Chang
a;, C.-H. Li
aand C.-F. Chou
ba. Department of Computer Science and Information Engineering, National Changhua University of Education, Changhua, Taiwan. b. Department of Computer Science and Information Engineering, National Taiwan University, Taipei, Taiwan.
Received 22 May 2014; received in revised form 20 October 2014; accepted 2 December 2014
KEYWORDS Vehicular ad hoc network;
Vehicular delay tolerant network; Controlled replication; Binary spraying; IG-Ferry; Delay evaluation function.
Abstract. To date, many vehicular ad hoc network unicast routing protocols have been proposed to support ecient packet transmission between vehicles in urban environments. However, when there is insucient vehicle density during non-rush hour times, the vehicular ad hoc network is often intermittently connected. These unicast routing protocols, therefore, perform poorly when forwarding packets over this vehicular disruption tolerant network. This paper adopts the controlled replication approach, in a proposed IG-Ferry routing protocol, to spray a limited number of packet copies, denoted by packet token values, to relay vehicles in a vehicular disruption tolerant network. We then identify three kinds of relay vehicle, i.e. direct buses, non-direct buses and private cars according to their travel itineraries. Based on the proposed delay evaluation function for the three types of intermediate vehicle, the IG-Ferry packet spraying mechanism, instead of that of traditional binary spraying, can eciently spray appropriate packet tokens to vehicles. Finally, intensive NS2 simulations are conducted using the realistic Shanghai city vehicle trac trace, IEEE 802.11p protocol, with EDCA and the Nakagami radio propagation model, to show that IG-Ferry outperforms three well-known VDTN routing protocols, in terms of average packet delivery ratios, end-to-end transmission delays and packet replication overheads, with respect to various combinations of ve communication parameters. © 2015 Sharif University of Technology. All rights reserved.
1. Introduction
In order to achieve ecient unicast routing in vehicular ad hoc networks (VANETs), trac information, such as positions, direction of movement, speed and distri-bution of all vehicles and real-time trac events, are essential to derive optimal routes for multi-hop wireless packet transmission. Well-known position-based rout-ing protocols, like Greedy Perimeter Stateless Routrout-ing
*. Corresponding author. Tel.: +886-4-7232105; Fax: +886-4-7211284
E-mail addresses: [email protected] (I.-C. Chang); [email protected] (C.-H. Li); [email protected] (C.-F. Chou)
(GPSR) [1] and Greedy Perimeter Coordinator Rout-ing (GPCR) [2], use the greedy forwardRout-ing approach for an intermediate node to forward a packet to its direct neighbor that is known in real-time and which is closest to the geographic position of the destina-tion. However, both of them must execute the repair strategy, as with the perimeter mode of GPSR, to escape the local maximum [1] on the path where greedy forwarding fails in real-time. Vehicle-Assisted Data De-livery (VADD) [3], Road-Based using Vehicular Trac (RBVT) [4], GeoCross [5], Intersection Graph (IG) [6] etc. further improve the unicast routing performance in VANET. However, when there is low trac density during non-rush hour periods, the network is often not fully connected, with intermittent and
opportunis-tic connectivity. These unicast routing protocols, therefore, exhibit poor packet forwarding performance over these kinds of intermittently connected mobile ad hoc networks, which are called Disruption Tolerant Networks or Delay Tolerant Networks (DTN) [7,8].
DTNs feature sparse and intermittent connectiv-ity, long and variable delay, high latency, high error rates, and no stable end-to-end path [9]. To achieve packet transmission between source and destination nodes over a DTN, two types of routing approach have been proposed to overcome the characteristics of DTNs. One is the single-copy protocol that never replicates a packet [10], and the other is the multi-copy protocol that does replicate packets [11]. The single-copy protocols, like Message Ferrying [12] and GeOpps [13], usually adopt the Store-Carry-and-Forward (SCF) technique [14] to keep only a single copy of a packet in the DTN at any given time. They, there-fore, introduce a very low packet delivery ratio, but a high end-to-end packet delay. Conversely, nodes using Epidemic routing [15], one of the multi-copy protocols, continuously replicate and transmit packets to newly discovered nodes that have not already received a copy of the packet. Epidemic routing can, thus, achieve the highest packet delivery ratio in DTNs by adopting this kind of uncontrolled replication approach. However, replicating packets without any control is extremely wasteful in terms of wireless bandwidth and buer space.
Consequently, several protocols, like Spray and Wait [16], Spray and Focus [17], Selectively MAk-ingpRogress Toward delivery (SMART) [18] and GeoSpray [19], have adopted the controlled replication approach to spray a small, xed number of packet copies to dierent relay nodes. The source or the relay node uses the binary spraying scheme [16] to opportunistically forward one-half of the carried packet copies to a new contact until it meets the destination. This approach has advantages in terms of reducing the enormous resource overhead of Epidemic routing. However, protocols adopting the controlled replication approach may suer from low delivery ratios, long transmission delays and/or require extra space for storing needed information, compared to Epidemic routing.
When further considering packet routing among vehicular nodes in Vehicular Delay Tolerant Networks (VDTN) [20], dierent types of vehicle may own hetero-geneous information about their movements and cur-rent geographical locations. For example, public buses and trains know their current movement directions, schedules, stops, and their maximal allowed speeds, etc. on their strictly predened itineraries. However, taxis will not necessarily move along a xed route, even when driving to a predened destination. Additionally, privately owned vehicles, with or without navigation
systems, will not necessarily follow a planned route, or may change their destinations en route [21]. Because traditional DTN spraying protocols do not consider the heterogeneous characteristics of these vehicles, they cannot achieve optimal routing performances for VDTN.
In this paper, intermediate vehicles, which meet the vehicle carrying the packet copy, are classied into three categories in VDTN, according to their movement itineraries. The rst type is the direct bus, which can move from the contacted position to the destination. The second type is the non-direct bus, which does not leave for the destination from the contacted position. The third type is the private car, which may change its destination while travelling. Major contributions of this paper are listed as follows:
1. By extending the controlled multi-copy replication approach over the intermittently connected VDTN, we will propose the IG-Ferry protocol, instead of that of traditional binary spraying, to eciently spray appropriate packet tokens to the maximum number of relay vehicles.
2. The IG-Ferry packet spraying mechanism depends on the proposed Delay Evaluation Function (DEF) for three types of intermediate vehicle.
3. Due to short contact durations and limited wireless bandwidth between vehicles within wireless trans-mission range, we also propose the shortest remain-ing Time-To-Live (TTL) rst packet schedulremain-ing mechanism to transfer the restricted amount of packets in a contact opportunity.
4. Based on the geographical location and mobility information of heterogeneous vehicles, IG-Ferry can signicantly improve its average packet delivery ratio, reduce its average end-to-end delay and decrease its average replication overhead, compared to traditional replication-based or non-replication-based routing protocols.
The remainder of this paper is organized as follows. Related work is compared in Section 2. Details of IG-Ferry are described in Section 3. In Section 4, NS2 simulations are conducted to show that IG-Ferry outperforms four well-known VDTN protocols, i.e. Epidemic, Spray and Focus, SMART and GeoSpray in terms of average packet delivery ratios, end-to-end delays and replication overheads. Finally, conclusions and suggestions for future work are given in Section 5.
2. Related work
As mentioned above, the controlled replication ap-proach is able to reduce the enormous resource over-head introduced by the uncontrolled packet replication of Epidemic routing. Specically, the Spray and Wait
I.-C. Chang et al./Scientia Iranica, Transactions B: Mechanical Engineering 22 (2015) 1517{1533 1519
scheme initially generates L packet copies for every packet originating at a source node. The source or the relay node uses the binary spraying scheme [16] to opportunistically forward one-half of the carried packet copies to a new contact in the spray phase. In the wait phase of Spray and Wait, at most, L relay nodes carrying a packet copy forward the copy only to its destination. However, the destination suers from a low packet delivery ratio because the relay itself may not move into the wireless transmission range of the destination; even so, the packet transmission delay will be signicant. Therefore, the relay in the focus phase of the Spray and Focus scheme can forward its copy to a further relay, depending on the value calculated by a utility function, rather than waiting for the destination to be encountered. In addition, Spray and Focus adopts the value of the forwarding token to represent the number of packet copies carried by a relay, which reduces a relay buer space for storing multiple packet copies.
Selectively MAking pRogress Toward delivery (SMART) adopts repeated mobility patterns of mobile nodes, i.e. encounter histories with other nodes, to de-termine the destination's travel companions, i.e. nodes that frequently encounter the destination. The source node rst injects a xed number of packet copies into the network to opportunistically forward the packet to the destination's companions. When the packet reaches a companion, this companion only forwards received packets to other companions, instead of all contacted nodes. SMART therefore achieves a higher delivery ra-tio and lower delivery latency than schemes like Spray and Focus, which only use controlled opportunistically-forwarding mechanisms. However, SMART needs a
lot of space to record encounter histories with other nodes.
GeoSpray makes routing decisions based on ge-ographical location data provided by a positioning device like GPS. It assumes that each vehicle has to move along a route suggested by its navigation system to determine the Nearest Point (NP) on its route to the destination. Therefore, the Minimum Estimated Time of Delivery (METD) of the vehicle to the destination is equal to the sum of the time from the vehicle to the NP, and from the NP to the destination. GeoSpray starts with a multiple-copy scheme to spread a limited number of packet copies, and then switches to a single-copy forwarding scheme to seek additional contact opportunities. Instead of performing opportunistic forwarding, as proposed in Spray and Wait and Spray and Focus, GeoSpray also adopts the binary spraying scheme to guarantee that one half of the packet copies is only spread to intermediate vehicles that are closer to the packet's destination vehicle, i.e. intermediate vehicles that have smaller METDs than those of the current vehicle. However, not all vehicles have on-board navigation systems to plan their routes in ad-vance and then calculate corresponding METDs; the GeoSpray routing mechanism may fail in these cases.
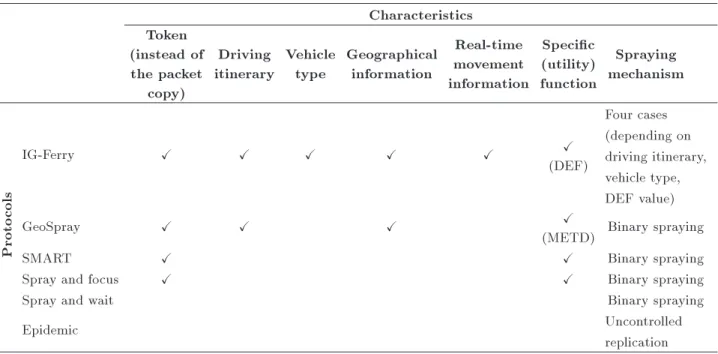
Table 1 lists important characteristics of multi-copy routing protocols for VDTN. The rst feature is whether the token is used to replace the packet copy. The protocols use of tokens can reduce consumed wireless bandwidth and buer spaces to spray and store packet copies, especially with a large number of maximum allowed replicable packet copies. Vehicle trac information, including geographical positions, real-time movement information like movement
direc-Table 1. Characteristics of multi-copy routing protocols for VDTNs. Characteristics
Token (instead of the packet
copy)
Driving itinerary
Vehicle type
Geographical information
Real-time movement information
Specic (utility) function
Spraying mechanism
Proto
cols
IG-Ferry X X X X X X
(DEF)
Four cases (depending on driving itinerary, vehicle type, DEF value)
GeoSpray X X X X
(METD) Binary spraying
SMART X X Binary spraying
Spray and focus X X Binary spraying
Spray and wait Binary spraying
Epidemic Uncontrolled
tions, instantaneous speeds and driving itineraries, is essential in deriving optimal routes for VANETs. As the input to a specic decision function, this information also helps the vehicle to select the best candidate neighbor to eciently spray the packet. Ad-ditionally, dierent types of vehicle have various driving behaviors and itineraries. The binary spraying scheme used in traditional controlled replication protocols does not consider these vehicle heterogeneities. Therefore, protocols with binary packet spraying and replication among vehicles in VDTNs are decient. Compared to these well-known multi-copy routing protocols, the proposed IG-Ferry features important characteristics to further improve routing performance in VDTNs. Details of the IG-Ferry will be described below.
3. IG-Ferry routing protocol 3.1. IG-Ferry concepts
IG-Ferry consists of three important design concepts, described below:
1. IG-Ferry classies contacted vehicles into three types, i.e. direct buses, non-direct buses and pri-vate cars according to their heterogeneous mobility information. It further adopts dierent token repli-cation mechanisms for them to eciently forward packet copies. For example, when the current relay vehicle contacts a direct bus, it will forward its carried packets with the appropriate token value, at least one, to that direct bus. In the worst case scenario, even when all other relay vehicles fail to reach the destination, this replication mechanism still guarantees that the direct bus can carry the packet with the token value by itself to reach the destination. Details of replication mechanisms are described below.
2. IG-Ferry records the number of packet copies car-ried by a relay vehicle, as the value of the forwarding token in the packet header, as Spray and Focus, in order to reduce the relay's required buer space for storing multiple packet copies and consumed wireless bandwidth for their exchange.
3. IG-Ferry proposes the DEF function to eciently spray packet token values to the maximum number of appropriate relay vehicles, depending on their type, geographical location and mobility informa-tion. Thus, IG-Ferry yields better performance than traditional multiple-copy routing protocols. 3.2. IG-Ferry delay evaluation function
In order to spray more token values to vehicle that can reach the destination soonest, we propose the Delay Evaluation Function (DEF), as shown in Figure 1, to estimate how much delay time the vehicle will require to carry the packet token from the current location
to the destination in the worst case scenario. The delay time consists of two parts. Assume that the current relay vehicle, which could be a public bus Bk
or a private car Ck, enters the wireless
communica-tion range of the contacted vehicle Bl=Cl. Distk next
and Distlnext are dened as the curve-metric distances from the current contacted location, where Bk=Ck
and Bl=Cl meet, to the rst intersections, Ik next and
Il
next, that Bk=Ck and Bl=Cl will reach, respectively.
These curve-metric distances are measured according to geometric shape [22]. Thus, Bk=Ckand Bl=Clmust
spend the rst part of the delay time, i.e. Tk next and
Tl
next, carrying the packet token by themselves to Inextk
and Il
next. Eq. (1) formulates Tnextk and Tnextl , where
Vk and Vl denote the average speeds of Bk=Ck and
Bl=Cl, respectively.
Tk
next= Dist k next
Vk ; Tnextl =
Distl next
Vl : (1)
If Bl=Clfollows a path, i.e. Il
next! ! Im! In!
! Id, from the rst intersection, Inextl , to the closest
intersection, Id, which directly connects to the road
segment on which the destination is currently situated, it must spend the time, Distm;n=Vm;n, carrying the
packet token by itself to pass the curve-metric distance, Distm;n, of each road segment, Rm;n, where Vm;n
denotes the average speed of Bl=Cl on road segment
Rm;n. Therefore, Bl=Clmust spend the second part of
time, Tl
cur, formulated by Eq. (2), carrying the packet
token by itself along each road segment of this path to the destination, where the set, RSl, contains each road
segment, Rm;n.
Tk cur=
X
8Rm;n2RSk
Distm;n
Vm;n ;
Tl cur=
X
8Rm;n2RSl
Distm;n
Vm;n : (2)
Thus, Bk=Ck also uses Eq. (2) to calculate the second
part of time, Tk
cur. Finally, the estimated DEF values,
i.e., Tk and Tl, of Bk=Ck and Bl=Cl, are equal to the
sums of the two parts of their delay times, formulated as Tk
next+ Tcurk and Tnextl + Tcurl , respectively, and as
shown in Eq. (3): Tk= Tk
next+ Tcurk ; Tl= Tnextl + Tcurl : (3)
In addition, we propose dierent approaches to calcu-late curve-metric distances for three types of vehicle in VDTNs. This curve-metric distance represents the maximum estimated distance for the current vehicle to carry the packet tokens by itself to reach the destination.
I.-C. Chang et al./Scientia Iranica, Transactions B: Mechanical Engineering 22 (2015) 1517{1533 1521
Figure 1. The delay evaluation function for vehicle k at its current location loc.
1. If the vehicle is a direct bus, its curve-metric distance, i.e. Distcur, is equal to the total length
of the road segments along its itinerary from the rst intersection, Inext, after the contact, to the
closest intersection, Id, of the destination. As
shown in the upper right part of Figure 2, though two direct buses, Bk and Bl, drive to the same
rst intersection, I15, their itineraries after I15 contain dierent intersections, i.e. I12, I7 and IE for Bk, and I16, I13, I8 and ID for Bl, to reach the
closest intersection to the destination. Thus, their curve-metric distances, i.e. Distk
cur and Distlcur, are
calculated along their individual itineraries.
2. If the vehicle is a non-direct bus, it cannot carry the packet tokens by itself to the destination. Thus, its curve-metric distance, Distcur, is estimated as
the sum of two parts. The rst part is the curve-metric distance from the rst intersection of the vehicle to the Nearest Point (NP) on its pre-dened itinerary to the destination. The second part is the distance the packet token is carried by the relay
vehicle r from the NP to the destination. Here, the NP is considered the new starting location in order to estimate the curve-metric distance of the second part. Data-mining schemes, like Se-mantic Trajectory Mining [23], etc., are usually adopted to calculate contact probabilities between two vehicles. Hence, they could be used here to predict the closest vehicle, which will contact the current packet-carried vehicle with the highest contact probability to the NP, as the relay vehicle r. As shown in Figure 2, the non-direct bus, Bl,
between I10 and I11 can carry the packet token by itself as far as the NP, i.e. I2, along its pre-dened itinerary, which is shown as the orange dashed line beside Bl. Then, Bl replicates the
packet tokens at I2 to the closest contact vehicle, which is moving toward I3. In this way, the packet tokens can reach the closest intersection IE, and, nally, the destination. The curve-metric distance, Distl
cur, of Bl is, therefore, estimated as
the total length of the road segments along the green path.
Figure 2. DEF examples for three types of vehicles.
3. According to results observed in real life, most driver trips were duplicated. Hence, some trajectory-based scheme, like the Shared-Trajectory-based Data Forwarding Scheme (STDFS) [24], His-tory Based Predictive Routing (HBPR) [25], etc. can be used in this paper to predict the routes of private cars. Hence, if the vehicle is a private car, its curve-metric distance, Distcur, is estimated as the
sum of the following three parts. The rst part is the curve-metric distance from the rst intersection to one of its adjacent intersections; the second is the curve-metric distance of a path starting from this adjacent intersection to the Nearest Point (NP) on the vehicle's predicted itinerary to the destination; the third part is the distance the packet token is carried by the closest contact vehicle r from the NP to the destination. As shown in Figure 1, the rst intersection along the route of Ck is I11, which has three adjacent intersections,
i.e., I12, I14 and I6. The curve-metric path from I11 to the closest intersection, i.e. ID or IE, of the destination must pass by one of these three candidate intersections, which is I6 in Figure 2. Then, Ck carries the packet token by itself, as far
as the NP, i.e. I3, along its itinerary, predicted by the trajectory-based scheme. After that, Ck
replicates the packet tokens at I3 to the closest con-tact vehicle moving toward the closest intersection, IE, such that the packet tokens can nally reach the destination. Consequently, the curve-metric distance, Distkcur, of Ck is, therefore, estimated as
the total length of all the road segments along the purple path, consisting of I11, I6, I3 and IE.
Ekl, in Eq. (4), is used to express the DEF ratio
by dividing the DEF value of Bl=Clby that of Bk=Ck
upon an encounter.
Ekl= Tl
Tk: (4)
If Ekl is smaller than 1, i.e., Tl is smaller than
Tk, Bl=Cl will incur a lower estimated delay than
Bk=Ck to carry the packet token by itself to the
destination, which means that Bl=Cl is likely to reach
the destination sooner, and the IG-Ferry will, therefore, spray more packet tokens to Bl=Cl. Details of the
IG-Ferry spraying mechanism are described below. 3.3. IG-Ferry protocol ow
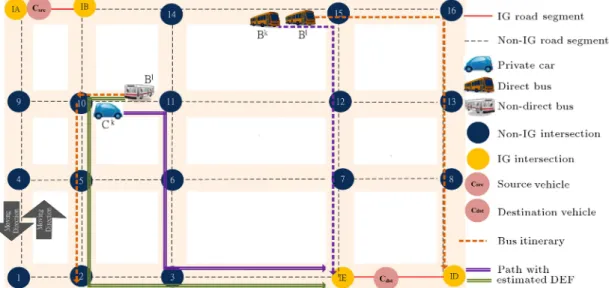
The IG-Ferry protocol starts when any vehicle that does not carry the packet token makes contact with the source vehicle, i.e. Csrc. In Figure 3, Csrc is located
between intersections I11 and I12. According to the binary spraying scheme, Csrc forwards one-half of its
carried packet tokens to this vehicle to be relayed to the destination vehicle, i.e. Cdst. The initial Time
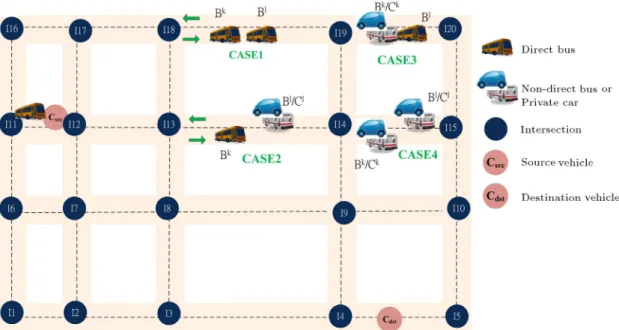
To Live (TTL) values are assigned to these packets to represent the maximal remaining lifetimes of carried packets. After the packet tokens have been carried by the rst relay vehicle, there are four cases for spraying packet tokens between the current relay vehicle and the contacted vehicle, depending on vehicle type. When the carried packet is replicated or forwarded to a contacted vehicle, the TTL value of this packet is decreased by the time elapsed since the last packet replication or forwarding. As soon as the TTL value of a carried packet is reduced to zero, the packet should be dropped from the buer. During the limited contact period, two vehicles adopt the largest TTL rst packet scheduling mechanism to exchange their carried packets. An example of packet token spraying between two vehicles is shown in Figure 3. Figure 4 illustrates the complete IG-Ferry packet token spraying ow.
I.-C. Chang et al./Scientia Iranica, Transactions B: Mechanical Engineering 22 (2015) 1517{1533 1523
Figure 3. An example of packet token spraying between two vehicles.
Figure 4. The IG-Ferry packet token spraying ow.
Case 1: When a direct bus carrying packet tokens meets a direct bus.
As shown in Case 1 of Figure 3, when direct bus, Bk, which is carrying the packet with the token
value, T Ok, encounters direct bus Bl, which can drive
to one of the closest intersections, i.e., I4 and I5, to destination Cdst along its itinerary, Bk and Bl rst
exchange a list of carried packets and corresponding
token values through the HELLO message. There are two dierent situations for spraying the packet tokens between these two vehicles. First, if Bk and Bl carry
the same packets with token values T Ok and T Ol,
both will re-spray all packet tokens, i.e., T Ok+ T Ol,
according to Eq. (5), to Bk and Bl, respectively. The
vehicle with the smallest estimated DEF value is likely to reach the destination soonest.
8 > < > :
T Ok=l(T Ok+ T Ol) Tl
Tk+Tl
m
T Ol=j(T Ok+ T Ol) Tk
Tk+Tl
k (5)
Thus, Eq. (5) implies that the direct bus with the smaller estimated DEF value will carry larger packet token values in order to spray them to more relay vehicles. In this way, end-to-end transmission delays for these packets to arrive at the destination can be reduced. Second, if Bldoes not carry the same packets
as Bk, Bk will replicate these packets with appropriate
token values to Bl. The IG-Ferry uses the following
rule, which is formulated as Eq. (6), to re-spray token values between them.
8 > > > > > > > > > > > > > < > > > > > > > > > > > > > : (
T Ok = 1
T Ol= T Ok 1 ; if Ekl < 1
(
T Ok = T Ok=2
T Ol= T Ok=2 ; if Ekl = 1
(
T Ok = T Ok 1
T Ol= 1 ; if Ekl > 1
(6)
If Ekl < 1, which means that the estimated DEF, i.e.
Tlof Bl, is smaller than that of Bk, i.e. Tk, the packet
token values of Bkand Blare assigned to 1 and T Ok
1, respectively. Conversely, if Ekl> 1, the packet token
values of Bk and Bl are assigned as T Ok 1 and 1,
respectively. However, if Ekl = 1, the binary spraying
approach is used to equally spray token values between Bk and Bl. In this way, the IG-Ferry packet delivery
ratio can be improved by allowing each direct bus to carry at least one packet token to the destination. Case 2: When a direct bus carrying packet tokens meets a non-direct bus or a private car.
As shown in Case 2 of Figure 3, when direct bus, Bk, which is carrying the packet with the token value,
T Ok, encounters a non-direct bus, Bl, or a private car,
Cl, denoted as Bl=Cl, Bk and Bl=Cl, rst, exchange a
list of carried packets and corresponding token values through the HELLO message, as in Case 1. There are also two dierent situations for spraying the packet tokens between these two vehicles. First, if Bk and
Bl=Cl carry the same packets with token values T Ok
and T Ol, both will re-spray all packet tokens, i.e.
T Ok + T Ol, to Bk and Bl=Cl with the same rule,
i.e. Eq. (5), as Case 1. Second, as mentioned above, if Ekl < 1, the estimated DEF, i.e. Tl of Bl=Cl, is
smaller than Tkof Bk, which means that Bl=Clis likely
to reach the destination sooner. Therefore, if Bl=Cl
does not carry the same packets as Bk and Ekl < 1,
the IG-Ferry re-sprays 1 and (T Ok 1) packet tokens
to Bk and Bl=Cl, respectively. Conversely, if Ekl> 1,
which means that the current direct bus, Bk, is likely to
reach the destination sooner, Bkkeeps all packet tokens
and does not need to replicate any packets to Bl=Cl.
As in Case 1, the binary spraying approach is used to equally spray token values between Bk and Bl=Cl, if
Ekl= 1. With the rule formulated in Eq. (7), the
IG-Ferry reduces the total number of replicated packets among vehicles in VDTNs by only re-spraying packet tokens to the direct bus, which reaches the destination by itself, or to the non-direct bus or private car, which will reach the destination sooner than the current relay vehicle.
If Bl=Cldoes not carry the same packet of Bk:
8 > > > > > > > > > > > > > < > > > > > > > > > > > > > : (
T Ok = 1
T Ol= T Ok 1 ; if Ekl< 1
(
T Ok = T Ok=2
T Ol= T Ok=2 ; if Ekl = 1
(
T Ok = T Ok
T Ol= 0 ; if Ekl> 1
(7)
Case 3: When a non-direct bus or a private car carrying packet tokens meets a direct bus.
As shown in Case 3 of Figure 3, when the non-direct bus or private car, Bk=Ck, carrying the packet
with the token value, T Ok, encounters direct bus, Bl,
Bk=Ck and direct bus Bl will exchange their lists of
carried packets and corresponding token values through the HELLO message. After this, they will re-spray their packet tokens with the following two rules. First, if Bk=Ck and Bl carry the same packets with token
values, T Ok and T Ol, both will re-assign all packet
tokens, i.e. T Ok+T Ol, to Bk=Ckand Bl, with Eq. (5)
as Case 1. Second, if Bl does not carry the same
packets as Bk=Ck and Ekl < 1,Bk=Ck, will forward
the carried packets with all token values, i.e. T Ok, to
Bl, because Bl is a direct bus and is likely to reach
the destination sooner than Bk=Ck. Then, Bk=Ck
will clear these packets from its buer. Conversely, if Ekl > 1, which means that current Bk=Ck is likely
to reach the destination sooner than Bl, Bk=Ck must
replicate each packet to direct bus Bl with the token
value of 1. It then modies the token values of these replicated packets to T Ok 1. Consequently, the
IG-Ferry packet delivery ratio can be increased by allowing Bl to carry a packet copy to the destination
with the aforementioned rule, which is formulated as Eq. (8).
I.-C. Chang et al./Scientia Iranica, Transactions B: Mechanical Engineering 22 (2015) 1517{1533 1525 8 > > > > > > > > > > > > > < > > > > > > > > > > > > > : (
T Ok = 0
T Ol= T Ok ; if Ekl< 1
(
T Ok = T Ok=2
T Ol= T Ok=2 ; if Ekl= 1
(
T Ok = T Ok 1
T Ol= 1 ; if Ekl > 1
(8)
Case 4: When a non-direct bus or private car car-rying packet tokens meets a non-direct bus or private car.
As in the three above cases, after Bk=Ck and
Bl=Cl exchange their lists of carried packets and
cor-responding token values through the HELLO message, as shown in Case 4 of Figure 3, they will re-spray their packet tokens with the following two rules. First, if Bk=Ck and Bl=Cl carry the same packets with token
values, T Ok and T Ol, both, will re-assign all packet
tokens, i.e. T Ok + T Ol, to Bk=Ck and Bl=Cl with
Eq. (5) as Case 1. Second, the token spraying rule of this case is formulated as Eq. (9) if Bl=Cl does not
carry the same packets of Bk=Ck.
8 > > > > > > > > > > > > > < > > > > > > > > > > > > > : (
T Ok = 0
T Ol= T Ok ; if Ekl< 1
(
T Ok = T Ok=2
T Ol= T Ok=2 ; if Ekl= 1
(
T Ok = T Ok
T Ol= 0 ; if Ekl> 1
(9)
If Ekl< 1, Bk=Ckwill forward carried packets with all
token values, i.e. T Ok, to Bl=Cl; it is likely to reach
the destination sooner than Bk=Ck. Then, Bk=Ck will
clear these packets from its buer. Conversely, if Ekl>
1, which means that current Bk=Ck is likely to reach
the destination sooner than Bl=Cl, Bk=Ck does not
need to replicate packets to Bl=Cl because Bl=Cl is
not guaranteed to reach the destination by itself. In this way, the total number of replicated packets in the IG-Ferry is reduced.
4. Simulations
4.1. Simulation environment
In [26], the authors derived ve core aspects dening Inter-Vehicle Communication (IVC) simulations, i.e. network simulator, radio propagation model, medium access protocol, road trac mobility and scenario description. First, we adopt the well-known network
simulator, NS-2.34 [27], to perform simulations in this paper. Second, Nakagami-m [28] is a mathematical general modeling of a radio channel with fading. By varying the shape factor m value, a high fading scenario, like a city environment or a freeway or highway, can be formed [29]. As the radio propaga-tion model used in [30-32] for VANETs, Nakagami-3, which has been supported by NS-2.34, is adopted in our simulations. Some recent work [33,34] has found that obstacles have a signicant eect when two vehicles are driving on roads separated by buildings or vehicles. These studies tried to develop realistic path loss models to improve the quality of wide range VANET simulations. Whenever NS-2 supports these proposed models, we will re-verify the validity of this simulation in the near future. Third, each vehicle is assumed to communicate with other vehicles by the IEEE 802.11p protocol [35] with Enhanced Distributed Channel Access (EDCA). According to the steps and parameters described in [36], we apply 802.11p to these NS-2 simulations. The transfer rate is chosen as the lowest rate supported by 802.11p, namely 3 Mbps, and the Communication Range (CR) is set at 250 m [30,31,34].
The sparse mobility settings simulate the Ve-hicular Delay-Tolerant Network (VDTN) scenario as follows. As in [37], we also consider the real motion traces from 1051 operational taxis for about one month in Shanghai city, collected by GPS [38]. The location information of the taxis is recorded within a 1010 kM2
area, shown in Figure 5. The itinerary, the NP and the contact vehicle nearest the NP of every taxi, i.e. the private car in this paper, are extracted from this trace. Further, the instantaneous speed of each taxi is conned within 8-15 m/s. Based on Shanghai city bus information, there are 458 public buses that move along
their real itineraries with velocities of 10-12 m/s. The maximum acceleration and deceleration for the public buses are +0:5 m/s2and 0:5 m/s2, respectively. The
period of each trac light and the number of lanes of each road segment are recorded in this real trace. Finally, in the 1400-second period, i.e. 8:00 pm-8:23 pm on 1 March 2007 in the trace of Shanghai city [38], we conduct a realistic scenario that contains CBR ows transmitted with the UDP transport protocol between dierent source-destination vehicle pairs, which are uniformly chosen from all vehicles in this area. All CBR ows begin their transmissions at 35 seconds until the end of the simulation, with a default packet size of 512 bytes, and 10 packets per second, which introduces transmission rates of 40 kbps. The initial TTL value of each CBR packet is set to 50 seconds in default to represent the maximum remaining lifetimes of carried packets. As soon as the TTL value of a carried packet reaches zero, that packet should be dropped from the default 0.6M byte buer of each vehicle. Conversely, if the destination vehicle receives a packet copy with a positive TTL value, this packet is called the successfully received one by the destination. Parameters used for these simulations and their default values are listed in Table 2.
In order to evaluate the transmission performance of the aforementioned CBR/UDP trac with our proposed IG-Ferry routing protocol in a VDTN, we adopt four well-known DTN routing protocols, i.e. Epidemic, Spray and Focus, SMART and GeoSpray for performance comparison. Note that each vehicle with the IG-Ferry rst exchanges its carried packet with
the largest TTL value with encountered vehicles. In the following, we compare the average values of three performance metrics, i.e. Average Packet Delivery Ratio (APDR), Average End-to-End Delay (AEED) and Average Replication Overhead (ARO), for all ve routing protocols with respect to ve parameters, i.e. the number of CBR source-destination pairs, the value of initial tokens, the initial TTL of each packet issued by the source, packet size and buer size. We conduct twenty independent runs for each evaluation in which the simulation time of each run is 1400 seconds, i.e. the non-rush period from 8:00 pm to 8:23 pm on 1 March 2007 in the trace. The error bars in the following gures represent the 95% condence intervals. APDR is dened as the quotient of dividing the number of packets successfully received by the destination over the number of packets sent from the source vehicle, and AEED is that of dividing the total end-to-end delays of all successfully received packets by the number of successfully received packets. In this paper, ARO is dened as the average value of total packet copies replicated over vehicles in a VANET when the TTL value of the packet reduces to zero for a single source vehicle. Therefore, the DTN routing protocol with the smallest average replication overhead value is the one which replicates the least copies to all contacted vehicles, which means this protocol consumes the least wireless bandwidth for spraying copies.
4.2. Simulation results
Figures 6 and 7 show the APDRs and AEEDs achieved by the ve VDTN routing protocols for successfully
Table 2. NS2 Simulation parameters.
Parameter Value
Simulation time 1400 seconds (8:00 pm - 8:23 pm on 1 March 2007 in the trace of Shanghai city [38])
Simulation area 10 km 10 km
Number of private cars 1051 (according to the trace of Shanghai city) Number of public buses 458 (according to bus information of Shanghai city) Number of CBR source-destination pairs 10, 20, 30 (default), 40, 50
Number of initial tokens 100 Maximal Communication Range (CR) 250 m
Velocity range of private cars 8-15 m/sec (according to the trace) Velocity range of public buses 10-12 m/sec (according to the trace)
CBR rate 10 packets per second
MAC protocol IEEE 802.11p
Physical propagation model Nakagami, m = 3 [30-32] IEEE 802.11p wireless bandwidth 3 Mbps [30,31,34]
CBR packet size 512 bytes
Initial TTL value of each CBR packet 50 seconds Buer size of each vehicle 0.6 M bytes
I.-C. Chang et al./Scientia Iranica, Transactions B: Mechanical Engineering 22 (2015) 1517{1533 1527
Figure 6. Average packet delivery ratio vs. the number of source-destination trac pairs.
Figure 7. Average end-to-end delay vs. the number of source-destination trac pairs.
received packets in Cdst. As the number of CBR
trac pairs increases, the APDRs of the ve VDTN routing protocols decrease slowly, but their AEEDs increase accordingly, due to increased collisions of CBR packets. Because Epidemic is a ooding-based protocol, it achieves the highest APDRs and the lowest AEEDs. Conversely, it is extremely wasteful of wireless bandwidth and buer space in its replication of the huge number of copies over vehicles, as shown by the AROs in Figure 8. Three traditional controlled repli-cation approaches, i.e. Spray and Focus, SMART and GeoSpray, achieve signicant improvements on their AROs over Epidemic by controlled opportunistically-forwarding and binary spraying mechanisms. However, they do not consider heterogeneous vehicle characteris-tics in VDTNs. These three protocols, therefore, suer from much lower APDRs and higher AEEDs than Epi-demic, as shown in Figures 6 and 7, respectively. Based on the proposed token spraying ow and estimated DEF values for three kinds of heterogeneous vehicle,
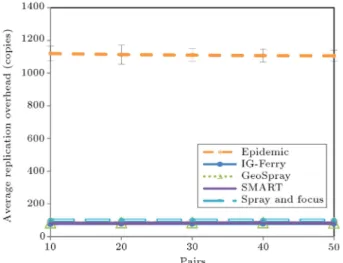
Figure 8. Average replication overhead vs. the number of source-destination trac pairs.
Table 3. Three normalized metrics vs. source-destination trac pairs.
APDR AEED ARO
Epidemic 100% 100% 100%
IG-Ferry 75% 134% 7%
GeoSpray 64% 194% 9%
SMART 59% 210% 9%
Spray and focus 54% 231% 9%
the IG-Ferry re-sprays at least one packet token to di-rect buses, and more packet tokens to the vehicle most likely to reach the destination sooner upon a contact, which can raise its APDRs and reduce its AEEDs, as compared to those of Spray and Focus, SMART and GeoSpray. It also achieves lower AROs than these three controlled replication approaches. Note that AROs of all protocols in Figure 8 remain stable because they are irrelevant to the number of CBR source-destination pairs. By dividing the average metric value (vs. source-destination trac pairs) of each protocol over that of Epidemic, Table 3 lists the normalized values of three metrics of all protocols. It is clear that IG-Ferry outperforms GeoSpray, i.e. the best controlled replication protocol among Spray and Focus, SMART and GeoSpray, with 11% (75%-64%) on APDR, 60% (194%-1334%) on AEED, and 2% (9%-7%) on ARO in this sparse VDTN scenario. These results show the signicant performance improvements of IG-Ferry over traditional controlled replication protocols at the cost of only a 25% decrease and 34% increase on the APDR and AEED of Epidemic, respectively. However, IG-Ferry resolves the ooding defect of Epidemic by obtaining 7% of the AROs of Epidemic.
As mentioned above, the ooding-based protocol, i.e. Epidemic, continuously replicates and transmits packets to newly discovered nodes that have not
al-Figure 9. Average packet delivery ratio vs. the number of initial tokens.
Figure 10. Average end-to-end delay vs. the number of initial tokens.
ready received a copy of the packet. Therefore, three metrics of Epidemic are independent of the number of initial tokens given in the source vehicle, as shown in Figures 9-11. Conversely, as the number of initial tokens increases, the APDRs and AROs of these four controlled replication VDTN routing protocols, i.e. Spray and Focus, SMART, GeoSpray and IG-Ferry, increase, while their AEEDs decline accordingly, as shown in Figures 9 to 11, respectively. This is because they can spray more packet copies to more vehicles and, nally, to the destination, with higher possibilities and shorter delays, when the initial token value is larger. Moreover, these four protocols have much smaller AROs than Epidemic because the maximum number of replicated copies over all vehicles in VDTNs is limited to the number of initial tokens. Of these four controlled replication VDTN routing protocols, IG-Ferry has the largest APDRs and the lowest AEEDs/AROs due to its proposed token spraying ow. Moreover, as shown
Figure 11. Average replication overhead vs. the number of initial tokens.
Table 4. Three normalized metrics vs. the number of initial tokens.
APDR AEED ARO
Epidemic 100% 100% 100%
IG-Ferry 81% 133% 13%
GeoSpray 70% 190% 16%
SMART 63% 205% 17%
Spray and focus 59% 221% 17%
in Figures 9-11, respectively, its APDRs and AEEDs approach those of Epidemic, but its AROs grow slower than Spray and Focus, SMART and GeoSpray when the token number reaches 300. This means that the IG-Ferry achieves a much better performance over the three traditional controlled replication protocols, espe-cially when the number of tokens increases. Finally, Table 4 lists the normalized values of three metrics of all protocols. It is clear that IG-Ferry outperforms GeoSpray with 11% (81%-70%) on APDR, 57% (190%-133%) on AEED and 3% (16%-13%) on ARO, at a cost of only a 19% decrease on the APDR and a 33% increase on the AEED of Epidemic, respectively. These results also prove that IG-Ferry resolves the ooding defect of Epidemic with only 13% of the AROs of Epidemic with respect to dierent numbers of initial tokens.
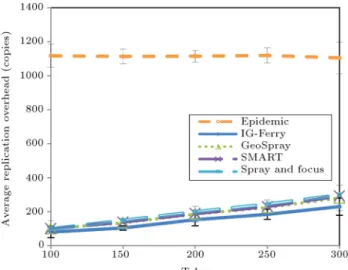
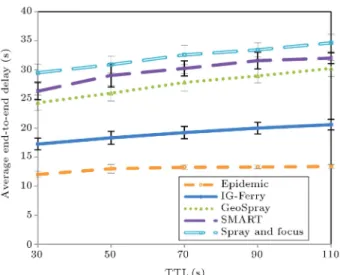
With a larger TTL value, carried packets can travel further, such that they have a higher probability of reaching the destination, but a lower probability of being dropped by intermediate vehicles. Thus, as the TTL value of each packet increases, the APDRs and AEEDs of the ve VDTN routing protocols all increase, as shown in Figures 12 and 13, respectively. Note that regardless of how large the TTL is, the maximal ARO of each controlled replication VDTN routing protocol is conned by the number of tokens, which is 100, by
I.-C. Chang et al./Scientia Iranica, Transactions B: Mechanical Engineering 22 (2015) 1517{1533 1529
Figure 12. Average packet delivery ratio vs. TTL.
Figure 13. Average end-to-end delay vs. TTL.
default. Therefore, their AROs are relatively stable as the TTL increases, as shown in Figure 14. On the other hand, in the worst case, those of Epidemic can only increase to the total number of all vehicles, consisting of public buses and private cars, when each vehicle receives a copy of the CBR packet. In these three gures, it is clear that IG-Ferry outperforms the three traditional controlled replication protocols on these three metrics. Table 5 lists the normalized values of three metrics of all protocols over those of Epidemic. It can be seen that IG-Ferry has a 12% (79%-67%)
Table 5. Three normalized metrics vs. TTL.
APDR AEED ARO
Epidemic 100% 100% 100%
IG-Ferry 79% 146% 6%
GeoSpray 67% 211% 8%
SMART 63% 228% 8%
Spray and focus 57% 248% 8%
Figure 14. Average replication overhead vs. TTL.
higher APDR, a 65% (211%-146%) lower AEED, and a 2% (8% - 6%) lower ARO than GeoSpray at a cost of only a 21% decrease on the APDR, and a 46% increase on the AEED of Epidemic, respectively. Moreover, IG-Ferry obtains only 6% of the AROs of Epidemic, even when the TTL increases to 110 seconds, which is signicant for VDTN protocols.
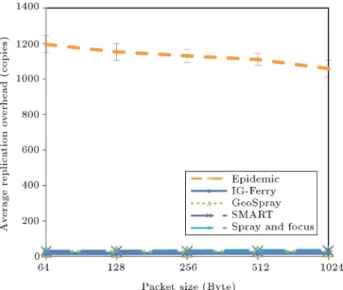
In the following, the results of three metrics of ve VDTN routing protocols are presented with varied packet sizes. Because the contact time of two vehicles may not be long enough to replicate a large packet between them, the carried packets with larger packet sizes would be dropped by the intermediate vehicle and collide with other packets during transmission with higher possibilities before reaching the destination. Therefore, as the size of each packet increases, the APDRs of the ve VDTN routing protocols decrease, as shown in Figure 15. Conversely, because each
Figure 15. Average packet delivery ratio vs. the packet size.
Figure 16. Average end-to-end delay vs. the packet size.
intermediate vehicle incurs greater delays in order to process and transmit larger packet copies, the AEEDs of the ve protocols increase with the larger packet size, as shown in Figure 16. Aside from the eects of packet dropping and collision as mentioned above, the average values of total packet copies of all protocols are independent of the packet size when the TTL value of the packet reaches zero. However, Epidemic suers from higher packet dropping and collision probability than the other four controlled replication protocols due to its unlimited replication on contact, which gets worse with larger packet sizes. Thus, the AROs of the four controlled replication protocols are relatively more stable than those of Epidemic, as shown in Figure 17. According to the normalized values of three metrics of all protocols listed in Table 6, the IG-Ferry has an 11% (77%-66%) higher APDR, and a 74% (209%-135%) lower AEED than GeoSpray at a cost of only
Figure 17. Average replication overhead vs. the packet size.
Table 6. Three normalized metrics vs. the packet size.
APDR AEED ARO
Epidemic 100% 100% 100%
IG-Ferry 77% 135% 7%
GeoSpray 66% 209% 7%
SMART 61% 218% 8%
Spray and focus 55% 241% 8%
Figure 18. Average packet delivery ratio vs. the buer size.
a 23% decrease on the APDR and a 35% increase on the AEED of Epidemic, respectively. Though IG-Ferry has a 1% ARO improvement, at most, over the other three traditional controlled replication protocols, all four protocols result in up to 8% of the AROs of Epidemic with respect to the varied packet size.
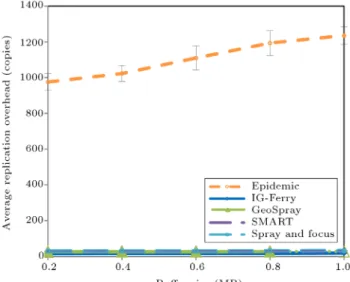
Furthermore, with larger buer sizes, each in-termediate vehicle can carry more packet copies such that fewer packets will be dropped due to buer overow by the intermediate vehicle before reaching the destination. Thus, as the buer size of each vehicle increases, the APDRs of the ve VDTN routing protocols increase, but their AEEDs decrease, as shown in Figures 18 and 19. As mentioned above, the AROs of Epidemic and the four controlled replication protocols, shown in Figure 20, are limited to the maximum number of all vehicles in a VDTN and the number of initial tokens, respectively. Consequently, the four controlled replication protocols have stable ARO values under the number of initial tokens, i.e. 100, but Epidemic suers from higher AROs as the buer size increases. The normalized values of three metrics of all protocols, with respect to buer size, are listed in Table 7. IG-Ferry has a 12% (77%-65%) higher APDR, a 58% (182%-124%) lower AEED, and a 1% (8%-7%) lower ARO than GeoSpray, at a cost of only a 23% decrease and a 24% increase in the APDR and AEED of Epidemic, respectively. Moreover,
IG-I.-C. Chang et al./Scientia Iranica, Transactions B: Mechanical Engineering 22 (2015) 1517{1533 1531
Figure 19. Average end-to-end delay vs. the buer size.
Figure 20. Average replication overhead vs. the buer size.
Table 7. Three normalized metrics vs. the buer size.
APDR AEED ARO
Epidemic 100% 100% 100%
IG-Ferry 77% 124% 7%
GeoSpray 65% 182% 8%
SMART 60% 194% 8%
Spray and focus 55% 227% 9%
Ferry only results in 7% of the AROs of Epidemic. We summarize aforementioned simulation results for the three metrics of the ve routing protocols as follows:
1. Though the four controlled replication routing pro-tocols suer from lower APDRs and higher AEEDs than those of Epidemic, they signicantly reduce their AROs to less than 10% of Epidemic's, which presents the eect of controlled replication for
spraying packets. Of the four controlled replication routing protocols, IG-Ferry outperforms the other three traditional ones on these three metrics, with respect to ve simulation parameters. It signi-cantly achieves, on average, about 12% higher AP-DRs, 60% lower AEEDs, and 2% lower AROs than those of GeoSpray, which performs best among the traditional binary spraying controlled replication routing protocols surveyed.
2. As any of the two parameters, i.e. the number of initial tokens and buer size, increases, all con-trolled replication routing protocols achieve higher APDRs and lower AEEDs simultaneously in our simulations. Conversely, they suer from lower APDRs and higher AEEDs with larger trac pairs, TTL and packet size. However, if the number of initial tokens and buer size grow too large, much heavier network trac and higher packet collision/dropping/error probabilities are incurred by too many replicated packet copies generated in the VDTN with too much signal attenuation. In the future, we will study optimal values of initial tokens and buer size for dierent realistic VDTN trac scenarios, mobility models and propagation eects due to obstacles and obstructing vehicles.
3. No matter how large the trac pair, TTL, packet size and buer size, the maximal ARO of each controlled replication VDTN routing protocol is conned by the number of initial tokens. However, the AROs of Epidemic may grow to the total number of all vehicles in the worst case scenario. We, therefore, conclude that the number of initial tokens is the most important simulation parameter of the ve examined in this simulation.
5. Conclusion and future work
In this paper, we proposed the IG-Ferry routing pro-tocol for eciently replicating packet copies among vehicles in a VDTN. IG-Ferry classies contacted vehicles into three types, and re-sprays packet tokens to dierent types of contacted vehicles according to their estimated end-to-end delays calculated by the proposed delay evaluation function. We conducted NS2 simulations of a sparse urban environment, based on the realistic vehicle trac trace of Shanghai city, IEEE 802.11p protocol, with EDCA and the Nakagami radio propagation model. Simulation results showed signicant performance improvements over three well-known binary spraying DTN routing protocols on average packet delivery ratios, average end-to-end de-lays and average replication overheads with respect to ve parameters. Consequently, IG-Ferry facilitates higher usability on the controlled packet replication mechanism than traditional approaches in VDTN.
To extend the results of this paper, there are two major pieces of research work for the near future. First, we will study how to predict the exact route of a private car, and then propose an accurate route estimation module in DEF to further improve the performance of the IG-Ferry, according to several real trace data of private cars. Second, we will study opti-mal values of communication parameters for dierent realistic VDTN trac scenarios, mobility models and propagation eects, due to obstacles and obstructing vehicles in urban environments.
Acknowledgment
This work was supported by the National Science Council (NCS), Taiwan, under Grant Number NSC100-2221-E-018-018.
References
1. Karp, B. and Kung, H. \GPSR: Greedy perimeter stateless routing for wireless networks", 6th ACM Mobile Computing and Networking (2000).
2. Lochert, C., Mauve, M., Fussler, H. and Hartenstein, H. \Geographic routing in city scenarios", ACM Mo-bile Computing and Communications Review, 9(1), pp. 69-72 (2005).
3. Zhao, J. and Cao, G. \VADD: Vehicle-assisted data delivery in vehicular ad hoc networks", IEEE Trans-actions on Vehicular Technology, 57(3), pp. 1910-1922 (2008).
4. Nzouonta, J., Rajgure, N., Wang, G. and Borcea, C. \VANET routing on city roads using real-time vehicular trac information", IEEE Transactions on Vehicular Technology, 58(7), pp. 3609-3626 (2009).
5. Lee, K-C., Cheng, P-C. and Gerla, M. \GeoCross: A geographic routing protocol in the presence of loops in urban scenarios", Ad Hoc Networks, 8(5), pp. 474-488 (2010).
6. Chang, I-C., Wang, Y-F. and Chou, C-F. \Ecient VANET unicast routing using historical and real-time trac information", 17th IEEE International Confer-ence on Parallel and Distributed Systems (ICPADS 2011), Tainan, Taiwan (2011).
7. Cerf, V., Burleigh, S., Hooke, A., et al. \Delay-tolerant networking architecture", IETF RFC 4838 (2007).
8. Fall, K. \A delay-tolerant network architecture for challenged Internets", The Conference on Applica-tions, Technologies, Architectures, and Protocols for Computer Communications (SIGCOMM '03) (2003).
9. Gong, H. and Yu, L. \Study on routing protocols for delay tolerant mobile networks", International Journal of Distributed Sensor Networks, Article ID 145727, 16 pages (2013). DOI:10.1155/2013/145727
10. Spyropoulos, T., Psounis, K. and Raghavendra, C.S. \Ecient routing in intermittently connected mobile
networks: The single-copy case", IEEE/ACM Trans-actions on Networking, 16(1), pp. 63-76 (2008).
11. Spyropoulos, T., Psounis, K. and Raghavendra, C.S. \Ecient routing in intermittently connected mo-bile networks: The multiple-copy case", IEEE/ACM Transactions on Networking, 16(1), pp. 77-90 (2008).
12. Zhao, W., Ammar, M. and Zegura, E. \A message ferrying approach for data delivery in sparse mobile ad hoc networks", 5th ACM International Symposium on Mobile Ad Hoc Networking and Computing (2004).
13. Leontiadis, I. and Mascolo, C. \GeOpps: geographical opportunistic routing for vehicular networks", IEEE International Symposium on World of Wireless, Mo-bile and Multimedia Networks (2007).
14. Zhang, Z. \Routing in intermittently connected mo-bile ad hoc networks and delay tolerant networks: Overview and challenges", IEEE Communications Surveys & Tutorials, 8(1), pp. 24-37 (2006).
15. Vahdat, A. and Becker, D. \Epidemic routing for partially-connected ad hoc networks", Tech. Rep., Duke University (2000).
16. Spyropoulos, T., Psounis, K. and Raghavendra, C.S. \Spray and wait: An ecient routing scheme for intermittently connected mobile networks", ACM SIGCOMM Workshop on Delay-Tolerant Networking (2005).
17. Spyropoulos, T., Psounis, K. and Raghavendra, C.S. \Spray and focus: Ecient mobility-assisted rout-ing for heterogeneous and correlated mobility", Fifth Annual IEEE Conference on International Pervasive Computing and Communications Workshops (2007).
18. Tang, L., Zheng, Q., Liu, J. and Hong, X. \Selec-tive message forwarding in delay tolerant networks", Mobile Networks and Applications, 14(4), pp. 387-400 (2009).
19. Soares, V.N.G., Rodrigues, J.P.C. and Farid, F. \GeoSpray: Ageographic routing protocol for vehic-ular delay-tolerant networks", Information Fushion (2011).
20. Pereira, P., Casaca, A., Rodrigues, J., et al. \From delay-tolerant networks to vehicular delay-tolerant networks", IEEE Communications Surveys & Tutori-als, 14(4), pp. 1166-1182 (2012).
21. Cheng, P.-C., Lee, K.-C., Gerla, M. and Harri, J. \GeoDTN+Nav: Geographic DTN routing with nav-igator prediction for urban vehicular environments", Mobile Networks and Applications, 15(1), pp. 61-82 (2010).
22. Li, H., Guo, A. and Li, G. \Geographic and trac load based routing strategy for VANET in urban trac environment", IET 3rd International Conference on Wireless, Mobile and Multimedia Networks (ICWMNN 2010) (2010).
23. Ying, J., Lee, W., Weng, T. et al. \Semantic trajec-tory mining for location prediction", The 19th ACM SIGSPATIAL International Conference on Advances in Geographic Information Systems (2011).
I.-C. Chang et al./Scientia Iranica, Transactions B: Mechanical Engineering 22 (2015) 1517{1533 1533
24. Xu, F., Guo, S., Jeong, J. et al. \Utilizing shared vehicle trajectories for data forwarding in vehicular networks", IEEE INFOCOM (2011).
25. Huang, Z., Wang, S., Ding, B. et al. \History based predictive routing in multi-lane delay tolerable VANETs", IEEE International Conference on Com-munications (ICC) (2012).
26. Joerer, S., Sommer, C. and Dressler, F. \Toward reproducibility and comparability of IVC simulation studies: A literature survey", IEEE Communications Magazine, pp. 82-88 (2012).
27. Browse nsnamles on SourceForge. net, http:// source-forge.net/projects/nsnam/ les/.
28. Beaulieu, N.C. and Cheng, C. \Ecient nakagami-m fading channel sinakagami-mulation", IEEE Transactions on Vehicular Technology, 54(2), pp. 413-424 (2005).
29. Bi, Y., Cai, L.X., Shen, X. and Zhao, H. \Ecient and reliable broadcast in intervehicle communication networks: Across-layer approach", IEEE Transactions on Vehicular Technology, 59(5), pp. 2404-2417 (2010).
30. Li, M., Yang, Z. and Lou, W. \CodeOn: Cooperative popular content distribution for vehicular networks using symbol level network coding", IEEE Journal on Selected Areas in Communications, 29(1), pp. 223-235 (2011).
31. Yang, Z., Li, M. and Lou, W. \CodePlay: Live multimedia streaming in VANETs using symbol-level network coding", IEEE Transactions on Wireless Communications, 11(8), pp. 3006-3013 (2012).
32. Yu, T.-X., Yi, C.-W. and Tsao, S.-L. \Rank-based network coding for content distribution in vehicular networks", IEEE Wireless Communications Letters, 1(4), pp. 368-371 (2012).
33. Sommer, C., Eckho, D., German, R. and Dressler, F. \A computationally inexpensive empirical model of IEEE 802.11p radio shadowing in urban environ-ments", IEEE Eighth International Conference on Wireless On-Demand Network Systems and Services (2011).
34. Boban, M., Vinhoza, T.T.V., Ferreira, M., Barros, J. and Tonguz, O.K. \Impact of vehicles as obstacles in vehicular ad hoc networks", IEEE Journal on Selected Areas in Communications, 29(1), pp. 15-28 (2011).
35. IEEE Std. 802.11p-2010 \Wireless LAN medium access control (MAC) and physical layer (PHY) specications amendment 6", wireless access in vehicular environ-ments (2010).
36. NS2 simulation with 802.11p.
https://sites.google.com/site/nahoons2/english-con/ ns2-simulation-with-802-11p.
37. Li, Y., Jin, D., Su, L., Zeng, L. and Wu, D.O. \Optimal mobility control with energy constraint in delay toler-ant networks", Wireless Communications and Mobile Computing, DOI:10.1002/wcm.2247 (2012).
38. S.J.U. Trac Information Grid Team, Grid Computing Center, Shanghai Taxi Trace Data. http:// wireless-lab.sjtu.edu.cn/.
Biographies
Ing-Chau Chang received his BS degree from the Department of Computer and Information Science at the National Chiao Tung University, Hsinchu, Taiwan, the Republic of China, in 1990, and MS and PhD degrees from the Institute of Computer Science and Information Engineering at the National Taiwan Uni-versity, Taipei, Taiwan, the Republic of China, in 1992 and 1997, respectively. He is currently Professor in the Department of Computer Science and Information Engineering at the National Changhua University of Education, Changhua, Taiwan, the Republic of China. His current research topics include wireless networks, multimedia network protocols, and multimedia sys-tems. He is the member of the Institute of Electrical and Electronics Engineers (IEEE).
Chien-Hsun Li received his MS degree in the In-stitute of Computer Science and Information Engi-neering at the National Changhua University of Ed-ucation, Changhua, Taiwan, the Republic of China, in 2012. His research interest includes the wireless network.
Cheng-Fu Chou received MS and PhD degrees from the University of Maryland, College Park, MD, USA, in 1999 and 2002, respectively, and is currently in the Computer Science and Information Engineering De-partment at the National Taiwan University, Taiwan, the Republic of China. He has also been a visiting scholar in the Computer Science Department at the University of Southern California. His current research interests are in distributed multimedia systems, peer-to-peer computing, wireless networks, and their perfor-mance evaluation.