Abstract— In this paper analysis the performance of a CDMA system by varying the system parameters. CDMA is a popular technology in cellular system due to its superior capacity and performance. In conventional CDMA, obtained better signal to noise ratio by using matched filter because of this rake receiver is used in CDMA to obtain desired signal to noise ratio. Rake receiver is one of the receiver technique, consists of multiple correlators, in which the receive signal is multiplied by time-shifted versions of a locally generated code sequence. To maximize the Signal to Noise Ratio and minimize the Bit Error Rate the CDMA Rake receiver is used. A predistorter-high power amplifier (PD-HPA) pair has become a common practice in wireless communication to compensate for nonlinear distortion due to HPA. However, the PD-HPA pair still produces severe signal distortion when the input signal exceeds the PD-HPA’s saturation level. The effects of such distortion on bit error rate (BER) degradation in direct sequence-code division multiple access signals (DS-CDMA) are analyzed. Assuming that the baseband CDMA signal is characterized as a complex Gaussian process, we develop analytic expressions for the BER and the contributing factors to BER.
Key Words:-CDMA (code Division Multiplexing), DS-SS (Direct Sequence (DS) Spread Spectrum), FDMA (Frequency Division Multiplexing), PN (Pseudo Noise), SNR (signal to Noise Ratio), BER (Bit Error Rate), Nonlinear Distortion, Predistortion, HPA (High Power Amplifier).
I. INTRODUCTION
Wireless cellular telephony has been growing at a faster rate than wired-line telephone networks. The main factor driving this tremendous growth in wireless coverage is that it does not need the setting up of expensive infrastructure like copper or fiber lines and switching equipment. This growth has also been fueled by the recent improvements in the capacity of wireless links due to the use of multiple access techniques (which allow many users to share the same channel for transmission) in association with advanced signal processing algorithms. Code Division Multiple Access (CDMA) is becoming a popular technology for cellular communications [1].
Unlike other multiple access techniques such as Frequency Division Multiple Access (FDMA) and Time-Division Multiple Access (TDMA) [7], which are limited in frequency band and time duration respectively, CDMA uses all of the available time-frequency space. One form of CDMA called Direct Sequence CDMA (DS-CDMA)
Manuscript received June 15, 2012.
Y Mohan Reddy, student,, dept of ECE, SITAMS, Chittoor, Andhra Pradesh, India,+91-9014157437([email protected]). K Manjunath, Assistant Professor department of ECE, SITAMS, Chittoor, Andhra Pradesh, India, +91-9052232027 ([email protected]).
K Yogaprasad, Associate Professor, Dept of ECE, SITAMS, Chittoor, AndhraPradesh India,+919908085522
uses a set of unique signature sequence or spreading codes to modulate the data bits of deferent users. With the knowledge of these spreading codes, the receiver can isolate the data corresponding to each user by the process of Channel estimation and detection. This process spreads the bandwidth of the underlying data signal; hence CDMA is called a spread spectrum technique. Standards such as IS-95 and the proposed W-CDMA are based on CDMA technology [4].
DS-CDMA signals typically exhibit large dynamic range since they represent the sum of signals of many users. Unfortunately, when passed through a high power amplifier (HPA), this large dynamic range results in distortion for components falling in the highly nonlinear regions of the HPA, which degrades the system bit error rate (BER) [12].
A common parameter for characterizing the dynamic range of a signal is the signal peak-to-average power ratio (PAR). PAR is often used as an indicator to how much harm the signal will suffer due to HPA nonlinearity, and also allows the system designer to determine the required amount of input back-off (IBO) to reduce nonlinear distortion effects. While PAR has its use, a signal’s dynamic range in relation to an HPA only captures only one feature of the signal’s interplay with the HPA.
We reformulate which signal characteristics to consider beyond dynamic range that can be linked directly with BER. In the analysis, we assume that the nonlinear amplifier chain includes a predistorter prior to the HPA, namely PDHPA. The PD-HPA has a zero AM-PM characteristic∅ 𝑟(𝑡) , and an AM-AM characteristic given by
𝐺 𝑟 𝑡 = 𝑟 𝑡 0 ≤ 𝑟 𝑡 ≤ 𝜁 (1)
= 𝜁 𝑟 𝑡 > 𝜁
Where𝑟(𝑡) is the input to the PD-HPA and 𝜁 is the PD-HPA saturation (clipping) threshold. Assuming that the baseband CDMA signal is characterized as a band-limited complex Gaussian process, we establish analytical expressions for the signal characteristics, with respect to the IBO level, that lead to BER degradation. Moreover, we develop an analytic expression for the BER performance in presence of the considered nonlinear amplifier chain.
II. RAKERECEIVER
In a mobile radio channel reflected waves arrive with small relative time delays, self interference occur. Direct Sequence (DS) Spread Spectrum is often claimed to have particular properties that makes it less vulnerable to multipath reception. In particular, the rake receiver architecture allows an optimal combining of energy received over paths with different [6]. It avoids wave cancellation (fades).If delayed paths arrive with phase differences and appropriately weighs signals coming in with different signal-to-noise ratios [2].
Performance and Analysis of DS-CDMA Rake Receiver and Analyzing the
BER Performance in Presence of Nonlinear Distortion in DS-CDMA System
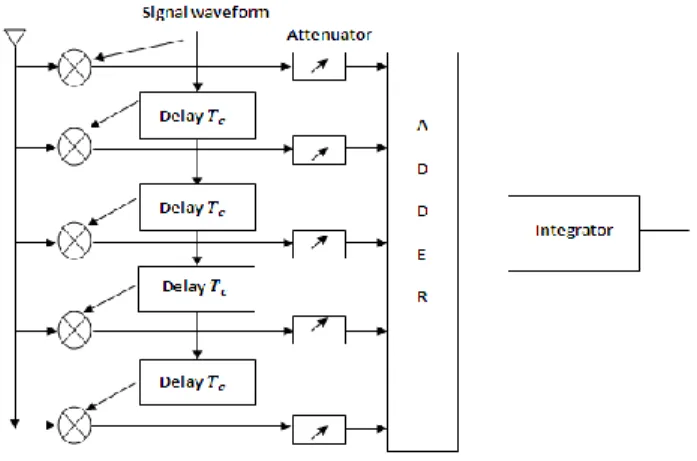
2 The rake receiver [3, 6] consists of multiple correlators,
in which the receive signal is multiplied by time-shifted versions of a locally generated code sequence. The intention is to separate signals such that each finger only sees signals coming in over a single (resolvable) path. The spreading code is chosen to have a very small autocorrelation value for any nonzero time offset. This avoids crosstalk between fingers. In practice, the situation is less ideal. It is not the full periodic autocorrelation that determines the crosstalk between signals in different fingers, but rather two partial correlations with contributions from two consecutive bits or symbols. It has been attempted to find sequences that have satisfactory partial correlation values, but the crosstalk due to partial (non-periodic) correlations remains substantially more difficult to reduce than the effects of periodic correlations the rake receiver is designed to optimally detect a DS-CDMA signal transmitted over a dispersive multipath channel. It is an extension of the concept of the matched filter [2, 9].
Fig 1: Matched Filter Receiver for AWGN Channel
In the matched filter receiver, the signal is correlated with a locally generated copy of the signal waveform. If, however, the signal is distorted by the channel, the receiver should correlate the incoming signal by a copy of the expected received signal, rather than by a copy of transmitted waveform. Thus the receiver should estimate the delay profile of channel, and adapt its locally generated copy according to this estimate [2, 7].
In a multipath channel, delayed reflections interfere with the direct signal. However, a DS-CDMA signal suffering from multipath dispersion can be detected by a rake receiver. This receiver optimally combines signals received over multiple Paths.
Fig 2: Rake Receiver with 5 Fingers
Like a garden rake, the rake receiver gathers the energy received over the various delayed propagation paths.
According to the maximum ratio combining principle, the SNR at the output is the sum of the SNRs in the individual branches, provided that,
1. We assume that only AWGN is present (no interference). 2. Codes with a time offset are truly orthogonal.
Signals arriving with the same excess propagation delay as the time offset in the receiver are retrieved accurately, because
𝑐12 𝑁
𝑛=1
𝑛𝑇𝑐+ 𝑡𝑑 = 𝑐12 𝑁
𝑛=1
𝑛𝑇𝑐 = 𝑁 (2)
This reception concept is repeated for every delayed path that is received with relevant power. Considering a single correlator branch, multipath self-interference from other paths is attenuated here, because one can choose codes such that [4].
𝑐1 𝑁
𝑛=1
𝑛𝑇𝑐 𝑐1 𝑛𝑇𝑐+ 𝑡𝑑 ≅ 0 (3)
III. MULTIPATHANDRAKERECEIVER
One of the main advantages of CDMA systems is the capability of using signals that arrive in the receivers with different time delays. This phenomenon is called multipath. FDMA and TDMA, which are narrow band systems, cannot discriminate between the multipath arrivals, and resort to equalization to mitigate the negative effects of multipath [5, 10]. Due to its wide bandwidth and rake receivers, CDMA uses the multipath signals and combines them to make an even stronger signal at the receivers. CDMA subscriber units use rake receivers. This is essentially a set of several receivers. One of the receivers (fingers) constantly searches for different multipath and feeds the information to the other three fingers. Each finger then demodulates the signal corresponding to a strong multipath. The results are then combined together to make the signal stronger [2].
Multipath Reception
Fig 3: Bit Error in Multipath Fading
IV. CDMASYSTEM PERFORMANCE
The system under investigation is a downlink CDMA system in which the users’ signals are synchronized and have equal power. The complex envelope of the CDMA signal for K active users is defined as [12], [13]
𝑠 𝑡 = 𝐸𝑘 𝑎𝑛 𝑘 𝑐𝑡 𝑘 𝐿−1
𝑙=0 ∞
𝑛=−∞ 𝐾
𝑘=1
ℎ 𝑡 − 𝑙𝑇𝑐− 𝑛𝑇
= 𝑥 𝑡 + 𝑗 ∗ 𝑦 𝑡 = 𝑟 (4)
Where 𝐸𝐾is the 𝐾𝑡ℎuser’s signal energy per bit, T is the symbol duration, L is the spreading factor,𝑇𝑐= 𝑇 𝐿is the chip duration, 𝐶𝑙(𝑘) is the 𝑙𝑡ℎchip in the spreading code
𝐶 𝑘 = 𝐶
0 𝑘 … … … … . . 𝐶𝐿−1 𝑘 𝑇
, h(t) is the impulse response of the transmit pulse shaping filter, and 𝑎𝑛(𝑘)= (±1 ± 𝑗)/√2 is the𝐾𝑡ℎ user’s symbol data for QPSK modulation in the 𝑛𝑡ℎ symbol duration. Moreover, the symbols 𝑎𝑛 𝑘 are assumed to be independent with zero mean and variance of 𝐸 𝑎𝑛(𝑘)
2
[12].
For a large number of users and assuming the pulse shaping filter corresponds to a square-root raised cosine filter (SRRC) with small roll-off factor, x(𝑡)and 𝑦(𝑡) can be regarded as two uncorrelated zero-mean Gaussian processes with equal variances, that is 𝜍𝑥2=𝜍𝑦2[14]. Hence, 𝑠(𝑡)can be regarded as a complex zero-mean Gaussian process with a variance of
𝜍𝑠2= 2𝜍𝑥2= 𝐸𝑘𝐸{ 𝐾
𝑘=1
𝑎𝑛 𝑘 2
} = 𝐾𝐸𝑘 (5)
Since 𝐶𝑙 𝑘 = 1. The envelope 𝑟 𝑡 = 𝑥2 𝑡) + +𝑦2(𝑡 has a quasi- Rayleigh distribution [14], with probability density function [13].
𝑓𝑟 𝑟 =
𝑟 𝜍𝑥2 𝑒
− 𝑟2
2𝜍𝑥2 𝑟 ≥ 0 (6) Finally, the output from the PD-HPA can be expressed as
𝑠𝑑 𝑡 = 𝑟𝑑 𝑡 𝑒𝑗 𝜃𝑑 𝑡 = 𝐺 𝑟 𝑡 𝑒𝑗𝜃 𝑡 (7)
V. BERPERFORMANCE ANALYSIS
Using the Bussgang theorem extension for a complex Gaussian input to a memory less nonlinear device, the output of the PD-HPA can be represented as the sum of two uncorrelated components: a scaled linear component and a nonlinear component,𝑠𝑛𝑙 𝑡 , [12], [14], [15], that is
𝑠𝑑 𝑡 =∝𝑜𝑠 𝑡 + 𝑠𝑛𝑙 𝑡 (8) Where 𝐸 𝑠 𝑡 𝑠𝑛𝑙∗ 𝑡 = 0and ∝𝑜is the linear gain given by
∝𝑜=
𝐸 𝑠 𝑡 𝑠𝑛𝑙∗ 𝑡
𝐸 𝑠 𝑡 2 =
𝐸 𝐺 𝑟 𝑟
2𝜍𝑥2 (9) Consequently, the variance of the distorted signal 𝑆𝑑 𝑡 is given by 𝜍𝑑2= 𝑎0 2𝜍𝑠2+ 𝜍𝑛𝑙2 where 𝜍𝑛𝑙2 is the variance of the nonlinear component𝑆𝑛𝑙 𝑡 . As far as 𝑠(𝑡)is considered as a zero-mean complex Gaussian process, 𝜍𝑑2can be calculated as
𝜍𝑑2= 𝐸 𝑠𝑑(𝑡) 2 = 𝐸 𝑟𝑑2(𝑡) = 𝑟𝑑2 ∞
0
𝑓𝑟(𝑟)𝑑𝑟
= 𝑟2𝑓 𝑟 𝑟 𝜁
0 𝑑𝑟 + 𝜁
2 𝑓
𝑟 𝑟 𝑑𝑟 ∞
𝜁 = 2𝜍𝑥
2 1 −−𝜁2
𝑒2𝜍𝑥2 (10)
Evaluating the BER in the case of an optimum receiver is difficult and tedious; hence, the BER for a suboptimum receiver is used as an upper bound [13]. We adopt the decorrelating receiver, where multi-user interference is eliminated [13], [15] at the expense of noise enhancing. For the decorrelating receiver, the 𝐾𝑡ℎ user BER is given by
𝐵𝐸𝑅𝐾 = 𝑄 𝑆𝑁𝑅𝑘 (11) Where𝑆𝑁𝑅𝑘is the signal-to-noise ratio at the 𝐾𝑡ℎ receiver
and 𝑄 𝑘 = 𝑒
−𝑢 2 2
√2𝜋 ∞
𝑥 𝑑𝑢 .Including Additive White Gaussian Noise (AWGN), 𝑆𝑁𝑅𝑘is given by [13, eq. (15.3-65, 67)]
𝑆𝑁𝑅𝑘= 𝑆𝑁𝑅𝐴𝑊𝐺𝑁 ,𝑘 =𝜍𝑠,𝑘 2
𝜍𝑛,𝑘2 =
𝐸𝑘
𝜀𝑘𝜍𝑛2 (12) Where 𝑆𝑁𝑅𝐴𝑊𝐺𝑁 is the SNR due to AWGN only, 𝜍𝑛2isthe variance of the AWGN and𝜀𝑘 = 𝑅𝑠−1 𝑘,𝑘 is the noise enhancement factor introduced by the decorrelating receiver [13], where Rs is the correlation matrix with elements𝜌𝑗𝑘 0 defined as𝜌𝑗𝑘 0 = 𝑐 𝑗
𝑇
𝑐 𝑘 .
In the presence of a nonlinear amplifier, the SNR measured at the 𝐾𝑡ℎreceiver input is the ratio of the transmitted distorted signal power 𝜍𝑑2= 𝑎0 2𝜍𝑠2+ 𝜍𝑛𝑙2 to the noise power 𝜍𝑛,𝑘2
𝑆𝑁𝑅𝑘 =
𝜍𝑑,𝑘2
𝜀𝑘𝜍𝑛2=
𝜍𝑠,𝑘2 (1 − 𝑒 −𝜁2
2𝜍𝑥2)
𝜀𝑘𝜍𝑛2
= 𝑆𝑁𝑅𝐴𝑊𝐺𝑁,𝑘 1 − 𝑒
−𝜁2
2𝜍𝑥2 (13)
Actually, once the PD-HPA is designed, its saturation threshold is fixed. However, the clipping threshold with respect to the input signal to the PD-HPA depends on the signal average power. Therefore, it is more convenient to relate the threshold 𝜁 to IBO, where the IBO is the ratio of the input power at the PD-HPA saturation threshold to the signal average power. This relation allows the system operator to determine the optimum IBO required, according to the design demands. Hence, the threshold level can be defined thru the IBO,𝛾, multiplied by the signal average power𝑃𝑎𝑣, that is
𝜁 = 𝑃𝑎𝑣∗ 𝛾 = 𝜍𝑛2∗ 𝛾 (14)
The term 𝑒
−𝜁2
2𝜍𝑥2in (13) represents the probability that the
signal envelope exceeds the threshold 𝜁, equivalently the threshold exceeding rate RE, which using (14) is written as
𝑅𝐸= 𝑒 −𝜁2
2𝜍𝑥2 = 𝑒−𝛾 (15) Substituting (15) in (13) and then in (11), the BER in presence of the PD-HPA as a function of the IBO level has the form
𝐵𝐸𝑅𝑘= 𝑄 𝑆𝑁𝑅𝐴𝑊𝐺𝑁,𝑘 1 − 𝑅𝐸 (16)
From (16), it is clear that the threshold exceeding rate𝑅𝐸 is the main contributor to BER degradation; by minimizing𝑅𝐸,
4
resulting in expected BER degradation. Effectively, errors are introduced in advance at the transmitter.
Actually,𝑅𝐸is not the only contributor to BER degradation since the BER in (16) is based on the SNR in (12). Such SNR is the apparent SNR since an increase in the nonlinear component variance 𝜍𝑛𝑙 ,𝑘2 as part of𝜍𝑑,𝑘2 in (11) increases the SNR, although effectively deteriorates the BER [15], [16]. While the effective SNR, where the non-linear signal 𝑠𝑛𝑙 𝑡 in (8) is assumed Gaussian distributed [12], is defined as [15]
𝑆𝑁𝑅𝑒𝑓𝑓 ,𝑘=
𝛼02𝜍𝑠,𝑘2
𝜍𝑛,𝑘2 + 𝜍𝑛𝑙 ,𝑘2
= 𝛼0 2𝜍𝑠,𝑘
2
𝜍𝑛,𝑘2 + 𝜍𝑑,𝑘2 − 𝛼0 2𝜍𝑠,𝑘2
= 𝛼0 2𝜍𝑠,𝑘
2
𝜍𝑛,𝑘2 + 𝜍𝑠,𝑘2 (1 − 𝑅𝐸− 𝛼0 2) (17) Substituting (17) in (11), the BER in presence of the PD-HPA, according to𝑆𝑁𝑅𝑒𝑓𝑓 ,𝑘 , has the form
𝐵𝐸𝑅𝑘= 𝑄
𝛼02
1 − 𝑅𝐸− 𝛼0 2+ (𝑆𝑁𝑅𝐴𝑊𝐺𝑁,𝑘)−1 (18)
Looking to the linear gain𝛼0 , it can be expanded as
𝛼0=
1
2𝜍𝑥2 𝑟𝑑𝑟 ∞
0
𝑓𝑟 𝑟 𝑑𝑟
= 1 2𝜍𝑥2 𝑟
2 𝜁
0
𝑓𝑟 𝑟 𝑑𝑟 + 𝜁 𝑟𝑓𝑟 𝑟 𝑑𝑟 ∞
𝜁
= 1 − 𝑒−
𝜁2 2𝜍𝑥2+1
2 𝜋𝜁2
2𝜍𝑥2 𝑒𝑟𝑓𝑐
𝜁 2𝜍𝑥2
= 1 − 𝑅𝐸+√𝜋𝛾2 𝑒𝑟𝑓𝑐 𝛾 (19) The output of the PD-HPA can be written as
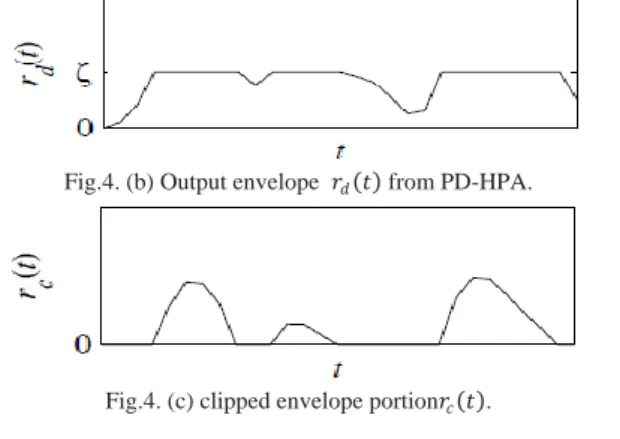
𝑆𝑑 𝑡 = 𝑟𝑑 𝑡 𝑒𝑗𝜃 𝑡 = 𝑟 𝑡 − 𝑟𝑐 𝑡 𝑒𝑗𝜃 𝑡
= 𝑠 𝑡 − 𝑠𝑐 𝑡 (20) Where𝑆𝑐 𝑡 = 𝑟𝑐 𝑡 𝑒𝑗𝜃 𝑡 is the signal portion that is clipped from𝑆(𝑡),𝐸 𝑆𝑐(𝑡) = 0, and its envelope𝑟𝑐(𝑡) has the form
𝑟𝑐 𝑡 = 𝑟 𝑡 − 𝑟𝑑 𝑡
= 0 , 𝑟 𝑡 ≤ 𝜁 = 𝑟 𝑡 − 𝜁, 𝑟 𝑡 > 𝜁 (21)
Examples of 𝑟 𝑡 ,𝑟𝑑 𝑡 , and 𝑟𝑐 𝑡 are shown in Fig. 4(a), Fig. 4(b), and Fig. 4(c), respectively.
The variance 𝜍𝑐2 of 𝑆𝑐 𝑡 can be derived using the definitionof the envelope of the clipped signal portion in (21) as
𝜍𝑐2= 𝐸 𝑆𝑐 𝑡 2 = 𝐸 𝑟𝑐2 𝑡 = 𝑟 − 𝜎 2 ∞
𝜎 𝑓𝑟
𝑟 𝑑𝑟
= 2𝜍𝑥2𝑒 −𝜁2
2𝜍𝑥2− 2𝜋𝜍
𝑥2𝜎𝑒𝑟𝑓𝑐
𝜁 2𝜍𝑥2
= 2𝜍𝑥2(𝑒−𝑦− 𝜋𝛾 𝑒𝑟𝑓𝑐 𝛾 (22)
Fig.4. (a) Input envelope 𝑟 𝑡 to PD-HPA.
Fig.4. (b) Output envelope 𝑟𝑑 𝑡 from PD-HPA.
Fig.4. (c) clipped envelope portion𝑟𝑐 𝑡 .
Rearranging (22) and substituting into (19), 𝛼𝑜is given by
𝛼𝑜 = 1 −
1 2𝑒−𝛾−
1 4𝜍𝑥2𝜍𝑐
2= 1 − 1
2𝑅𝐸−
1 4𝜍𝑥2𝜍𝑐
2 (23)
From (23) as part of (16), it is clear that 𝑅𝐸and 𝜍𝑐2are the main contributors to the BER performance; decreasing𝑅𝐸 and𝜍𝑐2, increases𝛼0, increases𝑆𝑁𝑅𝑘, and in turn improves BER.
VI. ALGORITHMANDIMPLEMENTATION
In this section, discussing about the MATLAB algorithm and implementation techniques
i. Generate a fifteen bit user data for each user to simulate with Rake or without Rake on MATLAB.
ii. Generate a PN sequence data for every user.
iii. Generate code data by multiplication of user data and PN sequence.
iv. Add AWGN noise with the code and we create multiple path with different attenuation, every multipath add random noise to code so at the end of path we will get multiple code with different noise.
v. Comparing the BER performance of WITH and WITHOUT Rake receiver for different attenuation factors.
VII. SIMULATIONRESULTS
Here we are observing the performance of CDMA system with and without rake receiver. Figure 5 shows that the performance of CDMA system with and without rake receiver for different attenuation factors to minimize the Bit Error Rate.
Fig 5: Performance of CDMA system with and without rake receiver.
Figure 6 shows that performance of multipath using rake receiver in CDMA system and figure 7 shows that BER performance for conventional CDMA and proposed RAKE Receiver.
0 5 10 15 20 25 30 35
10-5 10-4 10-3 10-2 10-1 100
...EbNo
...B
E
R
performance analysis of with and without rake receiver
To assess the validity of the derived expressions for the factors contributing to BER degradation, 𝑅𝐸and 𝜍𝑐2, and the linear gain 𝛼0, a 64-user CDMA signal filtered using an SRRC filter with Walsh codes of length L = 64 is simulated.
𝑅𝐸,𝜍𝑐2, and 𝛼0are measured for the simulated signal and compared against the analytic expressions in (15), (22), and (23), respectively. The relations of such factors versus IBO are shown in Fig. 8, where the agreement between the analyticcurves and simulated points confirms the analytic derivations.
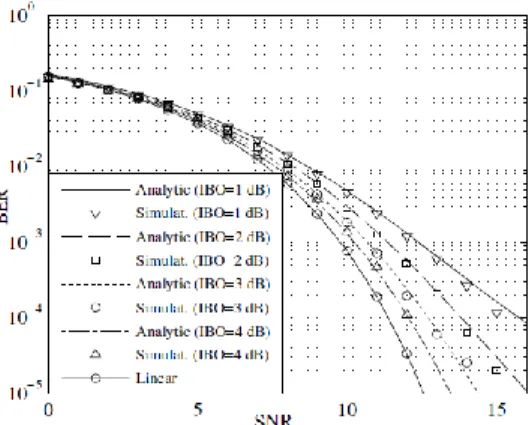
Finally, the analytically derived BER is computed from (16) and compared against the BER measured from simulation. Fig. 9 shows the BER curves, where it is evident that good agreement exists between the analytic curves and the measured points for all IBO levels.
Fig 6: performance of multipath using rake receiver in CDMA system.
Fig 7: BER graph for conventional and proposed systems
Fig.8. Analytic and simulated plots of𝑅𝐸, 𝜍𝑐2, and 𝛼𝑜 over a range of IBOs.
Fig.9 Analytic and simulated plots of BER at different IBO levels.
CONCLUSION
In this paper, Rake receiver is used for CDMA technique rather than using conventional CDMA with matched filter. Rake receiver is used to minimize the bit error rate and obtain maximum signal to noise ratio.
In this how nonlinear distortion due to PD-HPA affects BER degradation for transmitted DS-CDMA signals. We established analytically how the threshold exceeding rate 𝑅𝐸 and the variance of the clipped portion of the signal𝜍𝑐2. contribute to BER degradation. The motivation of this work is to provide system designers/operators with efficient tools that provide potential insight into the interactions between CDMA signals and the nonlinear PD-HPA, leading to better understanding of the impact of the PD-HPA on system BER. Moreover, establishing these characteristics for the input signal in relation to the PD-HPA characteristics opens new avenues for research to minimize the effect of nonlinear distortion before the signal even hits the amplifier. For instance, in search and optimization techniques such as the selected mapping technique, where many representations of the same signal are generated and the one that achieves the minimum of these characteristics is selected for transmission.
REFERENCES
[1] Peter Flanagan, ―Personal Communications Services: The Long Road Ahead,‖ Telecommunications, February 1996.
[2].http://wireless.per.nl/reference/chaptr05/cdma/rake.htm. [3] W. C. Y. Lee, ―Overview of Cellular CDMA,‖IEEE Trans. On
Vehicular Technology, Vol. 40, no. 2, pp. 291-302, May 1991. [4] R. A. Cameron and B. D. Woerner, ―An Analysis of CDMA with
Imperfect Power Control,‖ Proceedings of 42nd IEEE Vehicular Technology Conference, Denver, CO, pp. 977-980, 1992. [5] R. Lupas and S. Verdu, ―Linear Multiuser Detectors for
Synchronous Code Division-Multiple-Access Channels,‖ IEEE Trans. Info. Theory, vol. 35, no.1, pp. 123-136, Jan. 1989. [6]. K.Murali.Krishna, Abhijit Mitra and Cemal Ardil‖ A Simplified
Single Correlator Rake, Receiver for DMA Communications‖ International Journal of Information Technology Volume 2 Number 4 2005.
[7] P. Jung, P. W. Baier, and A. Steil, ―Advantages of CDMA and Spread Spectrum Over FDMA and TDMA in Cellular Mobile Radio Applications,‖ IEEE Transactions Vehicular Technology, Vol. 42, no. 3, pp. 357- 364, August 1993
[8] Electronic Industries Association, ―Cellular System Dual-Mode Mobile Station Base Station Compatibility Standard,‖ IS-54, May 1990.
2 3 4 5 6 7 8 9 10 11 12
10-3 10-2 10-1 100
---Ebno(dB)
---B
E
R
Multiple paths of rake receiver
1-path 2-path 3-path 4-path
2 4 6 8 10 12 14 16 18 20
10-4 10-3 10-2 10-1 100
---Ebno (dB)
--B
E
R
Performance analysis of the with and without rake receivers
6 [9] K. S. Gilhousen, ―On the Capacity of a Cellular CDMA
System,‖IEEE Transactions on Vehicular Technology, Vol. 40, no. 2, pp. 303-311,May 1991.
[10] Electronic Industries Association, ―Wideband Spread Spectrum Digital Cellular System Dual Mode Mobile Station - Base Station Compatibility Standard,‖ IS-95, April, 1992.
[11] J. C. Liberti and T. S. Rappaport, ―Analytical Results for Capacity Improvements in CDMA,‖ IEEE Transactions on Vehicular Technology, Vol.43, No. 3, pp. 680-690, August 1994.
[12] A. Conti, D. Dardari, and V. Tralli, ―An analytical framework
for CDMA systems with a nonlinear amplifier and AWGN,‖
IEEE Trans. Commun.vol. 50, no. 7, pp. 1110–1120, July 2002.
[13] J. Proakis, Digital Communications, 4th ed. McGraw-Hill, 2000.
[14] R. Dinis and A. Palhau, ―A class of signal-processing schemes
for reducing the envelope fluctuations of CDMA signals,‖ IEEE
Trans. Commun., vol. 53, no. 5, pp. 882–889, May 2005.
[15] L. Rugini, P. Banelli, and S. Cacopardi, ―Theoretical analysis and performance of the decorrelating detector for DS-CDMA
signals in nonlinear channels,‖ IEEE Trans. Wireless Commun.,
vol. 3, no. 2, pp. 367–372, Mar. 2004.
[16]P. Banelli and S. Cacopardi, ―Theoretical analysis and
performance of OFDM signals in nonlinear AWGN channels,‖
IEEE Trans. Commun., vol. 48, no. 3, pp. 430–441, Mar. 2000
ABOUT THE AUTHORS
Mr. Y MOHAN REDDY received B.Tech degree from JNT University, Anantapur and is pursuing his M.Tech degree from JNT University, Anantapur. He presented 2 technical papers in various national level conferences. His area of interest is wireless communication.
Mr.K.MANJUNATH working as Assistant Professor in the department of ECE in SITAMS, chittoor. He received B.Tech degree from Anna University, Chennai and M.Tech degree from VIT University, Vellore. He presented 2 technical papers in various national level conferences. His areas of interest is digital image processing and wireless networks.