R E S E A R C H
Open Access
Epigenetic predictors of all-cause mortality
are associated with objective measures of
neighborhood disadvantage in an urban
population
Cavin K. Ward-Caviness
1*, Shirley Pu
2, Chantel L. Martin
3,4, Sandro Galea
5, Monica Uddin
6, Derek E. Wildman
6,
Karestan Koenen
7and Allison E. Aiello
3,4Abstract
Background:Neighborhood characteristics are robust predictors of overall health and mortality risk for residents. Though there has been some investigation of the role that molecular indicators may play in mediating
neighborhood exposures, there has been little effort to incorporate newly developed epigenetic biomarkers into our understanding of neighborhood characteristics and health outcomes.
Methods:Using 157 participants of the Detroit Neighborhood Health Study with detailed assessments of
neighborhood characteristics and genome-wide DNA methylation profiling via the Illumina 450K methylation array, we assessed the relationship between objective neighborhood characteristics and a validated DNA methylation-based epigenetic mortality risk score (eMRS). Associations were adjusted for age, race, sex, ever smoking, ever alcohol usage, education, years spent in neighborhood, and employment. A secondary model additionally adjusted for personal neighborhood perception. We summarized 19 neighborhood quality indicators assessed for
participants into 9 principal components which explained over 90% of the variance in the data and served as metrics of objective neighborhood quality exposures.
Results:Of the nine principal components utilized for this study, one was strongly associated with the eMRS (β= 0.15; 95% confidence interval = 0.06–0.24;P= 0.002). This principal component (PC7) was most strongly driven by the presence of abandoned cars, poor streets, and non-art graffiti. Models including both PC7 and individual indicators of neighborhood perception indicated that only PC7 and not neighborhood perception impacted the eMRS. When stratified on neighborhood indicators of greenspace, we observed a potentially protective effect of large mature trees as this feature substantially attenuated the observed association.
(Continued on next page)
© The Author(s). 2020Open AccessThis article is licensed under a Creative Commons Attribution 4.0 International License, which permits use, sharing, adaptation, distribution and reproduction in any medium or format, as long as you give appropriate credit to the original author(s) and the source, provide a link to the Creative Commons licence, and indicate if changes were made. The images or other third party material in this article are included in the article's Creative Commons licence, unless indicated otherwise in a credit line to the material. If material is not included in the article's Creative Commons licence and your intended use is not permitted by statutory regulation or exceeds the permitted use, you will need to obtain permission directly from the copyright holder. To view a copy of this licence, visithttp://creativecommons.org/licenses/by/4.0/. The Creative Commons Public Domain Dedication waiver (http://creativecommons.org/publicdomain/zero/1.0/) applies to the data made available in this article, unless otherwise stated in a credit line to the data.
* Correspondence:[email protected]
1Center for Public Health and Environmental Assessment, US Environmental
(Continued from previous page)
Conclusion:Objective measures of neighborhood disadvantage are significantly associated with an epigenetic predictor of mortality risk, presenting a potential novel avenue by which neighborhood-level exposures may impact health. Associations were independent of an individual’s perception of their neighborhood and attenuated by neighborhood greenspace features. More work should be done to determine molecular risk factors associated with neighborhoods, and potentially protective neighborhood features against adverse molecular effects.
Keywords:DNA methylation, Social determinants of health, Neighborhood disadvantage, Mortality predictors, Urban populations
Background
The role of neighborhood characteristics in health can-not be overstated. Virtually, every characteristic of a neighborhood, here used broadly to define a relatively small area containing a residence, has been linked with the health and well-being of its residents including the chemical environment [1], the built environment [2, 3], the social and economic environment [4–6], and even individual perceptions of the neighborhood [7–9]. Though much of the existing research on the relation-ship between neighborhood characteristics and health has focused on overt health outcomes, like chronic dis-ease and mortality, there is an increasing appreciation of the molecular alterations that may accompany residence in socioeconomically and built environment disadvan-taged neighborhoods and that may explain the biological process through which exogenous factors like neighbor-hood characteristics“get under the skin.”
The stress pathway has been the most widely studied pathophysiologic pathway to explain how neighborhood characteristics impact health, as negative neighborhood characteristics are thought to chronically elevate stress levels. Allostatic load is a biomarker that incorporates multiple aspects of health, in particular stress-related health outcomes (e.g., blood pressure and cortisol), with higher allostatic load indicative of poorer health [10,11]. Multiple studies have reported that allostatic load is in-creased for those living in stressful and socioeconomi-cally disadvantaged neighborhoods [12, 13]. In addition to allostatic load, molecular markers of inflammation [14, 15] and accelerated aging [16, 17] are associated with exposure to adverse chemical and socioeconomic environments. In the reverse of these studies, neighbor-hood factors associated with positive health outcomes, e.g., greenspace, have been associated with improved levels of molecular biomarkers for allostatic load and in-flammation [18], demonstrating that both positive and negative neighborhood characteristics might impact mo-lecular indicators of health.
One of the most promising molecular markers to study health impacts is DNA methylation. DNA is primarily methylated at cytosine of cytosine-phosphate-guanine (CpG) dinucleotides. DNA methylation is a central process
by which the expression of genes is regulated in both a cell type-specific and temporal manner [19]. DNA methylation altered by exposure to both the chemical and non-chemical (i.e., socioeconomic) environment, and alterations in DNA methylation are associated (in some cases with causal evi-dence) with a variety of health outcomes including meta-bolic outcomes [20, 21], cardiovascular disease [22–24], cancer [25,26], and mortality [27,28].
Recent advances in DNA array technology and data availability have allowed researchers to develop DNA methylation-based biomarkers for outcomes such as ac-celerated aging [29], chronic disease risk [30], and mor-tality risk [27, 31]. For aging, there has been substantial work showing that DNA methylation age is accelerated by adverse environmental exposures [17]. For other epi-genetic biomarkers, there has been little research to evaluate their response to the external environment, in particular neighborhood characteristics. Here, we evalu-ate the degree to which objective measures of neighbor-hood quality/disadvantage, such as the condition of the street and buildings and lack of greenspace, are associ-ated with a validassoci-ated epigenetic mortality risk score (eMRS) [27, 31]. We further do this in a predominantly African-American cohort, an understudied racial group in the field of epigenetics.
Results
For the 157 participants in this analysis, the mean age was 53.3 years (standard deviation = 13.8 years), 61.8% (97) were female, and 87.9% were African-American. At initial enrollment, 20.4% (32) of the participants in this analysis reported never smoking, and 47% (74) had at least some college education (Table 1). At the baseline assessment, 126 participants (80.3%) reported that they liked their neighborhood either “somewhat” or “a great deal”as a place to live.
of their neighborhood was not independently associated with the eMRS in the model containing PC7 (Table2). The asso-ciation appeared to be primarily driven by female partici-pants (Fig. 1). Blood samples for the participants in this study came from two survey waves. Of the 157 participants, 111 (71%) came from wave 2. When stratifying on wave 2 participants, we observed minimal change in the association with PC7 (effect estimate = 0.16; 95% CI = 0.05–0.26; P= 0.004). The top positive loadings for PC7 were factors associ-ated with the presence of abandoned cars, people present on the street, and non-art graffiti. In addition, the presence of alcohol advertising had a negative loading, as well as the street being in poor condition (Supplemental Table1).
In a sensitivity analysis, none of the individual neigh-borhood characteristics were associated with the eMRS in isolation after correcting for the 19 associations per-formed. Only one, HQ11 indicating if the streets in the neighborhood are in poor condition, had even a nominal
(P< 0.05) association (Supplemental Table3). This sug-gests that associations between neighborhood features and the eMRS are strongest when multiple features are combined.
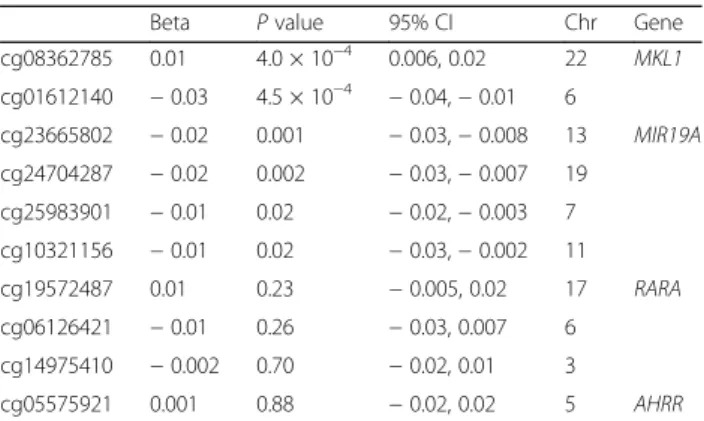
PC7 was associated with 4 of the 10 CpGs composing the eMRS atP< 0.005 (which adjusts for the 10 associa-tions performed in this sensitivity analysis). For all but one of the PC7-CpG associations withP< 0.005, the dir-ection of association was consistent with the eMRS-PC7 association after accounting for the direction of associ-ation for the CpG with the eMRS observed by Zhang et al. [27] (Table 3). This indicates that PC7 may be as-sociated with multiple epigenetic loci that are predictive of mortality, an association which is even stronger (by effect size) when aggregated into an eMRS.
When stratified by sex, the associations appeared to be driven by women (Fig. 1). Although PC9 also appeared to have a sex-specific association, we did not consider this in the sex-specific analysis as there was no PC9-eMRS association in the primary analysis, and even the sex-specific association would not have been significant after adjusting for the number of tests performed.
The presence of greenspace has been implicated as a potentially protective environmental factor for health outcomes [2, 32]. The presence of large, mature, trees and the presence of community gardens were two assessed neighborhood characteristics that could speak to the presence of greenspace, and both were uncorre-lated with PC7 (Pearson’sr2= 0.004 and 0.001, respect-ively). To evaluate the impact of greenspace, we examined if associations between PC7 and the eMRS were attenuated in individuals residing in neighborhoods where the percentage of street segments with large ma-ture trees was above the median (> 84.2%) or in neigh-borhoods with at least one community garden observed. Indeed, individuals residing in neighborhoods with above median levels of large mature trees saw an 85% attenu-ation of the PC7-eMRS associattenu-ation as compared to the entire cohort (Fig.2). Conversely, the PC7-eMRS associ-ation was elevated for individuals with below median levels of large mature trees as compared to the overall cohort. For community gardens, we observed a smaller attenuation towards the null (52%) when comparing communities with no community gardens to those with one or more. The 95% confidence intervals of the strati-fied associations for community gardens largely over-lapped indicating a weaker attenuation than seen with large mature trees which should be regarded cautiously given the small sample sizes (Fig.2). The attenuation of associations in neighborhoods with greenspace extended even to the individual CpGs which compose the eMRS, as associations were substantially attenuated for individ-uals living in neighborhoods with above median levels of large mature trees or community gardens as compared
Table 1Description of Detroit Neighborhood Health Study participants used in this analysis
Cohort description Mean SD
Age (years) 53.3 13.8
Years lived in neighborhood (years) 18.6 16.9
B cell (%) 8.12 3.93
Monocytes (%) 8.64 2.97
Granulocytes (%) 53.5 11.7
CD4-T cells (%) 16.9 7.42
CD8-T cells (%) 10.7 6.13
Natural killer cells (%) 7.85 5.85
N %
Sex (female) 97 61.8
Never smokers 43 27.4
Never drinkers 32 20.4
Education (kindergarten–eighth grade) 2 1.27
Education (some high school) 26 16.6
Education (high school equivalent) 14 8.92
Education (high school graduate) 41 26.1
Education (some college) 46 29.3
Education (college graduate) 20 12.7
Education (post-graduate degree) 8 5.1
Employed 46 29.3
Close knit neighborhood (strongly or somewhat agree)
87 55.4
Like the Neighborhood (somewhat–a great deal)
126 80.3
White 17 10.8
Black or African-American 138 87.9
Other 2 1.27
to individuals living in neighborhoods with below me-dian levels of large mature trees or no community gar-dens (Supplemental Table 4). Inflammation may be one mechanism by which the external environment is associ-ated with epigenetic mortality risk. Blood immune cell counts can be used to examine the impact of inflamma-tion on associainflamma-tions, which would not be considered confounders here (as they might in an epigenome-wide association study) as inflammation is a mechanism by which the exposure may act on the outcome. In Supple-mental Table5, we show the Pearson correlation (r2) be-tween each principal component and six cell counts
(estimated from DNA methylation data using the Houseman method). For PC7, correlations were fairly weak and ranged from 5.9 × 10⁻⁵to 0.07. Adjusting for cell counts reduced the overall association as well as for neighborhoods with community gardens. Associations were still present for neighborhoods without large ma-ture trees (Supplemental Table 6), indicating that while inflammatory status likely plays a role in associations, at least for neighborhoods without large mature trees, there persists a component likely independent of inflammation as reflected in changes in blood immune cell counts.
Discussion
Using data from residents of Detroit, we find that a re-cently developed epigenetic biomarker of mortality [27] is associated with summary measures of neighborhood char-acteristics constructed from objective measures of
neigh-borhood characteristics which are indicative of
neighborhood advantage/disadvantage based primarily on the quality of the built environment (Supplemental Table 2). The continuous epigenetic mortality score developed by Zhang et al. [27] is a strong predictor of mortality, and in an independent validation study, a one unit increase was associated with a 2.64-fold increase (95% confidence interval, 1.98–3.52) in all-cause mortality risk [31]. We found that PC7, a principal component driven by neigh-borhood characteristics such as the number of abandoned Fig. 1Association between principal components for neighborhood quality and eMRS. Each of the principal components (PCs) for neighborhood quality was associated with the epigenetic mortality risk score (eMRS [27]) in a model adjusted for age sex, race (White, African-American, and Other), ever smoking, ever alcohol usage, years spent residing in neighborhood, education (binary indicator for some college or more), and employment (binary indicator for employed vs unemployed). Squares and triangles represent models stratified on sex (males and females, respectively), and in such models, the term for sex was removed. Principal components are numbered in order of their ranking of the percent variance explained, and only the top nine were examined as they explained > 90% of the variance as detailed in the“Methods”section
Table 2Assessment of both objective and subjective
neighborhood measures in association with epigenetic mortality risk score
Variable Effect estimate 95% CI Pvalue
PC7 0.15 0.06, 0.25 0.002
Close knit neighborhood 0.08 −0.07, 0.23 0.30
Good place to live 0.01 −0.18, 0.20 0.93
cars observed, people being present outside on the street, and non-art graffiti (Supplemental Table1, Supplemental Table 2), was associated with higher epigenetic risk of mortality (Fig.1).
Greenspaces have been promoted as a protective envir-onmental measure against adverse health outcomes [2,32, 33], and may even be able to attenuate the effect of other adverse chemical or social environmental exposures. In a study of more than 40,000,000 adults, the association be-tween all-cause mortality and income deprivation was lowest in the most green areas [34]. The presence of large, mature trees substantially attenuated the association be-tween PC7 and the eMRS, indicating a potentially coun-teractive effect of greenspace indicators against the adverse community factors represented by PC7. We saw less attenuation with stratification on the presence of community gardens, and the differences in the observed associations may have been driven by chance. However, these stratified analyses should be considered preliminary and interpreted with a note of caution given the small sample sizes and overlapping confidence intervals for the analysis of community gardens in particular. We also can-not discount that the presence of community gardens may not only be reflective of increased greenness in a neigh-borhood, but might also reflect altered dietary conditions through access to fresh foods.
Fig. 2Association between PC7 and eMRS stratified on indicators of neighborhood greenspace. To examine if associations were potentially modified by exposure to greenspace, we stratified associations between neighborhood principal component 7 (PC7) and the epigenetic mortality risk score (eMRS [27]). Associations appeared to be substantially stronger in neighborhoods with greater than the median presence of large mature trees (Trees (High)) and with community gardens (Gardens) as compared to neighborhoods with below median presence of large mature trees (Trees (Low)) and no observed community gardens (No Gardens). The median presence of large mature trees was 84.2%. Gray bar indicates region as defined by the 95% confidence interval for the overall association
Table 3Association between PC7 and components of the eMRS
Beta Pvalue 95% CI Chr Gene
cg08362785 0.01 4.0 × 10⁻⁴ 0.006, 0.02 22 MKL1
cg01612140 −0.03 4.5 × 10⁻⁴ −0.04,−0.01 6
cg23665802 −0.02 0.001 −0.03,−0.008 13 MIR19A
cg24704287 −0.02 0.002 −0.03,−0.007 19
cg25983901 −0.01 0.02 −0.02,−0.003 7
cg10321156 −0.01 0.02 −0.03,−0.002 11
cg19572487 0.01 0.23 −0.005, 0.02 17 RARA
cg06126421 −0.01 0.26 −0.03, 0.007 6
cg14975410 −0.002 0.70 −0.02, 0.01 3
cg05575921 0.001 0.88 −0.02, 0.02 5 AHRR
While there have been multiple studies linking area-level neighborhood features (or correlates of these fea-tures) with altered DNA methylation [35–40], there has been limited research on measures of the built environ-ment and their potential link to epigenetic variation. In a candidate gene study of older adults, a summary meas-ure taking into account both the neighborhood physical environment (esthetic quality) as well as features like crime and social cohesion was associated with epigenetic variation in multiple stress-related genes [41]. The asso-ciations observed in this study were independent of both individual measures of socioeconomic status (e.g., em-ployment and education) and perceptions of the neigh-borhood (including social cohesion), indicating that objective neighborhood characteristics may impact health biomarkers independent of perception and indi-vidual socioeconomic status. This observation contrasts with some research suggesting that objective neighbor-hood quality measures may be largely associated with health outcomes through subjective perception of the neighborhood [8,9,42]. However, these previous studies focused mostly only overt (and often self-reported) health outcomes and not molecular measures which may reflect underlying molecular alterations which pre-cede overt health outcomes.
As DNA methylation is an individual measure, it does ne-cessitate that there be some individual-acting mechanism linking neighborhood characteristics and altered DNA methylation. There are multiple individual-acting mecha-nisms which may account for associations with area-level characteristics including induced stress, exposure to envir-onmental conditions unique to socioeconomically disad-vantaged neighborhoods, and limited access to resources such as quality groceries and healthcare. Some of these mechanisms have existing evidence as a means by which neighborhood characteristics can impact individual-level measures [43, 44]. Other factors which may impact these associations are individual-level behavioral factors such as smoking. Though we did control for individual-level behav-ioral factors like smoking in the models, there may still be components of this mechanism which impact associations through variables not included in the models, e.g., time since quitting. Though the correlation between PC7 and cell counts was low (Supplemental Table5), adjustment for cell counts did substantially attenuate associations. Interest-ingly, this attenuation was not observed in neighborhoods with below median levels of large mature trees (Supple-mental Table 6). This could indicate that inflammation, reflected in changes in inflammatory cell counts, could be a potential mediating mechanism, but that other mechanisms still persist in neighborhoods derived of greenspace. Given the small sample size, it is beyond the means of this study to fully explore these potential mechanisms, but they should be investigated in future studies to provide a deeper
understanding of the mechanisms by which neighborhood characteristics impact health.
Some of the strengths of this study include the robust assessment of objective neighborhood characteristics by trained assessors as opposed to self-report by the resi-dents. This allowed perceptions of the neighborhood by those residing there to be separated from objective neighborhood characteristics. A limitation of the study is that some variables which may modify associations ob-served were not collected, such as specific occupation. If certain occupational exposures clustered in neighbor-hoods, then this could confound or modify associations. However, the clustering would have to fall along the lines of the principal components, and the eMRS would have to be associated with the specific occupations which cluster in neighborhoods—which has yet to be shown. Future studies should investigate both the associ-ation between the eMRS and occupassoci-ational exposures as well as attempt to account for occupation should such associations be found. A limitation of the study is the small sample size. Given the limited sample size, we fo-cused on a relevant DNA methylation-based biomarker, as opposed to genome-wide variation, and utilized the continuous form of the eMRS, to maximize power. The limited sample size also impacted our ability to investi-gate potentially relevant stratifications in this cohort, and could not, for example, study the joint impact of large mature trees and community gardens as < 25 par-ticipants had positive indications for both these mea-sures. However, this study is strengthened by using a biomarker derived in an independent sample, which pre-vents a potential increase in false positives arising from using the same samples to both derive a biomarker and then use that biomarker for analyses. Though the eMRS has not been evaluated in a primarily African-American sample, it has shown strong and consistent prediction in three independent cohorts [27, 31] and similar epigen-etic biomarkers have shown validity across ethnicities [17,28]. Additionally, though this study focused on resi-dents of a single urban area, the epigenetic mortality risk score has been validated in residents of urban areas in Europe and the USA [27,31].
Conclusions
into health disparities, researchers should continue to ex-plore DNA methylation biomarkers and individual loci to more fully understand the biological and socioeconomic implications of these associations.
Methods
Cohort
The Detroit Neighborhood Health Study (DNHS) is a pro-spective cohort study conducted in the metropolitan area of Detroit, Michigan, and was designed to provide a ran-dom sample of the city that reflects the demographics of the city. Study coordinators collected a cohort of adult De-troit residents, with surveys and sample collection begin-ning in the year 2008 and continuing annually until 2012. Study enrollment and annual assessments were conducted via telephone, and the structured interviews were designed to collect detailed information on participant’s neighbor-hood perception, alcohol and tobacco usage, social sup-port, and health. Additionally, DNHS participants were offered the opportunity to provide a biospecimen sample at their baseline assessment. Of 1547 DNHS participants, 612 consented to providing a blood sample, and these 612 did not differ significantly in sociodemographic profiles from the entire cohort [45]. Informed consent was ob-tained from all participants, and the study protocol was approved by the University of Michigan Institutional Re-view Board (HUM00014138) [46,47].
As part of the baseline survey, a structured assessment of objective neighborhood characteristics was under-taken by trained assessors. In the assessment, 135 census block groups, defined according to the 2000 Census, were visited by a pair of 26 trained assessors. Between June and July of 2008, assessors evaluated 19 neighbor-hood characteristics (Supplemental Table 2) using stan-dardized protocols, which were adapted from the New York Social Environmental Study neighborhood assess-ment instruassess-ment [48] to be specific for Detroit. Frequen-cies of observed neighborhood characteristics were calculated as the percent of street segments within each evaluated census block group with that neighborhood characteristic.
DNA methylation assessment and calculation of epigenetic mortality risk score
Genome-wide DNA methylation was measured in whole blood (leukocytes)-derived DNA with the Illumina 450K DNA methylation array following previously published methods [45, 47, 49]. Briefly, peripheral blood DNA was obtained via venipuncture. Samples were bisulfite con-verted using the EZ-96 DNA methylation kit (Zymo Re-search). Bisulfite converted samples were profiled via the Illumina Infinium 450K DNA methylation array per manufacturer protocols. Sample quality control (QC) in-cluded the removal of samples with probe detection call
rates < 90% and those with an average intensity value < 50% of the experiment-wide sample median or < 2000 arbitrary units. The R package CpGassoc was used for QC procedures [50]. Additionally, probes with detection P values > 0.001 were removed, as were samples with missing data for > 10% of probes. Probes with known SNPs and cross-hybridizing probes [51] were also re-moved. Probe normalization was undertaken using the beta-mixture quantile normalization method [52] as im-plemented in the R package wateRmelon [53]. ComBat [54] was used to remove batch effects from assigned chip and assigned chip position for each sample. For use of ComBat, beta values were first converted toMvalues. Batch effects were then removed prior to converting M values back to beta values. These QC procedures match the standard procedures for the Detroit Neighborhood Health Study [55,56]. Of the 612 participants providing blood samples, 179 participants were tested on the Illu-mina 450K DNA methylation array, and of these, 157 passed all QC metrics and had available data on neigh-borhood characteristics.
We used a validated epigenetic mortality risk score (eMRS) [27] as a molecular indicator of mortality risk as determined by alterations to DNA methylation. The eMRS assessed the percent methylation at 10 CpGs and was developed on the Illumina Infinium 450K methyla-tion array. Both a continuous score, based on the regres-sion coefficients in the discovery sample, and a categorical score, based on the number of “aberrant” CpGs, were developed by Zhang et al. [27]. For this study, we used the continuous score, as 157 samples limit sample sizes across the categorical score for the analyses. All 10 CpGs for the eMRS were available and passed QC in all 157 DNHS participants available for this analysis. The distribution of the eMRS in the study population is given in Supplemental Figure1.
Analytic models
Our primary analysis was to evaluate if objective neighbor-hood characteristics were associated with the eMRS. Given the limited sample size and correlation among the 19 assessed neighborhood characteristics, we performed a principal component (PC) analysis to reduce the number of tests performed as well as to summarize co-varying neighborhood characteristics into components which might be better reflect relationships with the eMRS. We made the a priori decision to examine the first nine PCs (when ranked by percent variance explained) necessary to explain 90% of the variance in the data for analysis.
usage, years spent residing in the neighborhood, education (binary indicator for some college or more), and employ-ment (binary indicator for employed vs unemployed). The second model adjusted for all the terms in the first model but also included indicators of personal neighborhood perception. Binary indicators for whether the person liked their neighborhood (“Somewhat”or“A great deal”versus all other responses) and for whether someone agreed with the statement that their neighborhood was a close-knit or unified neighborhood (“Strongly Agree” or “Somewhat Agree” versus all other responses) were used to capture personal perceptions on the likeability and social cohe-sion/support of an individual’s neighborhood and were asked of each participant at their baseline visit.
Given previous observations that associations with epi-genetic biomarkers may vary based on sex [17, 57], we decided to evaluate sex-stratified associations for those PCs significant in the primary analysis. We also stratified analyses based on indicators of greenspace in neighbor-hoods, as greenspace may be a potentially protective
fac-tor for health outcomes [2, 32]. There were two
neighborhood characteristics evaluated by the assessors which indicated the presence of greenspace in a neigh-borhood, one on the presence of large mature trees and the other on the presence of community gardens in the neighborhood (HQ9 and HQ6, respectively, in Supple-mental Table2). For the presence of large mature trees, we stratified individuals based on the median value for HQ6 (84.2%), i.e., the median the percentage of block groups in a neighborhood with large mature trees. As most individuals (88/157) lived in a neighborhood with no observed community gardens, we stratified this vari-able on the presence of community gardens vs no ob-served presence. Histograms of the distribution of large mature trees and community gardens in the neighbor-hoods are given in Supplemental Figures 2 and 3. We also performed a sensitivity analysis adjusting primary associations, as well as those stratified on greenspace, for immune cell counts. Part of the association between the built neighborhood environment and the eMRS may be driven by blood immune cell counts as these would be indicators of inflammatory status, which is one mechan-ism that may link the built environment to mortality risk. We estimated blood immune cell counts using the established Houseman method [58] to estimate counts of CD4T cells, CD8T cells, natural killer cells, B cells, monocytes, and granulocytes [59].
Associations for the primary analysis were considered significant at theP< 0.006 level to adjust for the nine PCs examined. All analyses were done using R version 3.6 [60].
Supplementary information
Supplementary informationaccompanies this paper athttps://doi.org/10. 1186/s13148-020-00830-8.
Additional file 1.Supplemental Table 1. Loadings for each of the top nine principal components. Supplemental Table 2. Definitions of housing quality indicators. Supplemental Table 3. Associations between housing quality indicators and epigenetic mortality risk score. Supplemental Table 4. Associations between PC7 and CpGs which compose the eMRS stratified on neighborhood greenspace. Supplemental Table 5. Pearson correlation (r2) between DNA methylation-derived cell counts and the neighborhood quality principal components used in the analyses. Supple-mental Table 6. Associations between PC7 and the epigenetic mortality risk score after additional adjustment for cell counts. Supplemental Figure 1. Distribution of the epigenetic mortality risk score (eMRS) in Detroit Neighborhood Health Study participants. Supplemental Figure 2. Distribu-tion of the percentage of large mature trees observed in the neighbor-hoods for the study participants. Supplemental Figure 3. Histogram of the distribution of community gardens observed within the neighbor-hoods for the study participants.
Abbreviations
CpG:Cytosine-phosphate-guanine dinucleotide; DNHS: Detroit Neighborhood Health Study; eMRS: Epigenetic mortality risk score; PC: Principal component
Acknowledgements
We appreciate the time and effort of study participants, staff, and volunteers of the Detroit Neighborhood Health Study. This work does not necessarily represent the views of the US Environmental Protection Agency. Mention of trade names does not constitute endorsement.
Authors’contributions
CKW-C, CM, and AEA contributed to the study design. SG, MU, DEW, and KK contributed to the data collection. CKW-C and SP contributed to the data analysis. CKW-C, SP, CM, and AEA contributed to the data interpretation. CKW-C contributed to the writing of the manuscript. CKW-C, CM, SG, MU, DEW, KK, and AEA contributed to the critical revision. CKW-C, CM, and AEA were involved in the study supervision. CM and AEA obtained the funding. The author(s) read and approved the final manuscript.
Funding
Funding for this study was provided by the US Environmental Protection Agency. Coauthors recognize funding from the National Institutes of Health for the DNHS and related studies [R01DA022720 (AEA, SG, MU, DW), R01DA022720-S1 (AEA, SG, KK, MU), RC1MH088283 (AEA, SG, KK, MU, DW), R01 MD011728 (AEA, MU, KK, DW)]. Additional funding is recognized by AEA (P2C HD050924, T32 HD091058) and CM (K99MD012808, T32HD007186).
Availability of data and materials
Data for this study are available by contacting the corresponding author, but requests are subject to approval by the University of North Carolina Institutional Review Board per study protocols to protect the confidentiality of participants.
Ethics approval and consent to participate
This study was approved by the University of North Carolina Institutional Review Board (13-3999).
Author details
1Center for Public Health and Environmental Assessment, US Environmental
Protection Agency, 104 Mason Farm Rd, Chapel Hill, NC 27514, USA.
2
University of North Carolina–Chapel Hill, Chapel Hill, NC 27514, USA.
3Carolina Population Center, Univeristy of North Carolina-Chapel Hill, Chapel
Hill, NC 27514, USA.4Department of Epidemiology, Gillings School of Global
Public Health, Univerity of North Carolina-Chapel Hill, Chapel Hill, NC 27514, USA.5School of Public Health, Boston University, Boston, MA 02118, USA.
6Genomics Program, College of Public Health, University of South Florida,
Tampa, FL 33612, USA.7Department of Epidemiology, Harvard T.H. Chan
Received: 4 November 2019 Accepted: 17 February 2020
References
1. Landrigan PJ, Fuller R, Acosta NJ, Adeyi O, Arnold R, Baldé AB, Bertollini R, Bose-O'Reilly S, Boufford JI, Breysse PN. The Lancet Commission on pollution and health. Lancet. 2018;391:462–512.
2. Kardan O, Gozdyra P, Misic B, Moola F, Palmer LJ, Paus T, Berman MG. Neighborhood greenspace and health in a large urban center. Sci Rep. 2015;5:11610.
3. Renalds A, Smith TH, Hale PJ. A systematic review of built environment and health. Fam Commun Health. 2010;33:68–78.
4. Finch BK, Phuong Do D, Heron M, Bird C, Seeman T, Lurie N. Neighborhood effects on health: concentrated advantage and disadvantage. Health Place. 2010;16:1058–60.
5. Mair C, Diez Roux AV, Morenoff JD. Neighborhood stressors and social support as predictors of depressive symptoms in the Chicago Community Adult Health Study. Health Place. 2010;16:811–9.
6. Wight RG, Cummings JR, Miller-Martinez D, Karlamangla AS, Seeman TE, Aneshensel CS. A multilevel analysis of urban neighborhood socioeconomic disadvantage and health in late life. Soc Sci Med. 2008;66:862–72. 7. Gary TL, Safford MM, Gerzoff RB, Ettner SL, Karter AJ, Beckles GL, Brown AF.
Perception of neighborhood problems, health behaviors, and diabetes outcomes among adults with diabetes in managed care. The Translating Research Into Action for Diabetes (TRIAD) Study. Diabetes Care. 2008;31: 273–8.
8. Weden MM, Carpiano RM, Robert SA. Subjective and objective
neighborhood characteristics and adult health. Soc Sci Med. 2008;66:1256– 70.
9. Wen M, Hawkley LC, Cacioppo JT. Objective and perceived neighborhood environment, individual SES and psychosocial factors, and self-rated health: an analysis of older adults in Cook County, Illinois. Soc Sci Med. 2006;63: 2575–90.
10. Beckie TM. A systematic review of allostatic load, health, and health disparities. Biol Res Nurs. 2012;14:311–46.
11. Juster R-P, McEwen BS, Lupien SJ. Allostatic load biomarkers of chronic stress and impact on health and cognition. Neurosci Biobehav Rev. 2010;35: 2–16.
12. Theall KP, Drury SS, Shirtcliff EA. Cumulative neighborhood risk of psychosocial stress and allostatic load in adolescents. Am J Epidemiol. 2012; 176:S164–74.
13. Schulz AJ, Mentz G, Lachance L, Johnson J, Gaines C, Israel BA. Associations between socioeconomic status and allostatic load: effects of neighborhood poverty and tests of mediating pathways. Am J Public Health. 2012;102: 1706–14.
14. Broyles ST, Staiano AE, Drazba KT, Gupta AK, Sothern M, Katzmarzyk PT. Elevated C-reactive protein in children from risky neighborhoods: evidence for a stress pathway linking neighborhoods and inflammation in children. PLoS One. 2012;7:e45419.
15. Holmes LM, Marcelli EA. Neighborhoods and systemic inflammation: high CRP among legal and unauthorized Brazilian migrants. Health Place. 2012; 18:683–93.
16. Theall KP, Brett ZH, Shirtcliff EA, Dunn EC, Drury SS. Neighborhood disorder and telomeres: connecting children’s exposure to community level stress and cellular response. Soc Sci Med. 2013;85:50–8.
17. Dhingra R, Nwanaji-Enwerem JC, Samet M, Ward-Caviness CK. DNA methylation age—environmental influences, health impacts, and its role in environmental epidemiology. Curr Environ Health Rep. 2018;5:317–27. 18. Egorov AI, Griffin SM, Converse RR, Styles JN, Sams EA, Wilson A, Jackson LE,
Wade TJ. Vegetated land cover near residence is associated with reduced allostatic load and improved biomarkers of neuroendocrine, metabolic and immune functions. Environ Res. 2017;158:508–21.
19. Jaenisch R, Bird A. Epigenetic regulation of gene expression: how the genome integrates intrinsic and environmental signals. Nat Genet. 2003;33: 245.
20. Mendelson MM, Marioni RE, Joehanes R, Liu C, Hedman ÅK, Aslibekyan S, Demerath EW, Guan W, Zhi D, Yao C, et al. Association of body mass index with DNA methylation and gene expression in blood cells and relations to cardiometabolic disease: a Mendelian randomization approach. PLoS Med. 2017;14:e1002215.
21. Wahl S, Drong A, Lehne B, Loh M, Scott WR, Kunze S, Tsai P-C, Ried JS, Zhang W, Yang Y, et al. Epigenome-wide association study of body mass index, and the adverse outcomes of adiposity. Nature. 2016;541:81. 22. Nazarenko MS, Markov AV, Lebedev IN, Freidin MB, Sleptcov AA, Koroleva
IA, Frolov AV, Popov VA, Barbarash OL, Puzyrev VP. A comparison of genome-wide DNA methylation patterns between different vascular tissues from patients with coronary heart disease. PLoS One. 2015;10:e0122601. 23. Nakatochi M, Ichihara S, Yamamoto K, Naruse K, Yokota S, Asano H,
Matsubara T, Yokota M. Epigenome-wide association of myocardial infarction with DNA methylation sites at loci related to cardiovascular disease. Clin Epigenet. 2017;9:54.
24. Rask-Andersen M, Martinsson D, Ahsan M, Enroth S, Ek WE, Gyllensten U, Johansson Å. Epigenome-wide association study reveals differential DNA methylation in individuals with a history of myocardial infarction. Hum Mol Genet. 2016;25:4739–48.
25. Kulis M, Esteller M. 2 - DNA methylation and cancer. In: Herceg Z, Ushijima T, editors. Advances in Genetics. Volume 70: Academic Press; 2010. p. 27–56. 26. Baylin SB. DNA methylation and gene silencing in cancer. Nat Clin Pract
Oncol. 2005;2:S4.
27. Zhang Y, Wilson R, Heiss J, Breitling LP, Saum K-U, Schöttker B, Holleczek B, Waldenberger M, Peters A, Brenner H. DNA methylation signatures in peripheral blood strongly predict all-cause mortality. Nat Commun. 2017;8: 14617.
28. Chen BH, Marioni RE, Colicino E, Peters MJ, Ward-Caviness CK, Tsai P-C, Roetker NS, Just AC, Demerath EW, Guan W, et al. DNA methylation-based measures of biological age: meta-analysis predicting time to death. Aging. 2016;8:1844–65.
29. Horvath S, Raj K. DNA methylation-based biomarkers and the epigenetic clock theory of ageing. Nat Rev Genet. 2018;19:371–84.
30. McCartney DL, Hillary RF, Stevenson AJ, Ritchie SJ, Walker RM, Zhang Q, Morris SW, Bermingham ML, Campbell A, Murray AD, et al. Epigenetic prediction of complex traits and death. Genome Biol. 2018;19:136. 31. Gao X, Zhang Y, Mons U, Brenner H. Leukocyte telomere length and
epigenetic-based mortality risk score: associations with all-cause mortality among older adults. Epigenetics. 2018;13:846–57.
32. de Vries S, Verheij RA, Groenewegen PP, Spreeuwenberg P. Natural environments—healthy environments? An exploratory analysis of the relationship between greenspace and health. Environ Plann A Econ Space. 2003;35:1717–31.
33. Markevych I, Schoierer J, Hartig T, Chudnovsky A, Hystad P, Dzhambov AM, de Vries S, Triguero-Mas M, Brauer M, Nieuwenhuijsen MJ, et al. Exploring pathways linking greenspace to health: theoretical and methodological guidance. Environ Res. 2017;158:301–17.
34. Mitchell R, Popham F. Effect of exposure to natural environment on health inequalities: an observational population study. Lancet. 2008;372:1655–60. 35. Panni T, Mehta AJ, Schwartz JD, Baccarelli AA, Just AC, Wolf K, Wahl S, Cyrys J,
Kunze S, Strauch K. Genome-wide analysis of DNA methylation and fine particulate matter air pollution in three study populations: KORA F3, KORA F4, and the normative aging study. Environ Health Perspect. 2016;124:983–90. 36. de FC Lichtenfels AJ, Van Der Plaat DA, de Jong K, van Diemen CC, Postma
DS, Nedeljkovic I, van Duijn CM, Amin N, la Bastide-van Gemert S, De Vries M. Long-term air pollution exposure, genome-wide DNA methylation and lung function in the LifeLines cohort study. Environ Health Perspect. 2018; 126:027004.
37. Stringhini S, Polidoro S, Sacerdote C, Kelly RS, van Veldhoven K, Agnoli C, Grioni S, Tumino R, Giurdanella MC, Panico S, et al. Life-course socioeconomic status and DNA methylation of genes regulating inflammation. Int J Epidemiol. 2015;44:1320–30.
38. Tehranifar P, Wu H-C, Fan X, Flom JD, Ferris JS, Cho YH, Gonzalez K, Santella RM, Terry MB. Early life socioeconomic factors and genomic DNA methylation in mid-life. Epigenetics. 2013;8:23–7.
39. Borghol N, Suderman M, McArdle W, Racine A, Hallett M, Pembrey M, Hertzman C, Power C, Szyf M. Associations with early-life socio-economic position in adult DNA methylation. Int J Epidemiol. 2011;41:62–74. 40. Hughes A, Smart M, Gorrie-Stone T, Hannon E, Mill J, Bao Y, Burrage J,
Schalkwyk L, Kumari M. Socioeconomic position and DNA methylation age acceleration across the life course. Am J Epidemiol. 2018;187:2346–54. 41. Smith JA, Zhao W, Wang X, Ratliff SM, Mukherjee B, Kardia SLR, Liu Y, Roux
42. Kruger DJ, Reischl TM, Gee GC. Neighborhood social conditions mediate the association between physical deterioration and mental health. Am J Commun Psychol. 2007;40:261–71.
43. Roux AVD, Mair C. Neighborhoods and health. Ann N Y Acad Sci. 2010;1186: 125–45.
44. Cutrona CE, Wallace G, Wesner KA. Neighborhood characteristics and depression: an examination of stress processes. Curr Dir Psychol Sci. 2006;15: 188–92.
45. Koenen KC, Uddin M, Chang S-C, Aiello AE, Wildman DE, Goldmann E, Galea S. SLC6A4 methylation modifies the effect of the number of traumatic events on risk for posttraumatic stress disorder. Depress Anxiety. 2011;28: 639–47.
46. Goldmann E, Aiello A, Uddin M, Delva J, Koenen K, Gant LM, Galea S. Pervasive exposure to violence and posttraumatic stress disorder in a predominantly African American Urban Community: the Detroit neighborhood health study. J Trauma Stress. 2011;24:747–51. 47. Uddin M, Aiello AE, Wildman DE, Koenen KC, Pawelec G, de Los SR,
Goldmann E, Galea S. Epigenetic and immune function profiles associated with posttraumatic stress disorder. Proc Natl Acad Sci U S A. 2010;107:9470– 5.
48. Lê F, Ahern J, Galea S. Neighborhood education inequality and drinking behavior. Drug Alcohol Depend. 2010;112:18–26.
49. Bustamante AC, Aiello AE, Galea S, Ratanatharathorn A, Noronha C, Wildman DE, Uddin M. Glucocorticoid receptor DNA methylation, childhood maltreatment and major depression. J Affect Disord. 2016;206:181–8. 50. Barfield RT, Kilaru V, Smith AK, Conneely KN. CpGassoc: an R function for
analysis of DNA methylation microarray data. Bioinformatics. 2012;28:1280– 1.
51. Chen YA, Lemire M, Choufani S, Butcher DT, Grafodatskaya D, Zanke BW, Gallinger S, Hudson TJ, Weksberg R. Discovery of cross-reactive probes and polymorphic CpGs in the Illumina Infinium HumanMethylation450 microarray. Epigenetics. 2013;8:203–9.
52. Teschendorff AE, Marabita F, Lechner M, Bartlett T, Tegner J, Gomez-Cabrero D, Beck S. A beta-mixture quantile normalization method for correcting probe design bias in Illumina Infinium 450 k DNA methylation data. Bioinformatics. 2013;29:189–96.
53. Pidsley R, Wong CCY, Volta M, Lunnon K, Mill J, Schalkwyk LC. A data-driven approach to preprocessing Illumina 450K methylation array data. BMC Genomics. 2013;14:293.
54. Leek JT, Johnson WE, Parker HS, Jaffe AE, Storey JD. The sva package for removing batch effects and other unwanted variation in high-throughput experiments. Bioinformatics. 2012;28:882–3.
55. Uddin M, Ratanatharathorn A, Armstrong D, Kuan PF, Aiello AE, Bromet EJ, Galea S, Koenen KC, Luft B, Ressler KJ, et al. Epigenetic meta-analysis across three civilian cohorts identifies NRG1 and HGS as blood-based biomarkers for post-traumatic stress disorder. Epigenomics. 2018;10:1585–601. 56. Ratanatharathorn A, Boks MP, Maihofer AX, Aiello AE, Amstadter AB,
Ashley-Koch AE, Baker DG, Beckham JC, Bromet E, Dennis M, et al. Epigenome-wide association of PTSD from heterogeneous cohorts with a common multi-site analysis pipeline. Am J Med Genet B Neuropsychiatr Genet. 2017;174:619– 30.
57. Ward-Caviness CK, Nwanaji-Enwerem JC, Wolf K, Wahl S, Colicino E, Trevisi L, Kloog I, Just AC, Vokonas P, Cyrys J, et al. Long-term exposure to air pollution is associated with biological aging. Oncotarget. 2016;7:74510–25. 58. Houseman EA, Accomando WP, Koestler DC, Christensen BC, Marsit CJ,
Nelson HH, Wiencke JK, Kelsey KT. DNA methylation arrays as surrogate measures of cell mixture distribution. BMC Bioinformatics. 2012;13:86. 59. Reinius LE, Acevedo N, Joerink M, Pershagen G, Dahlén S-E, Greco D,
Söderhäll C, Scheynius A, Kere J. Differential DNA methylation in purified human blood cells: implications for cell lineage and studies on disease susceptibility. PLoS One. 2012;7:e41361.
60. R Core Development Team. R: a language and environment for statistical computing. vol. 3.6. Vienna: R Foundation for Statistical Computing; 2019.
Publisher’s Note
![Fig. 1 Association between principal components for neighborhood quality and eMRS. Each of the principal components (PCs) for neighborhood quality was associated with the epigenetic mortality risk score (eMRS [27]) in a model adjusted for age sex, race (Wh](https://thumb-us.123doks.com/thumbv2/123dok_us/8218530.2178984/4.892.88.807.132.485/association-principal-components-neighborhood-components-neighborhood-associated-epigenetic.webp)