side effect of severe diarrhea in patients. The dose-limiting side effects of CPT-11 arise when the metabolite SN-38G is reactivated in the intestines by β-glucuronidases (GUS) from bacteria. Previous work found selective inhibitors that bind to a loop region near the active site in different species and are effective in alleviating CPT-11 induced diarrhea in mice. The GUS from
Bacteroides dorei does not have this loop. We sought to kinetically characterize the processing of SN-38G by this GUS and compare it with other GUS enzymes from common bacteria. We found that GUS from B. dorei was less effective than enzymes from other bacteria, however it did process SN-38G with a Km of 21±2 μM and a kcat of 5.9±0.2 s-1. Therefore, new inhibitors may need to be designed that do not require an active site loop for have maximal chemotherapeutic effectiveness against CPT-11 induced diarrhea. We also attempted to characterize the response and growth of Escherichia coli in the glucuronidated forms of Diclofenac and estriol. From this, we determined that higher than 25 μM and 100 nM of substrate, respectively are necessary to maintain growth.
Introduction
One bacterial enzyme, β-glucuronidase (GUS), produced by numerous species of gut
bacteria, has been shown to reactivate a common chemotherapeutic for colorectal cancer, irinotecan (CPT-11), while in the intestinal lumen. CPT-11 is hydrolyzed by a carboxylesterase enzyme to form the active metabolite SN-38. It then “poisons the catalytic cycle of human topoisomerase I, which manages the super-helical tension associated with DNA metabolism and
is preferentially active in rapidly dividing cells.”3,4 After completing
its function, SN-38 is deactivated by UDP-glucuronosyl- transferases, which add a glucuronide sugar to SN-38, transforming it into the inactive form SN-38G.2 It is then
sent to the GI tract to be excreted. However, once it enters the intestinal lumen, this glucuronide moiety is cleaved off by β-glucuronidase enzymes (GUS) produced by bacterial species within the GI microbiota. The reactivated SN-38 attacks and kills the gut epithelial cells. This results in the dose-limiting side effect of severe diarrhea, noted in phase I clinical trials of the drug, and the FDA package insert for irinotecan which indicate that “up to 88% of patients experience diarrhea and 31% show grade 3–4 diarrhea” which limit efficacy of this drug.5,2 Finding ways to
inactivate GUS is key to prevent these harmful side effects, allowing physicians to increase dosage and thereby increase efficacy of this drug.
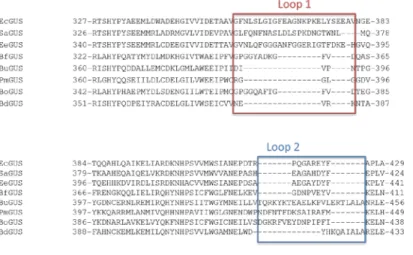
Because of the vital functions that the GI microbiota play in maintaining health, killing bacteria within the GI tract is not an acceptable solution to reducing the amount of GUS enzyme. Inhibiting the activity of this enzyme is another option—this will selectively eliminate the GUS enzyme from reactivating SN-38, while still allowing the microbiota to survive. Through structural and chemical biology, several potent inhibitors of GUS have been identified in a high-throughput screen6. These inhibitors bind at “bacterial loops” at the active site of the enzyme. However, the architecture of the active site varies among different enzymes in the GUSome, resulting in different loop lengths and shapes. From the Human Microbiome Project Database, fecal samples from 139 individuals were obtained resulting in 3013 unique GUS sequences. It was found that GUS enzymes fall in to 6 general categories: Loop 1, Loop 2, Loop 1, Mini-Loop 2, Mini-Mini-Loop 1 and 2 and No Mini-Loop7. Of special interest are the No Loop GUS enzymes. These are the most common category of GUS, making up an average of 49% of all GUS
enzymes in the microbiome7. Because all inhibitors thus far work by binding to a loop motif, the rate at which the No Loop GUS enzymes cleave β-glucuronides is critical to determining
inhibitor efficacy in patients. Bacteroides dorei is a representative No Loop GUS producing species, with known crystal structures7 and is a good model for kinetic characterization of No Loop GUS enzymes.
anti-inflammatory drugs (NSAIDs) are another source of glucuronidated compounds in the intestinal lumen. While usually safe, long-term usage can lead to several adverse GI effects, including bleeding, protein loss and strictures8. In mouse studies, acyl glucuronides and phenol glucuronides of diclofenac (DCF) were found in the mouse intestines following a single dose9. Similar to glucuronidated chemotherapeutics, the bacterial β-glucuronidases reactivated the NSAID in the lumen, causing gut epithelial cells to be exposed to high concentrations of active NSAID, leading to cell death8. Inhibitors of GUS have been shown to protect mice from NSAID
driven enteropathy, by preventing cleavage of the glucuronidated NSAIDS8. Understanding how relative bacterial abundances change in response to introduction of new glucuronidated
compounds can help direct targeted therapy and use of inhibitors for maximal efficiency and protect from adverse side effects among a range of different drugs.
Methods
I. Expression and Purification of Enzymes
The full-length B. dorei β-glucuronidase (BdGUS) gene was purchased from Bio Basic in the pUC57 vector. The mature gene lacking the signal peptide was amplified and inserted into the pLIC-His vector. Purified protein was obtained by members of the Redinbo Lab.
II. PNPG Assay
buffer (50 mM HEPES, 50 mM NaCl, various pH), 10 μL enzyme, and 30 μL of
substrate diluted in assay buffer. All enzymes were derived from homogenous purified bacterial cell extracts. For kinetic assays, each protein was examined at its optimal pH using assay buffer and 800 μM PNPG diluted in the appropriate assay buffer. For assays at pH 6.5 to 7.4, initial 50 μL, product formation was measured over time via absorbance
at 410 nm with a PHERAstar Plus microplate reader (BMG Labtech, Ortenberg, Germany).
III. SN-38G Assay
Reactions were conducted in triplicate in 96-well, black, clear-bottom assay plates (Costar, Tewksbury MA) at 37 °C. The reactions consisted of 10 μL assay
buffer (50 mM HEPES, 50 mM NaCl, various pH), 10 μL enzyme, and 30 μL of SN-38G diluted in assay
buffer. Processing of SN-38G was measured over time using a final concentration of 5nM enzyme and 1-50μM SN-38G. Formation of SN-38 was
measured by excitation and emission wavelengths of 375 and 415 nm, respectively with a PHERAstar Plus microplate reader (BMG Labtech, Ortenberg, Germany).
IV. Glucuronic Acid Growth Curves
Escherichia coli strain DH5α cultures (10 mL) were grown overnight in Luria broth in a 37° shaker. 5 mL of culture was aliquoted and 50 μL of 100mM PNPG was added10. This was the “pulsed” group. An equivalent amount of water was added to 5 mL of “control” culture. The culture was placed back in the shaker. After 1 hour had elapsed, the culture was spun down and
resuspended in M9 minimal media without any carbon source and adjusted to an OD600 of 0.01.
For these growth curves, D-Glucuronic acid sodium salt monohydrate (Sigma-Aldrich) was used. 1μL of 1000x stock glucuronic acid in water was added the cell suspension in order to obtain the
desired final concentration. The culture was plated in a 96 well, black, clear bottom, assay plate (Costar, Tewksbury MA) and the absorbance at 600nM was measured with a plate reader (Tecan) every 60-120 min.
V. RNA extraction and qPCR
RNA was extracted from 1 mL aliquots of the pulsed and control groups using the Trizol® Max™ Bacterial RNA Isolation Kit protocol. cDNA was synthesized from RNA by following the SuperScript™ Reverse Transcriptase (Invitrogen) protocol. qPCR was carried out using SYBR green as the indicator dye in a 30 μL reaction volume.
VI. Glucuronide Growth Curves
Escherichia coli strain DH5α cultures were grown overnight in Luria broth in a 37° shaker. 5mL of culture was aliquoted and 50μL of 100mM PNPG was added. The culture was placed back in
the shaker. After 1 hour had elapsed, the culture was spun down and resuspended in M9 minimal media without any carbon source and adjusted to an OD600 of 0.1. To this, 1μL of 1000x stock
glucuronide (E3G or DCF-G) in water was added, in order to obtain the desired final
concentration. Bacteria were suspended in M9 minimal media without carbon, M9 with 100μM
Results
PNPG Processing Kinetics of B. dorei
The PNPG assay was run several times until consistent values of Vmax and Km were obtained.
10nM of purified GUS extract and a range of 50-700μM PNPG was used. SigmaPlot 13.0 was used for statistical analysis.
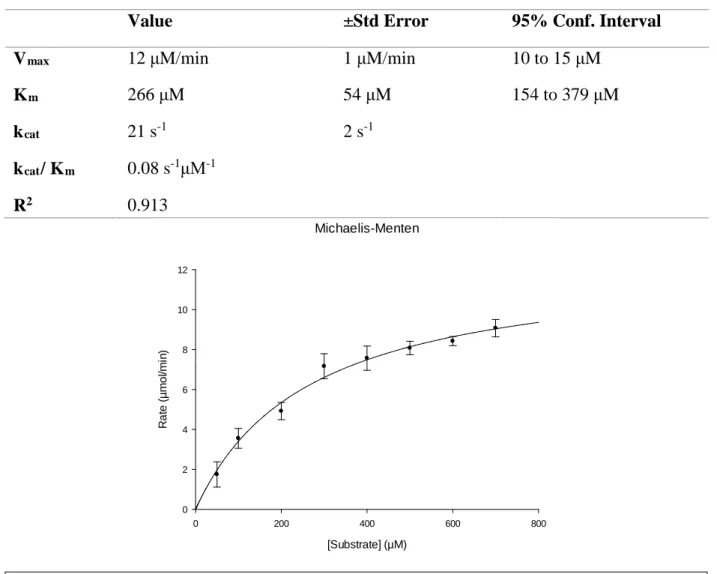
Table 1. Table of the kinetic characteristics of B. dorei GUS when processing PNPG
Value ±Std Error 95% Conf. Interval
Vmax 12 μM/min 1 μM/min 10 to 15 μM
Km 266 μM 54 μM 154 to 379 μM
kcat 21 s-1 2 s-1
kcat/ Km 0.08 s-1μM-1
R2 0.913
Michaelis-Menten
[Substrate] (µM)
0 200 400 600 800
R
at
e (
µ
m
ol
/m
in
)
0 2 4 6 8 10 12
Figure 3. Michaelis-Menten curve illustrating Vmax and Km of B. dorei GUS when processing
SN-38G Processing Kinetics of B. dorei
The SN-38G assay was run several times until consistent values of Vmax and Km were obtained.
5nM of B. dorei GUS was used over a range of 1-50μM SN-38G. SigmaPlot 13.0 was used for statistical analysis.
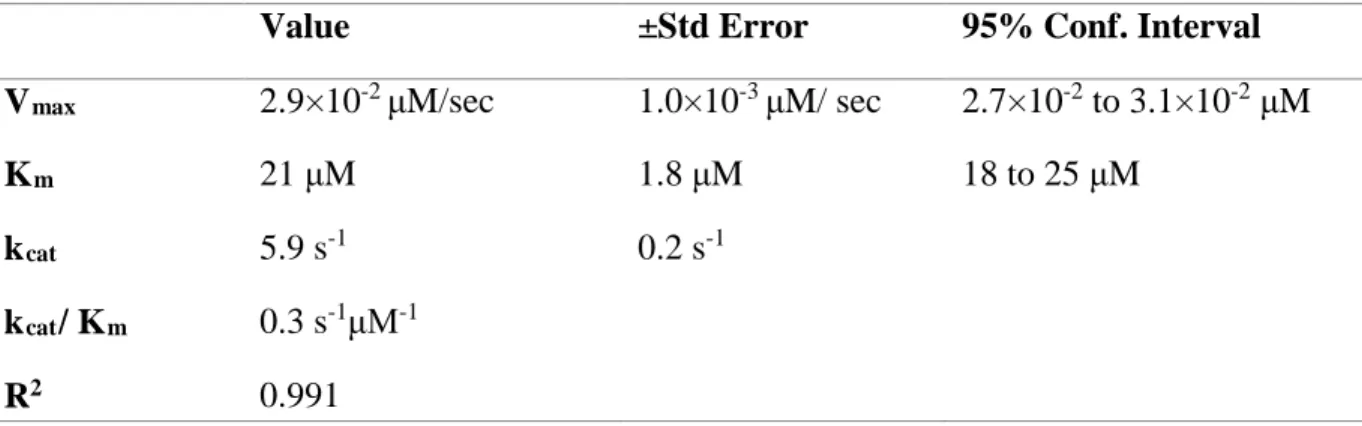
Table 2. Table of the kinetic characteristics of B. dorei GUS when processing SN-38G
Value ±Std Error 95% Conf. Interval
Vmax 2.9×10⁻² μM/sec 1.0×10⁻³ μM/ sec 2.7×10⁻² to 3.1×10⁻²μM
Km 21 μM 1.8 μM 18 to 25 μM
kcat 5.9 s-1 0.2 s-1
kcat/ Km 0.3 s-1μM-1
R2 0.991
Michaelis-Menten
[Substrate] (µM)
0 10 20 30 40 50 60
R
at
e
(µ
m
ol
/s
ec
)
0.000 0.005 0.010 0.015 0.020 0.025
Figure 4. Michaelis-Menten curve illustrating Vmax and Km of B. dorei GUS when processing
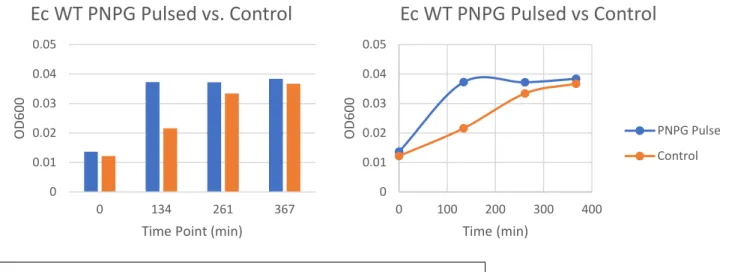
E. coli Growth in Glucuronic Acid when Pulsed vs. Control and GUS Expression Changes
Table 3. Table of Ct values and expression fold change between pulsed and control in E. coli1
dCT ddCT Expression fold change
Pulsed Control -2.3 5.1
10.8 13.2
1. Target gene: EcGUS, Housekeeping gene: 16S rRNA
0 0.01 0.02 0.03 0.04 0.05
0 134 261 367
O
D600
Time Point (min)
Ec WT PNPG Pulsed vs. Control
0.0000 1.0000 2.0000 3.0000 4.0000 5.0000 6.0000 Pulsed Control
Expression Fold Change (PNPG Pulse)
0 0.01 0.02 0.03 0.04 0.050 100 200 300 400
O
D600
Time (min)
Ec WT PNPG Pulsed vs Control
PNPG Pulse Control
Figure 6. Pulsing with PNPG causes GUS to be 5x more expressed in E. coli than non-pulsed control cells.
Estriol Glucuronide (E3G) Growth Curve
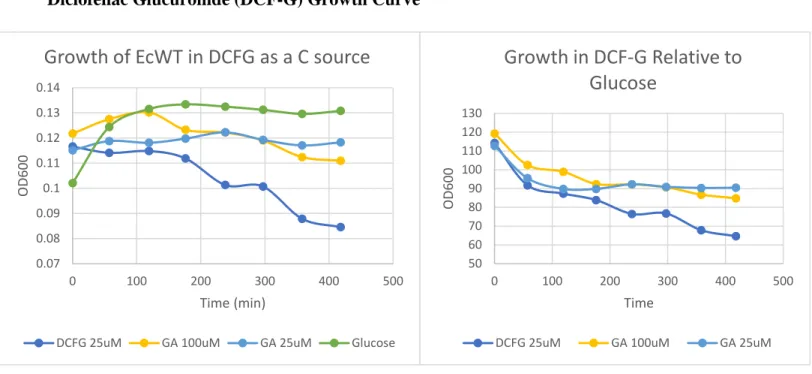
Diclofenac Glucuronide (DCF-G) Growth Curve
0.09 0.1 0.11 0.12 0.13 0.14 0.15
0 100 200 300 400 500
O
D600
Time (min)
Growth of EcWT In E3G As a Carbon
Source
100nM E3G 10nM E3G 100uM GA
100nM GA Glucose 0.2
60 70 80 90 100 110 120
0 100 200 300 400 500
O
D600
Time (min)
Growth of Ec in E3G relative to
Glucose
100nM E3G 10nM E3G 100uM GA 100nM GA
Figure 8. (A) Growth of E. coli WT with DCF-G as the carbon source. (B) Growth in DCF-G relative to growth in glucose.
Figure 7. (A) E3G was added to M9 as the primary source of carbon and growth curves were obtained. Controls are 100 μM GA, 100 nM GA and glucose (0.2%). (B) Representation of the data in (A) as a percent of the glucose group.
0.07 0.08 0.09 0.1 0.11 0.12 0.13 0.14
0 100 200 300 400 500
O
D600
Time (min)
Growth of EcWT in DCFG as a C source
DCFG 25uM GA 100uM GA 25uM Glucose
50 60 70 80 90 100 110 120 130
0 100 200 300 400 500
O
D600
Time
Growth in DCF-G Relative to
Glucose
Discussion
Part 1. Kinetic Characterization of Bacteroides dorei
Bacteroides dorei is a representative member of the no loop (NL) category of GUS enzymes in the human microbiota. This category makes up on average 49% of the GUS enzymes in an individual7. While the GUS kinetics have been studied and characterized for representative Loop 1 (L1), Loop 2 (L2) and Mini Loop 1 (mL1) species, not much is known about the
characteristics of NL GUS enzymes. Because inhibitors bind to this loop region, understanding the kinetic characteristics of this large group of structurally different GUS is critical to
determining the efficacy of inhibitors and chemotherapeutic treatment. Values that characterize the
kinetics of an enzyme include Vmax, the maximum rate at which
an enzyme can process its substrate, KM, a measure of the
affinity of an enzyme for its substrate, obtained by determining the substrate concentration at half of Vmax, kcat a first-order rate
constant for the enzyme that
indicates how quickly the enzyme is turning over the substrate, and kcat/KM, a measure of
catalytic efficiency. These values can be inexpensively measured through the PNPG assay for GUS. For B. dorei at 10 nM, the Vmax was 12.48 μM/s (Table 1). From this, kcat can be derived,
and it was found to be 21 ±2 s-1 which is much lower compared to the kcat of E. coli GUS (L1) of
Figure 9. Sequence alignment of GUS from several different species. L1 species E. coli, S. agalactiens and E.eligens. B. fragilis is a representative of mL1. B. uniformis is a
120±12 s-1, determined by members of the Redinbo Lab. However, this is higher than B. fragilis (mL1) which has a kcat of 18±1 s-1 and B. uniformis, which has a kcat of 4.5 s-1 (Redinbo Lab).
Therefore, while it doesn’t have the highest rate of turnover, it is faster than some enzymes at turning over the substrate. Despite this increased rate, B. dorei has a low affinity for PNPG as a substrate. When run at 10 nM, the KM was determined to be 266 μM. The low affinity for B.
dorei for the substrate may be attributed to the lack of a loop motif around the active site. A possible function of the loop is that it could obstruct the substrate from leaving the active site, resulting in tighter binding. However, kinetic studies of B. dorei illustrate that this loop is not necessary to process PNPG.
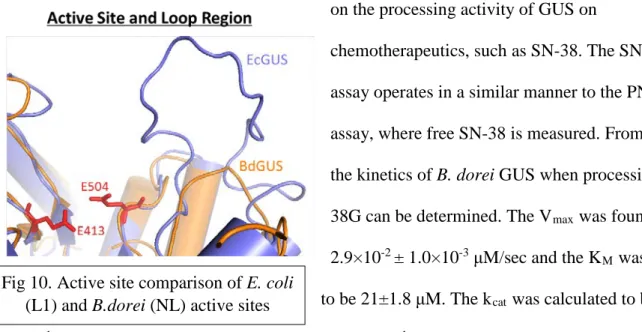
While the PNPG assay gives a good estimate for the activity of GUS enzymes, testing needs to be done on actual chemotherapeutic compounds in order to obtain real-life information
on the processing activity of GUS on
chemotherapeutics, such as SN-38. The SN-38G assay operates in a similar manner to the PNPG assay, where free SN-38 is measured. From this, the kinetics of B. dorei GUS when processing SN-38G can be determined. The Vmax was found to be
2.9×10⁻² ± 1.0×10⁻³μM/sec and the KM was found
to be 21±1.8 μM. The kcat was calculated to be 5.9
± 0.2 s-1 and the catalytic efficiency (kcat/ KM) was 0.3 s-1. The Vmax and kcat are both lower then
processing SN-38G than when B. dorei GUS processes PNPG, however the KM is also lower,
meaning that B. dorei binds SN-38G better than it does PNPG. As a result, the catalytic efficiency is 0.28 μM s-1 when cleaving SN-38G, which is much higher than a catalytic
efficiency of 0.078 μM s-1 when cleaving PNPG. A summary of this data is available in Table 2 and in Figure 4. In comparison to other representative enzymes, B. dorei processes SN-38G less effectively, however it still does to some extent. (Figure 11). Therefore, inhibitors that require a loop to bind GUS may not work because this GUS lacks a loop at the active site (Figure 10). Because the NL class of GUS is the most prevalent7, inhibitors that work against these enzymes are critical. In the future, experiments that test the effectiveness of inhibitors on annulling B. dorei GUS activity, and if needed, development of new inhibitors could greatly increase chemotherapeutic efficacy.
Part 2. Response and Growth of E. coli to introduction of different two different compounds.
When bacteria cleave glucuronide sugars off of different compounds, they can use it as an alternative carbon source to glucose or sucrose in the intestinal tract10. As an individual
undergoes chemotherapy, they get large doses of drugs at a time. Drugs and other compounds can modulate the composition of the microbiota over time, which can cause unwanted pathogens to invade the GI tract leading to side effects and unwanted symptoms.11 A key component to understanding how and why the composition of the microbiota changes is to understand how bacteria respond to different glucuronidated compounds and how their growth changes.
To mimic the introduction of drugs to the gut, cultures of E. coli were pulsed with PNPG for one hour, and their growth on glucuronic acid (GA) as a carbon source was monitored (Figure 5A/B). The GUS operon is not constitutively expressed; rather it needs to be induced.10 Incubating bacteria with a high concentration of glucuronidated compound can induce the GUS operon, causing cells to make a higher level of GUS protein10. It was found that E. coli pulsed
lag phase of the pulsed cells is much shorter, and they enter the log phase more quickly. Pulsing these cells likely induced the GUS operon to produce GUS enzyme. Through qPCR, it was determined that the GUS expression levels increased by five-fold in the pulsed group (Figure 6). This could indicate that GUS is more highly produced by intestinal bacteria after an individual has undergone a round of chemotherapy.
The growth of bacteria on two different glucuronidated compounds: Estriol-G (E3G) and Diclofenac-G (DCF-G) was studied. Estriol is one of three main estrogen compounds produced in the body. It almost exclusively produced during pregnancy, and the glucuronidated form is excreted. The growth of E. coli on 10nM and 100nM concentrations of E3G as a carbon source was tested. It was found that these concentrations were not sufficient to support growth, as neither exhibited a true growth curve, and the OD readings continually decreased (Figure 7). However, there is a slight uptick in growth in the 100nM E3G group at 197 min. That could indicate the bacteria were beginning the log phase of growth, but could not fully enter the log phase due to insufficient carbon. The growth of E. coli on higher concentrations of E3G is a future experiment that could give insight into the growth of E. coli on this substrate.
In the growth curves with DCF-G as the carbon source, the trend was generally the same as the E3G group (Figure 8). The DCF-G group did not grow, and after 176 minutes, the OD readings began to decrease, indicating cell death. Despite having a higher concentration of substrate (25 μM), the bacteria still did not grow. However, in comparison to the E3G group,
bacteria grow in these conditions, and understanding the factors underlying fluctuations in the composition of the gut flora in patients undergoing chemotherapy.
Conclusions
In this study, the kinetic characteristics of β-glucuronidase from the bacterial species B. dorei when processing two substrates: PNPG and SN-38G were determined. B.dorei GUS is representative of the No Loop category of GUS enzymes, which are on average, the most abundant category of GUS in the human microbiota. Because existing inhibitors require the use of a loop motif near the active site, these kinetic parameters are important to understand in order to predict efficacy of inhibitors in humans. B. dorei GUS was overall less efficient than
References
1. Gagnière, J. et al. Gut microbiota imbalance and colorectal cancer. World Journal of Gastroenterology, 2016, 22:2, 501-518.
2. Wallace, B.D et al. Structure and Inhibition of Microbiome β-Glucuronidases Essential to the Alleviation of Cancer Drug Toxicity. Chemistry & Biology 2015, 22, 1238–1249.
3. B. D. Wallace et al., Science 2010 330, 831.
4. I. Husain, J. L. Mohler, H. F. Seigler, J. M. Besterman, Cancer Res. 54, 539 (1994).
5. Gupta, E. et al. Metabolic Fate of Irinotecan in Humans: Correlation of Glucuronidation with Diarrhea. Cancer Research, 1994, 2, 3723-3725.
6. Wallace, B.D. et al. Alleviating Cancer Drug Toxicity by Inhibiting a Bacterial Enzyme. Science 2010, 330, 831-835.
7. Pollet, R.M. et al. An Atlas of β-glucuronidases in the Human Intestinal Microbiome. Structure. In press.
8. Saitta, K.S. et al. Bacterial β-glucuronidase inhibition protects mice against enteropathy induced by indomethacin, ketoprofen or diclofenac: mode of action and pharmacokinetics. Xenobiotica, 2014. 44:1 28-35.
9. Sarda S, Page C, Pickup K, et al. Diclofenac metabolism in the mouse: novel in vivo metabolites identified by high performance liquid chromatography coupled to linear ion trap mass spectrometry. Xenobiotica 2012 42:179–94.