VOLUME 17 ISSUE 1 (2019), Page 10 – 22
THE DYNAMIC OF VOLATILITY OF PAN-ASIAN PROPERTY PORTFOLIO MARKETS
Muhammad Najib Razali1, Muhammad Yusaimi Hamid2 & Mohd. Muzzammil Zekri3
1,2,3Faculty of Built Environment and Surveying
UNIVERSITI TEKNOLOGI MALAYSIA
Abstract
The securitised market in Asia has become more progressive recently, especially with the introduction of Real Estate Investment Trusts (REITs). The financial crisis such Global Financial Crisis has put the Asian property market into a convenient means to invest because of their sustained economy from that crisis. Nevertheless, the Asian property market has become more complex to understand, especially for institutional investors. As such, it is important to understand the market volatility especially the Asian property market. An understanding of volatility level especially in regional market is important to determine the cost of capital as well as to detect leverage decision and investment. Significant changes in volatility will have a significant impact to property portfolio market at the regional level. With the emergence of regional and global investors in property, it is important to answer the question on the situation of Asian property portfolio markets’ volatility. Moreover, economy of each of Pan-Asian countries will also be assessed to show the significance of their economy development and provide information for investor’s investment strategies from the volatility level point of view. This paper will assess the volatility level of pan-Asian property portfolio market over the period January 2000 to December 2015 by using EGARCH model.
INTRODUCTION
The international investment market has opened a wider choice for fund managers and property investors. Consequently, the Asian region offers many opportunities for investment on a range of different measures. Being amongst the fastest growing economies, Asia has several national markets that have reached majority in terms of market complexity transparency and competitiveness (Nguyen 2011). According to research report by CBRE (2015), China and Singapore are two major countries as sources of capital at global investment, proving that Asian region as a major destination in terms of investment.
Most of the public listed real estate companies in Asia are involved in several aspects of the property business, mainly in property development and property investment. For property development companies, the companies should have sufficient ongoing property development projects to be able to sustain reasonable earnings for at least five years after listing (Razali, Mei, Zainuddin, & Yunus, 2016). The emergence of Asian countries as economic power has been forecasted since the 1980s, which positively impacted the property sector. The number of public listed property companies has increased significantly and played a key role in the economic growth of the nation.
The dynamic of Asian region particularly in property investment has caught investors’ attention to investigate in terms of dynamic of performance and volatility. The uncertain condition of capital market has also given some significant impact to the performance of real estate companies in this region. The performance of Asian real estate companies has decreased slightly, beginning from year 2015. The FTSE EPRA/NAREIT Developed Asia Index 2015 decreased 1.8% during December 2015. The Hong Kong Index was down 1.3%, in comparison to a loss of 1.7% in Japan. The Australia Index increased by 3.8% while Singapore was up by 2.7%. At the end of December 2015, the FTSE EPRA/NAREIT Developed Asia Index counted a total of 76 constituents, representing a free float market capitalisation of over EUR 311 billion (EPRA 2015). However, Emerging Asia Pacific, such as China and The Philippines, gained 2.8% in the FTSE EPRA/NAREIT Emerging Index (EPRA 2015). Therefore, it shows that the Asian property portfolio market performance has shown some dynamic changes which depends on the country’s performance in property portfolios’ market.
Listed property companies have become an increasingly important investment vehicle in Asia and internationally (Steinert & Crowe 2001). Countries such as Malaysia, Korea, Hong Kong, Singapore and Japan also introduced REITs; creating higher volatility compared to other mature markets. Asian continues to play a major role in global investment particularly on source of capital.
grow much faster than other parts of the world. As of 2011, the region contained a total of USD 7 trillion of institutional-grade commercial properties as compared to USD 9 trillion in Europe and USD 8 trillion in the US. However, the property market in Asia is projected to grow rapidly to USD 19 trillion by 2021 and USD 45 trillion by 2031, overtaking Europe and North America to become the largest property market in the world. By 2021, it is expected to make up almost 40% of the global property market, increasing from the current level of 27% in 2011. According to Fiorilla et al. (2012), half of the world’s investable property is expected to be located in the Asia Pacific region by 2031.
The rapid growth of investment in Asian region has given positive impact to property portfolio growth. During the Asian financial crisis (AFC), almost all Asian countries were severely impacted. Most of the countries underwent economic reformation arranged by the International Monetary Fund (IMF). Later during the global financial crisis (GFC), most Asian countries launched incentive package plans which significantly contributed to the recovery process. Some Asian countries were impacted mainly through the following collapse in international trade or rapid financial spill overs. As a result, many Asian economies with direct exposure to US assets, such as Singapore and South Korea, showed increased financial stress and output losses. The magnitude of the impact has been deferred greatly among countries (Claessens, Dell’Ariccia, Igan, & Laeven, 2010).
Despite the negative impact of the European debt crisis and the GFC, the Asian region remains in good and solid growth with low unemployment rates. Generally, on average the GDP were significantly higher than the rest of the world. According to IMF (2015), the outlook for Asian markets (both emerging and developing economies), and the US economy regained some momentum, with a fading drag from inventories and recovery in investments. The international investment market has opened a wider choice for fund managers and property investors. Consequently, the Asian region offers many opportunities for investment on a range of different measures. Foreign investment in this region has seen significant increases Post-GFC. The emergence of property portfolio market in Asia at the global level has changed the investment condition in this region. The market has become more integrate and volatile to each other.
integration can be seen from the available information from the dominant markets in order to predict movements of local markets. Furthermore, market integration also helps real estate exposure, which can benefit to maximise investment profits. Consequently, the integration of the market has also created uncertainties among the markets, which led to volatility and spill overs.
A growing number of previous researches in recent years have investigated aspects regarding interdependence and contagion of listed property companies, especially after the AFC as well as the GFC. For instance, Kim, Oh and Jeong (2005) assessed the increase in capital mobility among Asian countries, while Ghysels and Seon (2005) examined the contagion effect of the Asian stock market during and after the AFC. Caporale, Cipollini and Demetriades (2005) also examined similar subject matter. Meanwhile, Nguyen (2011) measured the volatility spill over of Asian listed property companies by segregating between developed and emerging markets. Nevertheless, how far the volatility level will effect in term of spill overs among pan-Asian countries’ listed property companies was not discussed. Therefore, this study investigates the level of volatility within the Asian real estate market over the period from 2000 to 2015. As the market has become more integrated it is therefore important to assess the spill over effect among pan-Asian countries.
RESEARCH BACKGROUND
Real estate is gaining increasing institutional acceptance as an essential asset class due to the globalisation of real estate equity and debt investment instruments being available for other international investors in international financial markets (Liow, 2010). Furthermore, real estate also acts as capital assets that contribute to investment diversification and wealth creation. According to the modern portfolio theory, domestic and international portfolio risk can be reduced by investing in real estate due to the correlation of real estate with other investment assets is relatively low. Eichholtz, Huisman, Koedijk and Schuin (1998) found that real estate segmentation occurs between continents but integration within continents. Therefore, this will contribute to international diversification in real estate.
European public real estate markets also show high co-integration within the continents (Yang, Kolari, & Zhu, 2005).
Real estate markets are highly related to the financial markets; thus financial market volatility will impact on the risk level in the property securitised market. Market volatility is very important to policy makers. This is due to the fact that volatility levels will have a significant impact on the condition of the market. Volatility is part of the macro prudential assessment of market performance. Relatively higher levels of volatility indicate higher uncertainty regarding future cash flows and discount rates enhance future economic conditions (Danielsson, Valenzuela, & Zer, 2016). Such high volatility can therefore be seen by forward looking economic agents as a signal of the increased risk of adverse future outcomes and a pending crisis. Therefore, understanding the volatility and property security market is crucial for leveraging decisions. Significant changes in volatility will have a major impact on investors in terms of risk and return. Volatility is associated with unpredictability and uncertainty, and has a significant impact on performance as well as variance risk (Razali, 2015). Investors will see volatility as a major indicator for market symptom disruption and condition of capital markets.
Volatility has long been discussed by both academics and investors. Changes in price volatility in one market (or asset class) produce a lagged effect on volatility in other markets (or asset classes) over and above local effects is called volatility spill overs (Milunovich & Thorp, 2006). There are many research that have shown that volatility spill overs are both significant and widespread, and well identified (Cotter & Stevenson, 2006; Michayluk, Wilson, & Zurbruegg, 2006; Stevenson, 2002). Several studies have investigated the volatility relationship across property markets and found a little impact on significant evidence of cross-volatility spill overs among the Asian-Pacific markets (Garvey, Santry, & Stevenson, 2001; Nguyen, 2012; Pham, 2013; Razali, 2014). Liow (2008), Mei and Hu (2000), and Wilson and Zurbruegg (2004) have identified different findings regarding the spill over and correlation and amongst Asian property securities as these relationships vary over time. In the same way, Real Estate Investment Trust (REIT) has been significant in international volatility spill over within the Pacific region, with significant volatility transmission between the Pacific and the Atlantic regions (Li & Yung, 2007). Furthermore, Sing and Sng (2003) have found significance in the other direction but no evidence of the ex-post return of the direct property incorporating the market volatility of property securities in the context of direct and indirect property.
DATA AND METHODOLOGY
The volatility spill over for each of the pan-Asian listed property companies in 11 countries over the period of year 2000 to 2015 was analysed. The countries involved were Singapore, Malaysia, Japan, Taiwan, Hong Kong, China, Vietnam, Indonesia, Thailand, South Korea and The Philippines.
This research involved time varying volatility, which dataset range from year 2000 to 2015. This research used the EGARCH model to calculate volatility. The spill over volatility indices used a variance decomposition associated with an N-variable Vector Autoregression (VAR) as proposed by Diebold and Yilmaz (2009).
Unit Root and Stationary Test
This test is to examine if two or more-time series’ are integrated in the same order and in a linear combination style. The augmented Dickey-Fuller (ADF) test is used to determine the existence of unit roots. The ADF test is performed using the following regression:
∆𝑃𝑡= 𝛼 + 𝛽𝑃𝑡−1+ ∑ 𝛾𝑖 𝑚
𝑖=2
∆𝑃𝑡−1+ 𝑒𝑡
Where, 𝑃𝑡 is the natural logarithm of a price index. If β is not significantly different from zero, a unit root exists and the series is not stationary and vice versa.
Exponential Generalised Autoregressive Conditional Heteroskedasticity (EGARCH)
According to Engle (1982) the ARCH/GARCH classes of models are some of the most widely used on-linear models for specifying volatility. The model can capture the volatility of stock return specifically long memory, short memory, leverage effect and volatility clustering. ARCH models were introduced by Engle (1982) to specifically model and forecast conditional variances. The ARCH model assumes that the variance of the current period is an equally weighted average of the squared residuals of the previous days. The GARCH model introduced by Bollerslev (1986) uses declining weights for the squared residuals that are estimated by the model. The GARCH model uses conditional variance equation in the following form:
𝜎𝑡 2= 𝜔 + ∑ 𝛽 𝑎
𝑗=1 𝜎𝑡−1
2 + ∑𝑝 𝑎
𝑡−1 𝜀𝑡−1
2
Where ω, a, β are non-negative parameters with a + β < 1 but should be close to unity for an accurate model specification.
Exponential GARCH or EGARCH model that was introduced by Nelson (1991) to capture the leverage effect. The specification for the conditional variance in the EGARCH model is given by:
log 𝜎𝑡2= 𝜔 + 𝛽 log 𝜎𝑡−12 + 𝛼 | 𝜀𝑡 − 1 𝜎𝑡 − 1| + 𝛾
𝜀𝑡 − 1 𝜎𝑡 − 1
The benefit of using EGARCH is in the form of positivity of the parameters with the lag of the variance. Also, there are no restrictions on the parameters ω, a, γ. However, to maintain stationary, β must be positive and less than 1. The leverage effect is indicated by the value of γ. For the leverage effect to be present, γ must be negative and significant.
In this research EGARCH (1, 1) was used to model the volatility of pan-Asian securities’ real estate indices for the time period of 2000 to 2015. Before the EGARCH models are applied, it was necessary to test for the presence of ARCH effects. This was performed by first applying the least squares (LS) method in order to generate regression residuals. Then the ARCH heteroskedasticity test was applied to the residuals to see if time varying volatility clustering does indeed exist.
Statistical analysis including the Kolmogorov-Smirnov (KS) test for normality, the autocorrelation function (ACF) and the Ljung-Box test for linear independence, and the ADF test for unit roots were applied to the pan-Asian securitised real estate indices during the period. Descriptive statistics were also generated. The two variables were monthly returns of the listed property companies and the volatility.
FINDINGS
By using the Philips-Perron test, the ADF test was used to reject the null hypothesis of unit root. Based on the model developed by Levin, Lin and Chu (2002), the ADF specification equation is as follows:
𝑋𝑡= 𝑐 + ∑ 𝜑𝑖 𝑝
𝑖=1
𝑋𝑡−𝑖+ 𝜀𝑡
Where;
𝜑1, … . , 𝜑𝑝 = parameters of the model
𝑐 = constants
𝜀𝑡 = error
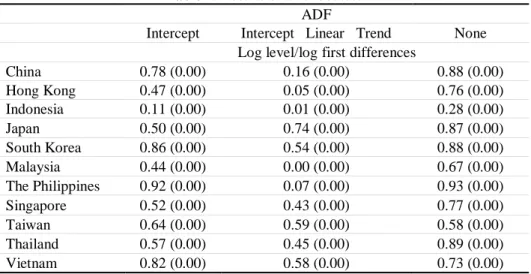
those tested in ADF. The test will allow for individual unit root processes so that (Pi) vary across sections. The tests are all characterised by the combining of individual unit root tests to derive panel specific results. Table 1 exhibits the ADF and PP test for variables in log level. The results revealed that all ADF and PP tests are non-stationary. This indicates the presence of all unit roots of listed property companies in pan-Asian countries. Furthermore, it also showed that non-stationary in log level of the variables with difference in the first log. Engle and Granger (1987) mentioned that this will create the possibility of a long run equilibrium relationship. Based on the model developed by Johansen (1995), EVIEWS software was used to test this relation by implementing VAR as a base co-integration. The VAR number model of lags was based on the suggestion by Lutkepohl and Reimers (1992). Therefore, this model will create five criteria in deciding the model of the lag length. All of the criteria consist of maximum lag length equal to 4 for the VAR model to be stationary with all the roots that must modulus less than 1 inside the unit circle.
Table 1: Results of unit root test ADF
Intercept Intercept Linear Trend None Log level/log first differences
China 0.78 (0.00) 0.16 (0.00) 0.88 (0.00)
Hong Kong 0.47 (0.00) 0.05 (0.00) 0.76 (0.00)
Indonesia 0.11 (0.00) 0.01 (0.00) 0.28 (0.00)
Japan 0.50 (0.00) 0.74 (0.00) 0.87 (0.00)
South Korea 0.86 (0.00) 0.54 (0.00) 0.88 (0.00)
Malaysia 0.44 (0.00) 0.00 (0.00) 0.67 (0.00)
The Philippines 0.92 (0.00) 0.07 (0.00) 0.93 (0.00)
Singapore 0.52 (0.00) 0.43 (0.00) 0.77 (0.00)
Taiwan 0.64 (0.00) 0.59 (0.00) 0.58 (0.00)
Thailand 0.57 (0.00) 0.45 (0.00) 0.89 (0.00)
Vietnam 0.82 (0.00) 0.58 (0.00) 0.73 (0.00)
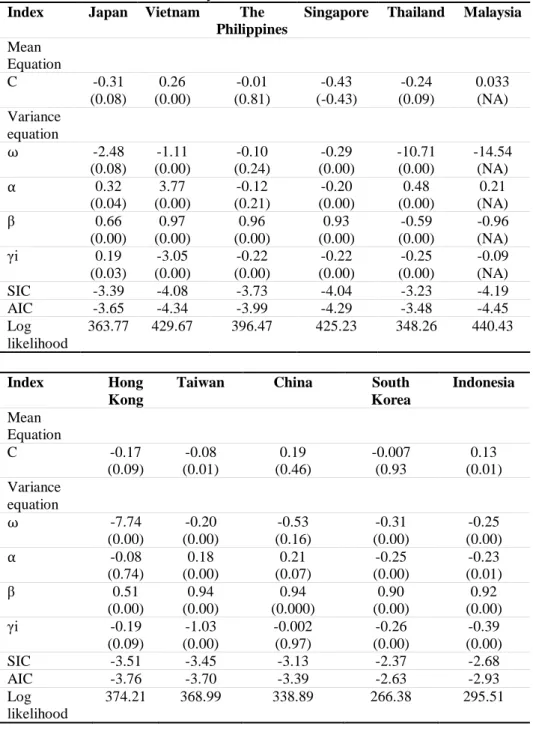
Nelson (1991) established the exponential GARCH model known as the EGARCH model to assess conditional kurtosis in returns of listed property companies. This downward movement will be more influential in predicting volatility than the upward movement. For the purpose of this research only the EGARCH model was used in order to establish a volatility spill over index.
exhibits the leverage effect. The results signify that majority of pan-Asian countries’ public real estate market experienced negative return shock, which produced lower volatility with a return positive shock. In addition, the findings revealed that the β was close to 1, except Vietnam and Taiwan. These two countries showed a high persistence with slow decay of volatility shock for public real estate markets in these countries over this period. In addition, the γ coefficient was negative in the EGARCH model, which null hypothesis was rejected at the 5% level. Hence, it showed effect of the sum leverage. None of the countries have shown insignificant p-value, thus indicating all pan-Asian countries’ listed property companies of the leverage effect are recognised. The output from the findings also revealed the value of β was close to 1, for instance countries such as Vietnam, the Philippines, Singapore, Taiwan, China, South Korea and Indonesia, which indicates high persistence with slow decay of volatility shocks over this period. The results showed that the majority of pan-Asian countries had high volatility over the period of study. The reason behind the high volatility was due to the several financial crises over the period of study, such as the Eurozone debt crisis, GFC, and oil price crisis. Within pan-Asian countries, Vietnam showed highest volatility, followed by the Philippines and China.
These results are similar with Razali’s (2015) and Nguyen’s (2011), which are majority of pan-Asian countries showing a high number of volatility dynamic factors in the property markets. Their findings also revealed the existence of volatility shocks in certain Asian property markets such as Singapore, Japan and Malaysia over the study period of 1987 to 2003.
Table 2: Overall Dynamic of Volatility for Pan-Asian Countries over the Period of January 2000 to December 2015
Index Japan Vietnam The Philippines
Singapore Thailand Malaysia
Mean Equation
C -0.31
(0.08) 0.26 (0.00) -0.01 (0.81) -0.43 (-0.43) -0.24 (0.09) 0.033 (NA) Variance equation ⍵ -2.48 (0.08) -1.11 (0.00) -0.10 (0.24) -0.29 (0.00) -10.71 (0.00) -14.54 (NA) ⍺ 0.32 (0.04) 3.77 (0.00) -0.12 (0.21) -0.20 (0.00) 0.48 (0.00) 0.21 (NA)
β 0.66
(0.00) 0.97 (0.00) 0.96 (0.00) 0.93 (0.00) -0.59 (0.00) -0.96 (NA)
γi 0.19
(0.03) -3.05 (0.00) -0.22 (0.00) -0.22 (0.00) -0.25 (0.00) -0.09 (NA)
SIC -3.39 -4.08 -3.73 -4.04 -3.23 -4.19
AIC -3.65 -4.34 -3.99 -4.29 -3.48 -4.45
Log likelihood
363.77 429.67 396.47 425.23 348.26 440.43
Index Hong
Kong
Taiwan China South
Korea
Indonesia
Mean Equation
C -0.17
(0.09) -0.08 (0.01) 0.19 (0.46) -0.007 (0.93 0.13 (0.01) Variance equation ⍵ -7.74 (0.00) -0.20 (0.00) -0.53 (0.16) -0.31 (0.00) -0.25 (0.00) ⍺ -0.08 (0.74) 0.18 (0.00) 0.21 (0.07) -0.25 (0.00) -0.23 (0.01)
β 0.51
(0.00) 0.94 (0.00) 0.94 (0.000) 0.90 (0.00) 0.92 (0.00)
γi -0.19
(0.09) -1.03 (0.00) -0.002 (0.97) -0.26 (0.00) -0.39 (0.00)
SIC -3.51 -3.45 -3.13 -2.37 -2.68
AIC -3.76 -3.70 -3.39 -2.63 -2.93
Log likelihood
CONCLUSION
The results of the analysis on the pan-Asian countries has showed the presence of the EGARCH effect in all listed property companies as well as the presence of the unit root in all listed property companies for pan-Asian countries over the studied period of time. EGARCH was able to model the volatility of several countries such as Vietnam, the Philippines, Singapore, Thailand, Malaysia, Hong Kong, Taiwan, China, South Korea and Indonesia. The results showed that these countries have high persistence and slow decay from volatility shocks. In overall, most of the pan-Asian countries have shown high volatility, which is believed to be the effect from several financial crises over this period. The results indicated that Vietnam has high volatility, followed by the Philippines and China, supporting the economic theory on risks and returns.
ACKNOWLEDGEMENT
This paper is part of a research funded by Universiti Teknologi Malaysia through Research University Grant (RUG) Vot No.17H05. Special thanks to Universiti Teknologi Malaysia (UTM) and the Ministry of Higher Education Malaysia, for generous support and encouragement.
REFERENCES
Bollerslev, T. (1986). Generalized autoregressive conditional heteroskedasticity. Journal of Econometrics, 31(3), 307-327.
Caporale, G. M., Cipollini, A., & Demetriades, P. O. (2005). Monetary policy and the exchange rate during the Asian crisis: Identification through heteroscedasticity.
Journal of International Money and Finance, 24(1), 39-53.
CBRE (2015). Asia Pacific Real Estate Markets Outlook. CBRE Global Research. Claessens, S., Dell’Ariccia, G., Igan, D., & Laeven, L. (2010). Cross-country experiences
and policy implications from the global financial crisis. Economic Policy, 25(62), 267-293.
Cotter, J., & Stevenson, S. (2006). Multivariate modeling of daily REIT volatility.
Journal of Real Estate Finance and Economics, 32(3), 305-325.
Danielsson, J., Valenzuela, M., & Zer, I. (2016). Learning from history: Volatility and financial crises. The Review of Financial Studies, 31(7), 2274-2805.
Diebold, F. X., & Yilmaz, K. (2009). Measuring financial asset return and volatility spillovers, with application to global equity markets. The Economic Journal, 119(534), 158-171.
Eichholtz, P. M. A., Huisman, R., Koedijk, K., & Schuin, L. (1998). Continental factors in international real estate returns. Real Estate Economics, 26, 493-509. Engle, R. F. (1982). Autoregressive conditional heteroscedasticity with estimates of the
variance of United Kingdom inflation. Econometrica, 50(4), 987-1007. Engle, R. F., & Granger, C. W. (1987). Co-integration and error correction:
Fiorilla, P., Kapas, M., & Liang, Y. (2012). A bird's eye view of global real estate markets: 2012 update. New Jersey: Prudential Real Esatte Investors.
Garvey, R., Santry, G., & Stevenson, S. (2001). The linkages between real estate securities in the Asia Pacific. Pacific Rim Property Research Journal, 7, 240-258.
Ghysels, E., & Seon, J. (2005). The Asian financial crisis: The role of derivative securities trading and foreign investors in Korea. Journal of International Money and Finance, 24(4), 607-630.
Gordon, J. N., & Canter, T. A. (1999). International real estate securities: A test of capital markets integration. Journal of Real Estate Portfolio Management, 5(2), 161-170.
IMF (2015). World economic outlook databases.
Johansen, S. (1995). Likelihood-based inference in cointegrated vector autoregressive models. Oxford: Oxford University Press.
Kim, H., Oh, K. Y., & Jeong, C. W. (2005). Panel cointegration results on international capital mobility in Asian economies. Journal of International Money and Finance, 24(1), 71-82.
Levin, A., Lin, C. F., & Chu, C. S. J. (2002). Unit root tests in panel data: Asymptotic and finite-sample properties. Journal of Econometrics, 108(1), 1-24
Li, D. D., & Yung, K. (2007). REIT returns: Between the Pacific and the Atlantic. Review of Accounting and Finance, 6(4), 353-369.
Liow, K. H. (2008). Financial crisis and Asian real estate securities market interdependence: Some additional evidence. Journal of Property Research, 25(2), 127-155.
Liow, K. H. (2010). Integration between securitised real estate and stock market: A global perspective, Journal of Real Estate Portfolio Management, 16(3), 249-265. Liow, K. H. (1997). The historical performance of Singapore property stocks. Journal of
Property Finance, 8(2), 111-125.
Liu, C. H., & Mei, J. (1998). The predictability of international real estate markets, exchange rate risks and diversification consequences. Real Estate Economics, 26(1), 3-39.
Lütkepohl, H., & Reimers, H. E. (1992). Granger-causality in cointegrated VAR processes the case of the term structure. Economics Letters, 40(3), 263-268. Mei, J., & Hu, J. (2000). Conditional risk premiums of Asian real estate stocks. Journal
of Real Estate Finance and Economics, 21, 297-313.
Michayluk, D., Wilson, P.J., & Zurbruegg, R. (2006). Asymmetric volatility, correlation and returns dynamics between the U.S. and U.K. securities real estate markets.
Real Estate Economics, 34(1), 109-131.
Milunovich, G., & Thorp, S. (2006) Valuing volatility spillovers. Global Finance Journal, 17, 1-22.
Nelson, D. B. (1991). Conditional heteroskedasticity in asset returns: A new approach.
Econometrica, 59(2), 347-370.
Nguyen, T. K. (2012). The volatility spillovers in Asian listed property companies in developed and emerging markets. Pacific Rim Property Research Journal, 18(1), 49-65.
Nguyen, T. K. (2011). The significance and performance of listed property companies in Asian developed and emerging markets. Pacific Rim Property Research Journal, 17(1), 24-47.
Pham, A. K. (2013). An empirical analysis of real estate investment trusts in Asia: Structure, performance and strategic investment implications (Doctoral dissertation). Western Sydney University, Australia.
Razali, M. (2014). The significance and performance of Malaysian listed property companies in Pan-Asian property portfolios (Doctoral dissertation). Western Sydney University, Australia.
Razali, M. (2015). The dynamics of volatility for Asian listed property companies during the global financial crisis. Pacific Rim Property Research Journal, 21(3), 235-257.
Razali, M. N., Lee, J. Y. M., Zainuddin, A. Z., & Yunus, N. M. (2016). Development of knowledge management strategies for property management companies in Malaysia. Journal of Technology Management and Business, 3(1), 1-29. Sing, T. F., & Sng, S. B. S. (2003). Conditional variance tests of integration between
direct and indirect real estate markets. Journal of Property Investment and Finance, 21(4), 366-382.
Steinert, M., & Crowe, S. (2001). Global real estate investment: Characteristics, optimal portfolio allocation and future trends. Pacific Rim Property Research Journal, 7(4), 223-239.
Stevenson, S. (2002). An examination of volatility spillovers in REIT returns. Journal of Real Estate Portfolio Management, 8(3), 229-238.
Wilson, P., & Zurbruegg, R. (2004). Contagion or interdependence? Evidence from co-movements in Asia-Pacific securitised real estate markets during the 1997 crisis.
Journal of Property Investment and Finance, 22, 401-413.
Yang, J., Kolari, W., & Zhu, G. (2005). European public real estate market integration.
Financial Economics, 15, 895-905
Received: 28th October 2018. Accepted:1st March 2019