Feature Extraction and Image classification
Akshata M. Marnur1, Prof Anil B. Gavade2
1
Department of Electronics and Communication, KLS Gogte Institute of Technology, Belgaum, India)
2
Department of Electronics and Communication, KLS Gogte Institute of Technology, Belgaum, India)
Abstract: The meaningful categorizing of the image pixel values so as to obtain the classification for satellite image which has become most important aspect for Map making and map updating . operations like information extraction , classification are done in satellite image processing. The Satellite images play major role in hassle free monitoring and management of the natural resources such as land , forest , water etc. Manual identification and classification of satellite images is hectic task. Tremendous and invaluable sources of information is obtained from the remotely sensed satellite images which later are involved in investigations since they provide spatial and temporal information about the nature of earth surface materials and objects. The work thus performs various techniques to classify the satellite image . Artificial Neural Network is used for the Edge Detection of the satellite image rather than using the conventional methods . A Fuzzy Interface System is used for the classification of the image into three classes as Vegetation , Land and Water regions. The method and the completed details of the project are illustrated as various chapters in the paper.
Keywords: supervised classification, Artificial Neural Network, Graphical User Interface, Fuzzy Logic System
I.INTRODUCTION
A. Image classification
Satellite Image Classification is a key factor for number of Automatic Map generation and object recognition systems. Image classification acts as important part of various applications example: image analysis, remote sensing and pattern recognition [1]. The process of grouping pixel in fixed set of individual classes depending upon their data values is known as the classification of remotely sensed images. If the pixel satisfies the certain set of rules to fall in a particular class then it is assigned to that class [6]. Multispectral satellite images plays important role in remote sensing . Geographical information about large area and in relatively small time is provided by Satellite Images. Land degradation, Geology, Oceanography, Soil classification etc various applications use Remotely sensed satellite images [2].
In image classification by using prior knowledge classification can be divided in two ways:
Unsupervised image classification. Supervised image classification. Supervised and unsupervised image classification are two categories for automatic image classification techniques and are known as Hard and soft , parametric or non-parametric classification Techniques. The automated systems apply the selected algorithm to entire image and group the similar pixels together so as to perform the image segmentation according to required needs.
B. Supervised
In supervised classification study area has to be examined before to gain prior knowledge. Operator (Image analyst) selects the training pixels. These training pixels help to obtain various land cover features. With the help of these features the classification is carried out. Number of supervised classifiers are minimum distance, support vector machine, maximum likelihood, and parallelepiped[2].
1) Support Vector Machine (SVM): In supervised classification(SC) system SVM is based on statistical learning. SVM is used for classification and regression. Face identification, text categorization, bioinformatics, database mining, handwritten character recognition and time series analysis are different applications of SVM . SVM classifier separated both Testing and training. It SVM classifier has least number of misclassification. It does not depend on feature dimensionality. SVM produces accurate result[2]
resemble to the biological neurons. Each node has a specific weight assigned to it . Altering the weights of the nodes one can obtain the desired output.
3) Input layer: This is the first layer with the number of inputs to the system. The input nodes are connected with each and every node of the next layer.
4) Hidden layer: The layer between the input layer and the output layer which performs all the feature extraction , detection and pattern recognition
5) Output layer: This layer gives the desired output computed from the previous layers. Neural network require huge computational power to obtain the desired output . The neural networks are slow learners hence require huge training sets . The back propagation algorithm to a neural network is applies were in the input values are processed and the errors generated are back propagated and later these errors are corrected by adjusting the weights of the nodes in the next propagation . several such propagation takes place before we obtain the results.
6) Fuzzy Logic Classifier: Fuzzy is nothing but a Knowledge based method which is widely used in Remote Sensing Image Classification and Pattern Recognition. Fuzzy logic helps to deal with complicated systems in the simplest manner. The Theory of Fuzzy logic includes some concept called as degree of membership. Each element in the fuzzy set can either be a full member or a partial member. Each member is assigned with a value in the range of [ 0 ,1 ]. During the classification process is pixel is assigned to a membership group as to decide which class it belongs to[4]. The fuzzy classification has the following operations:
7) Fuzzification: All the inputs to the fuzzy system are converted to a fuzzy set.
8) Interference: The fuzzy rules are evaluated in the form of IF-THEN and fuzzy output is obtained.
9) Defuzzification: The inverse function of Fuzzification . converts the fuzzy output to crisp values. The Accuracy of the Fuzzy system depends on the amount of correct classification performed by fuzzy logic.
C. Unsupervised
Unsupervised classification does not require any prior knowledge of study area. In this classification large number of unknown pixels are studied which are then segmented into different classes depending on natural groupings of images[2]. The different types of unsupervised classification techniques are K-means clustering algorithm , ISODATA clustering.
D. Edge Detection
The edge is a group of those pixels whose intensities vary, and are present between object and background , element and element, region and region, and between object and object. Edge detection is a type of method of image segmentation which depends on discontinuity in the range. Edge detection is very important in the digital image processing, because the edge is boundary of the target and the background. And only when obtaining the edge we can differentiate the target and the background. The edge detection in images using edge detectors: Robert, sobel, Prewitt, Laplacian, canny and wavelet transform. Image segmentation includes slicing of an image into multiple parts. Most of times it is used to detect objects , and other relevant data present in digital images. The goal of image segmentation is to identify the meaningful area of the satellite image such as urban area, water resources , land coverage. These algorithms can be directly applied to the source images, or post the application of some transforms and filters.
Histogram based methods are strong and tend to give better results compared to any other image segmentation methods. Here a histogram is derived from all of the pixels in the image, and the clusters are located using the peaks and valleys in the histogram. .
II.RELATEDWORK
A High resolution remote sensing image segmentation with fuzzy classification technique is introduced in paper [9]. The technique is based on multi-thresholds method. During the Image segmentation edges of the image are identified and derived with the algorithms having homogeneity definitions .This technique binds the items based on a optimization function by using the region-merging method. In paper [3] ANN is used to perform the Edge detection. Most frequently used Initial step in Image processing to perform action recognition is Edge detection. A NN learns by altering the weights between the dissimilar layers. The ANN model used has 1 input layer, 1 output layer and 1 hidden layer. The input layer consist of 4 neurons presented as a 2X2 input window. The hidden layer has 12 hidden neurons with single neuron in the output layer. The output layer gives the edge detected. A 2X2 sliding window is used to perform the Edge detection. The 2X2 window is provided with 4 crisp values all these crisp values are later mapped as four inputs for the FIS. The pixel is grouped as Edge / Non-edge by the ANFIS method. The performance is evaluated using PSNR and PR parameters . The best quality of edge detection happens when PR value is highest. This technique results with better classification and edge detection than those of Sobel and Canny. The method results in well-defined and clear edges.[3] Paper [8] presents a hybrid method for training the classifier. It uses a Fuzzy-fusion Interface to classify the satellite images. The technique follows certain steps. The first step is fuzzification- It includes the creation of membership function using the training data set and the histogram of them. This set is used to perform the fuzzification of the bands. The second step is to detect the land cover in the images by creating a set of rules which use all the input variable. The last step is formation of new fuzzy-interference system. This system uses a sugeno logic to test the developed scheme with 4 operators. This scheme results in evaluation of operators, with high accuracy , precise classification when compared to other methods.
In the paper[15] it involves two aims that have emerged in neural networks i.e the increase in the ability to understand the behaviour of nervous system and thus taking inspiration from this knowledge and building up of new systems to perform some related tasks presents a comprehensive overview of modelling, simulation and implementation of neural networks. It also includes the growth and evolution in different aspects of neural networks. The papers enlightens the fact that how neural network has contributed in the development of various concepts such as Neuro-engineering, Computational Intelligence, Computational Neuroscience and Machine Learning. It depicts that how the interest in Artificial Neural Network is increasing and ANN’s algorithms and models are used as standard tools in various fields such as information engineering. In the field of information processing neural network is used to solve some real time problems as it has a robust set of computation procedures along with theoretical bases.[15]
III. METHODOLOGY
[image:3.612.241.370.454.719.2]A. Flowchart
The method used are Artificial Neural Network for edge detection and Fuzzy Interface System for image classification.
B. Input Image
MATLAB supports the following graphics file formats:
1) BMP (Microsoft Windows Bitmap).
2) HDF (Hierarchical Data Format).
3) JPEG (Joint Photographic Experts Group).
4) PCX (Paintbrush).
5) PNG (Portable Network Graphics).
6) TIFF (Tagged Image File Format).
7) XWD (X Window Dump).
The input satellite image is in the form of LAN format. The satellite image is of 7 bands . This image is converted into TIFF format for the further processing.
C. Pre-Processing
To remove any type of distortion due to the imaging conditions processing of the raw data is performed. Then the data analysis is performed. Depending on the requirements of the user, certain standard correction methods may be employed in ground station operators and then the data is delivered to the end-user.
1) Image Enhancement ; Image enhancement technique is a method to increase quality of image. It also enhances the content present in the image. For example, (SNR) signal-to-noise ratio enhancement , colors or intensities are varied to alter certain features so as to identify precisely
2) Histogram Equalization: Histogram equalization is a image enhancement method. In histogram equalization, depending on frequency, intensity level for each input is assigned with output intensity levels. The input images with higher frequency ranges carry more information. The lower frequency ranges carry lesser information. More display levels are assigned to the higher frequency ranges. Better information enhancement is obtained by histogram equalization rather than less-complex linear intensity enhancement. The histeq command is used in MATLAB to perform Histogram equalization. This histeq command spreads the intensity values of I of the original image over the entire range, therfore improving contrast. If IM variable is used to Store the modified image.
IM = histeq (I);
IM is the new equalized image, imshow. figure, imshow(IM) command displays a new figure window
3) Adding Image: To add 2 images to add a constant value to an image imadd function is used. The imadd command adds the corresponding value of each pixel in input images and the other input image resulting in the sum in the corresponding pixel of the output image. The images have to be of the same size and class. Now the RGB image is formed by combining the histeq images together .
D. Applying transforms
1) Edge Detection Using Neural Network: In Edge Detection edges represent regions in an image resembling boundaries to objects. Rapid changes in the intensities , pixel values in an image edges usually correspond to edges. The toolbox function edge spots the regions with recognizable change in intensity and detects the edges. Output image is a binary image where 1's are assigned to edges detected and 0's to remaining pixels. Sobel method and Canny’s method are present in MATLAB toolbox for the edge detection. The edge function needs 2 arguments one for the image for which the edges are to be recognized and other method for edge detection. Artificial neural networks (ANN) is also used for edge detection in recent times.ANN employs a artificial neurons that are interconnected group having a natural property for storing experimental knowledge and using it to process data.
2) Feed-Forward Neural Networks
Simple neuron-like processing units are organized in layers in Feed-forward NN. Different layers consist of neurons are interconnected. Every connections may have different strength or weight or may be equal. The knowledge of a network are encoded by the weights. First the data enters at the inputs. Then travels through the network from one layer to another layer, at last arrives at the outputs. In a Multi-layer feed forward neural network one or more “hidden layers” are present consisting of hidden neurons.
a) Learning Using Back Propagation
During learning changing the weights and updating them the error function is decreased. The multiple training patterns to NN with BP Edge detection can be performed.
b) Testing Data Set
Normalized values of input image are taken and given to the network.
c) Architecture Of The Network
Network architecture consist of 3 input Layer, 3 hidden layer and 1 output layer.
d) Initialization Of Weight And Parameter Modification
Initially random weights are assigned to the network. This implementation uses Learning rate 0.1 initially. Trained with 1000 epochs. Gaussian smoothing parameter for regularizing the level set is 1.5.
e) Testing And Training
The Back-propagation learning algorithm is used for training. It minimizes the error. weights are updated. Then outputs are calculated within the known output limits. 0.5 threshold is applied To obtain the best and accurate result during testing.
E. Image classification.
Fig 3.2 .The General Architecture of a Fuzzy Logic System (FLS) include :
1) Fuzzifier: The fuzzifier transforms the crisp set values to fuzzy sets by applying fuzzification function.
2) Rules: If-THEN rules composed.
3) Inference Engine: The rules and inference engine are the main component of fuzzy logic system which simulates thehuman reasoning process by making fuzzy inference on the inputs with IF THEN rules.
4) Defuzzifier: The defuzzifier transforms the fuzzy values to crisp sets by applying de-fuzzification function.
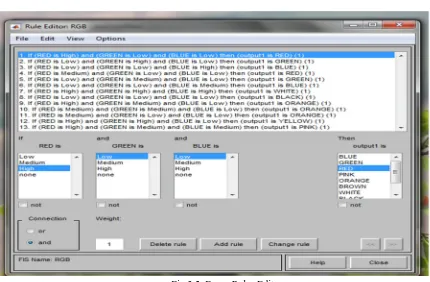
[image:5.612.126.487.484.657.2]If we consider the satellite images, input data is not in the form of true colour image but for demonstration purpose, a three band {R (red) G (green) B (blue)}. Defuzzifier converts the resultant fuzzy set back to a crisp value set which is the system output. The Sugeno method has been implemented shown in fig 4.3. If the arrangements of membership functions in output are opted carefully , there is huge rise in accuracy fig.4.4 .
Fig 3.2 : The General Architecture Of A Fuzzy Logic System.
5) Vegetation Region Classification: The vegetation region is obtained by performing calculations over the NISB and RED band . both bands are added and subtracted from each other then the values obtained are divided.
The image obtained is the result of vegetation classification . the threshold can be set using a colorbar. The colorbar function can be used to add a color bar. The red portion in the image indicates vegetation.
6) Water Bodies Classification: The sample value for the blue color is found in fuzzy interface system . the for loop is used to perform the iteration and find out all the values matching the index. This region is indicated as the water bodies .
7) Land Classification: The image is subtracted with regions already classified and indicated as land portion.
[image:6.612.347.489.156.288.2]Fig 3.3: Fuzzy Logic Designer with Input and Output
Fig 3.4: Membership Function Editor.
[image:6.612.78.508.319.601.2].
Fig 3.5: Fuzzy Rules Editor.
F. Graphical User Interface
IV.RESULTS
The input image is first subjected to feature extraction. The edge detection performed using Neural Network has best results. The fuzzy logic system implemented is a Sugeno type to classify the image into 3 classes VEGETATION , LAND , WATER . This implementation is carried out over two satellite images PARIS.lan (image source : MATLAB) and MISSISIPPI.lan . The following are the screenshots of the results obtained for the classification process.
A. Basic Feature Extraction
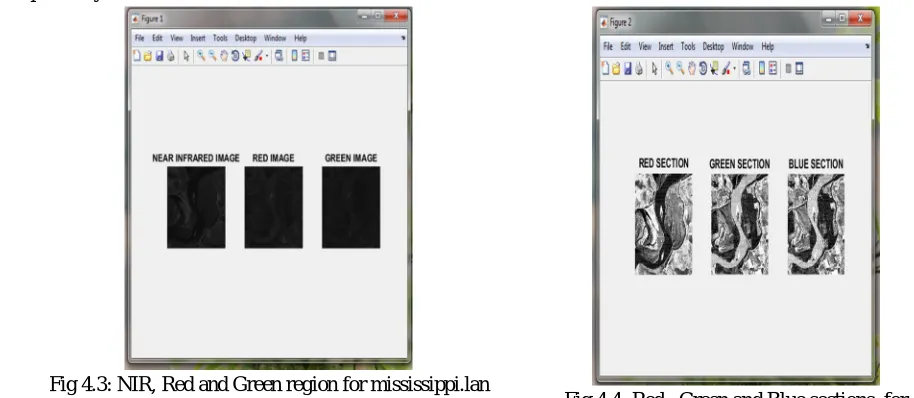
[image:7.612.96.504.179.442.2]1) Obtaining NIR, RED , GREEN image.
[image:7.612.55.512.505.704.2]Fig 4.1: NIR, Red and Green region for paris.lan image.
Fig 4.2: Red , Green and Blue sections for paris.lan image.
The first step is extraction of the 3 bands from the satellite image for the classification process. Fig 4.1 , Fig 4.3 shows the NIR, Red and Green region image for paris.lan image and mississipi.lan respectively.
[image:7.612.93.262.506.690.2]2) Extracting Red , Green and Blue Sections: The red , green and blue section is extracted from the prior image and then combined together to form the RGB image. Fig 4.2 and Fig 4.4 shows the Red , Green and Blue sections for paris.lan and mississippi.lan respectively.
Fig 4.3: NIR, Red and Green region for mississippi.lan
image. Fig 4.4: Red , Green and Blue sections for
[image:7.612.344.495.507.700.2]3) Performing the Histogram Equalization on Image: Next the Histogram equalization of these images is done so as to perform the image enhancement . The intensity of images are increased and makes the image more clear. The Histogram equalized image is as shown in Fig 4.5 and Fig 4.6 for paris.lan and Mississippi.lan respectively.
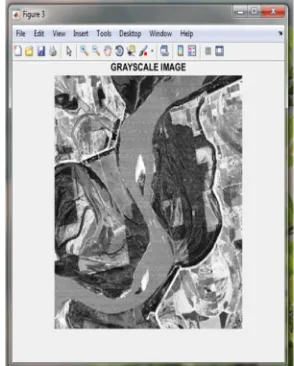
4) Grayscale and Filtered Image The basic feature extraction is performed on the images that is extracting the gray scale image: shown in Fig 4.7 and Fig 4.9 for paris.lan and Mississippi.lan respectively., Filtered image is as shown in Fig 4.8 and 4.10. for paris.lan and Mississippi.lan respectively.
Fig 4.5 Histogram equalized image for Paris.lan. Fig 4.6 Histogram equalized image for mississippi.lan.
[image:8.612.357.502.168.311.2]Fig 4.7: Grayscale image for Paris.lan. Fig 4.8: Filtered image Paris.lan.
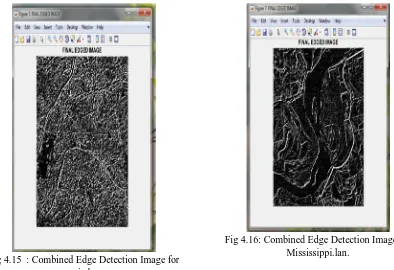
[image:8.612.113.258.169.313.2] [image:8.612.83.230.515.698.2]5) Edge Detection: First the horizontal edge detection is performed as shown in Fig 4.11 and Fig 4.13 for paris.lan and Mississippi.lan respectively. Next vertical edge detection for paris.lan and Mississippi.lan is shown in Fig 4.12 and Fig 4.14 respectively. Later both the images are combined to obtain the final edge detection image. The final edge detection system for paris.lan and Mississippi.lan images is as shown in Fig 4.15 and 4.16 respectively.
[image:9.612.347.497.170.423.2]6) Binarised Image : The image is subjected to Binarising the pixel .Binarised image obtained is as shown in Fig 4.17 and Fig 4.18 for paris.lan and Mississippi.lan images respectively.
[image:9.612.117.261.171.421.2]Fig 4.11: Horizontal edge detection image for Paris.lan. Fig 4.12: Vertical edge detection image for Paris.lan.
[image:9.612.105.499.451.721.2]Fig 4.15 : Combined Edge Detection Image for paris.lan.
[image:9.612.346.495.452.680.2]Fig 4.15 : Combined Edge Detection Image for paris.lan.
Fig 4.16: Combined Edge Detection Image for Mississippi.lan.
Fig 4.17: Binarised image for paris.lan. Fig 4.18: Binarised image for Mississippi,lan.
B. Edge Detection Using Artificial Neural Network
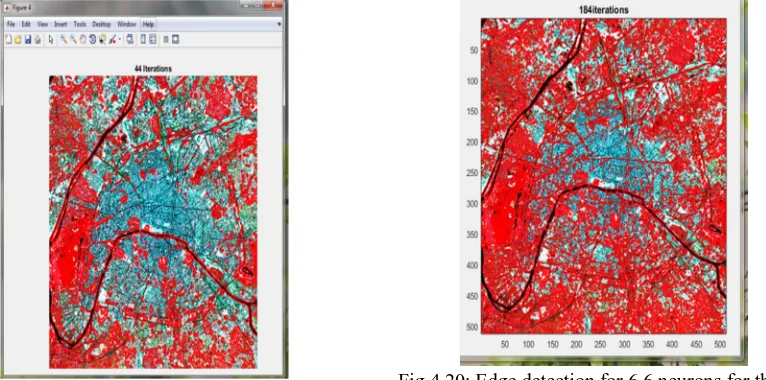
After completion of all the basic feature extraction process the next step is to perform the Edge detection using Artificial Neural Network. 0.1 is set as Learning rate initially. The Artificial Neural network is trained for 1000 epochs. Gaussian smoothing parameter for regularizing the level set is 1.5. When the values for Number of neurons for the x ,y dimension of the map are changes the number of iterations also change. The accuracy for different number of iterations increases with number of iterations .
[image:10.612.350.499.276.422.2]Fig 4.19: Edge detection for 4,4 neurons for the x,y dimension of the map for paris.lan.
[image:10.612.115.264.277.430.2] [image:10.612.119.502.520.710.2]The number of iteration increases the quality of image with better number of edge detection which in turn gives accurate results. Fig 4.19 and Fig 4.20 show the edge detection with number of iterations for the (4,4) and (6,6) values of neurons for the x ,y dimension of the map for paris.lan image. Fig 4.21 and Fig 4.22 show edge detection with number of iterations for the (4,4) and (6,6) values of neurons for the x ,y dimension of the map for mississippi image.
[image:11.612.348.495.130.276.2]Fig 4.21: Edge detection for 4,4 neurons for the x,y dimension of the map for mississippi.lan.
Fig 4.22: Edge detection for 6,6 neurons for the x,y dimension of the map mississippi.lan.
[image:11.612.40.261.318.454.2]C. Image Classifcaton
Fig 4.23 : Vegetation region classification for paris.lan. Fig 4.24 : Vegetation region classification
mississipppi.lan.
1) Classification Of Vegetation Region: The Vegetation classification is as shown in the Fig 4.23 and Fig 4.24 for paris.lan and mississippi.lan images respectively. The red portion present in the image indicates the vegetation region. The colorbar is used to select threshold for the image. The next part is to identify / classify the water bodies.
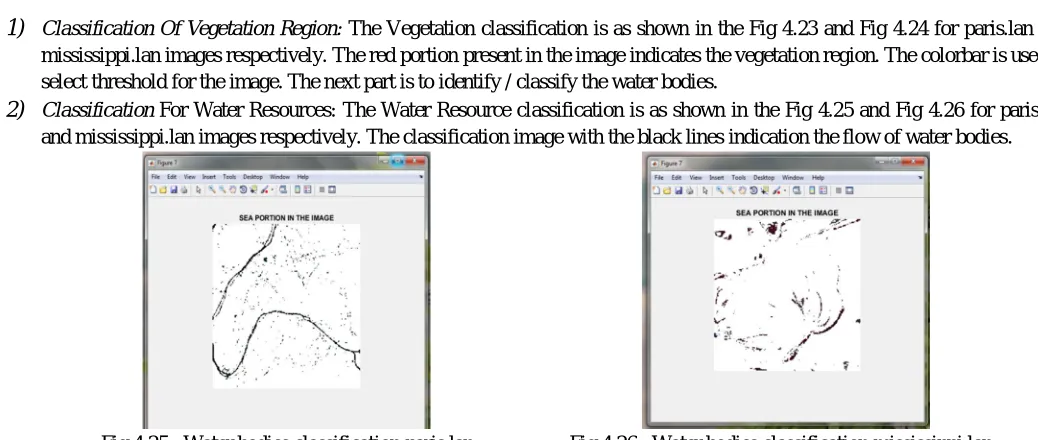
2) Classification For Water Resources: The Water Resource classification is as shown in the Fig 4.25 and Fig 4.26 for paris.lan and mississippi.lan images respectively. The classification image with the black lines indication the flow of water bodies.
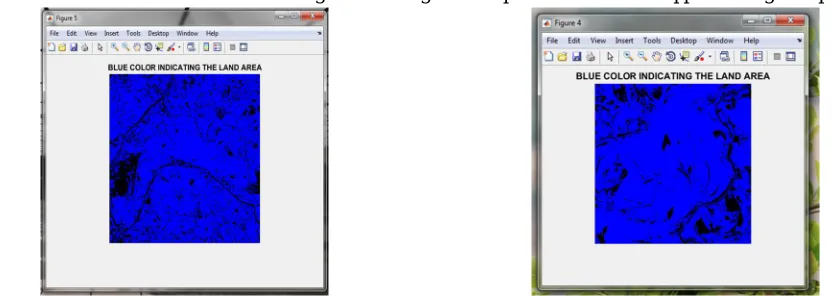
[image:11.612.345.502.325.482.2] [image:11.612.38.557.490.710.2]3) Classification For Land Section: The Land region classification is performed by subtracting the prior classification of vegetation region and water resources from the original image. The image remains with the Land coverage . The Land section classification is as shown in the Fig 4.27 and Fig 4.28 for paris.lan and mississippi.lan images respectively.
Fig 4.27: Land region classification for paris.lan. Fig 4.28 : Land region classification for mississippi.
[image:12.612.74.499.301.583.2]4) Graphical User Interface
Fig 5.29: GUI to perform operations on single flat form.
Fig 4.30: GUI after performing operations on single flat form.
V.CONCLUSIONANDFUTURESCOPE
A. Conclusion
The present work discusses about the satellite image classification techniques and methods. It provides detailed information about the various classification techniques and methods. Mainly classification techniques are segmented into three types such as Supervised Classification, Unsupervised Classification and Semi supervised classification. Artificial Neural Network and Fuzzy logic techniques emerge to be the latest and most used for image classification with best results. The image classification is performed using Fuzzy Interface System and the Edge detection is performed using both conventional method and Artificial Neural Network. The ANN gives better results for Edge detection.
B. Future scope
The implemented classification techniques can be further compared with conventional methods and comparing the accuracy. Also research can be done to find out which combination of techniques produce best results for classification.
REFERENCES
[1] Kanika kalra, anil kumar goswami, rhythm gupta , A comparative study of supervised image Classification algorithms for satellite images, International journal of electrical, electronics and data communication, Dec-2013
[2] Sayali Jog, Mrudul Dixit ,Supervised Classification of Satellite Images, Conference on Advances in Signal Processing (CASP), Jun 9-11, 2016 [3] Shamama Anwar, Sugandh Raj, A Neural Network Approach to Edge Detection using Adaptive Neuro – Fuzzy Inference System, IEEE , 2014.
[4] A. L. Choodarathnakara, Satellite Image Classification with Fuzzy Logic: from Hard to Soft Computing Situation, The International Journal of Computer Science & Applications (TIJCSA), November 2012.
[5] Shivali A. Kar, and Vishakha V. Kelkar, Classification of Multispectral Satellite Images, ICATE , 2013.
[6] Pushpendra Singh Sisodia, Vivekanand Tiwari, Anil Kumar, A Comparative Analysis of Remote Sensing Image Classification Techniques, IEEE, 2014. [7] Dr. Nabeel Hashem Kaghed, Dr. Tawfiq A. Abbas, Samaher Hussein Ali, Design and Implementation of Classifi'cation System for Satellite Images based on
Soft Computing Techniques, IEEE, 2006.
[8] Tiago M. A. Santos André Mora, Rita A. Ribeiro and João M. N. Silva, Fuzzy-Fusion approach for Land Cover Classification, IEEE International Conference on Intelligent Engineering Systems, June 30-July 2, 2016
[9] Chengfan Li, Jingyuan Yin, Junj uan Zhao, Extraction of Urban Vegetation from High Resolution Remote Sensing Image, International Conference On Computer Design And Appliations,IEEE ,2010
[10] D.G. Stavrakoudis , J.B. Theocharis , G.C. Zalidis, A Boosted Genetic Fuzzy Classifier for land cover classification of remote sensing imagery, International Society for Photogrammetry and Remote Sensing, Inc , Elsevier B.V , 2011
[11] Anis Mahmon1 and Norsuzila Ya’acob, A Review on Classification of Satellite Image Using Artificial Neural Network (ANN), Control and System Graduate Research Colloquium, IEEE, 2015
[12] Wei Zhang, Zhong Li, Weidong Xu, Haiquan Zhou, A Classifier of Satellite Signals Based on the Back-Propagation Neural Network, International Congress on Image and Signal Processing, 2015
[13] Mr.Anand Upadhyay, Dr.S.K.Singh , Ms.Pooja Singh, Ms.Priya Singh, Comparative study of Artificial Neural Network based classification of IRS LISS-III satellite images, IEEE, 2015.
[14] K. C. Tan, H. S. Lim and M. Z. Mat Jafri, Comparison of Neural Network and Maximum Likelihood Classifiers for Land Cover Classification Using Landsat Multispectral Data, IEEE Conference on Open Systems , 201