Models of Semantic Representation with Visual Attributes
Carina Silberer, Vittorio Ferrari, Mirella Lapata
School of Informatics, University of Edinburgh 10 Crichton Street, Edinburgh EH8 9AB
[email protected], [email protected], [email protected]
Abstract
We consider the problem of grounding the meaning of words in the physical world and focus on the visual modality which we represent by visual attributes. We create a new large-scale taxonomy of visual at-tributes covering more than 500 concepts and their corresponding 688K images. We use this dataset to train attribute classi-fiers and integrate their predictions with text-based distributional models of word meaning. We show that these bimodal models give a better fit to human word as-sociation data compared to amodal models and word representations based on hand-crafted norming data.
1 Introduction
Recent years have seen increased interest in grounded language acquisition, where the goal is to extract representations of the meaning of nat-ural language tied to the physical world. The language grounding problem has assumed sev-eral guises in the literature such as semantic pars-ing (Zelle and Mooney, 1996; Zettlemoyer and Collins, 2005; Kate and Mooney, 2007; Lu et al., 2008; B¨orschinger et al., 2011), mapping nat-ural language instructions to executable actions (Branavan et al., 2009; Tellex et al., 2011), associ-ating simplified language to perceptual data such as images or video (Siskind, 2001; Roy and Pent-land, 2002; Gorniak and Roy, 2004; Yu and Bal-lard, 2007), and learning the meaning of words based on linguistic and perceptual input (Bruni et al., 2012b; Feng and Lapata, 2010; Johns and Jones, 2012; Andrews et al., 2009; Silberer and Lapata, 2012).
In this paper we are concerned with the latter task, namely constructing perceptually grounded
distributional models. The motivation for models that do not learn exclusively from text is twofold. From a cognitive perspective, there is mounting experimental evidence suggesting that our inter-action with the physical world plays an impor-tant role in the way we process language (Barsa-lou, 2008; Bornstein et al., 2004; Landau et al., 1998). From an engineering perspective, the abil-ity to learn representations for multimodal data has many practical applications including image re-trieval (Datta et al., 2008) and annotation (Chai and Hung, 2008), text illustration (Joshi et al., 2006), object and scene recognition (Lowe, 1999; Oliva and Torralba, 2007; Fei-Fei and Perona, 2005), and robot navigation (Tellex et al., 2011).
One strand of research uses feature norms as a stand-in for sensorimotor experience (Johns and Jones, 2012; Andrews et al., 2009; Steyvers, 2010; Silberer and Lapata, 2012). Feature norms are ob-tained by asking native speakers to write down at-tributes they consider important in describing the meaning of a word. The attributes represent per-ceived physical and functional properties associ-ated with the referents of words. For example,
apples are typically green or red, round, shiny, smooth, crunchy, tasty, and so on;dogshave four legs and bark, whereas chairs are used for sit-ting. Feature norms are instrumental in reveal-ing which dimensions of meanreveal-ing are psychologi-cally salient, however, their use as a proxy for peo-ple’s perceptual representations can itself be prob-lematic (Sloman and Ripps, 1998; Zeigenfuse and Lee, 2010). The number and types of attributes generated can vary substantially as a function of the amount of time devoted to each concept. It is not entirely clear how people generate attributes and whether all of these are important for repre-senting concepts. Finally, multiple participants are required to create a representation for each
cept, which limits elicitation studies to a small number of concepts and the scope of any compu-tational model based on feature norms.
Another strand of research focuses exclusively on the visual modality, even though the grounding problem could involve auditory, motor, and hap-tic modalities as well. This is not entirely sur-prising. Visual input represents a major source of data from which humans can learn semantic rep-resentations of linguistic and non-linguistic com-municative actions (Regier, 1996). Furthermore, since images are ubiquitous, visual data can be gathered far easier than some of the other modali-ties. Distributional models that integrate the visual modality have been learned from texts and im-ages (Feng and Lapata, 2010; Bruni et al., 2012b) or from ImageNet (Deng et al., 2009), e.g., by exploiting the fact that images in this database are hierarchically organized according to WordNet synsets (Leong and Mihalcea, 2011). Images are typically represented on the basis of low-level fea-tures such as SIFT (Lowe, 2004), whereas texts are treated as bags of words.
Our work also focuses on images as a way of physically grounding the meaning of words. We, however, represent them by high-level vi-sual attributes instead of low-level image fea-tures. Attributes are not concept or category spe-cific (e.g., animals have stripes and so do cloth-ing items; balls are round, and so are oranges and coins), and thus allow us to express similarities and differences across concepts more easily. Fur-thermore, attributes allow us to generalize to un-seen objects; it is possible to say something about them even though we cannot identify them (e.g., it has a beak and a long tail). We show that this attribute-centric approach to representing images is beneficial for distributional models of lexical meaning. Our attributes are similar to those pro-vided by participants in norming studies, however, importantly they arelearnedfrom training data (a database of images and their visual attributes) and thus generalize to new images without additional human involvement.
In the following we describe our efforts to cre-ate a new large-scale dataset that consists of 688K images that match the same concrete concepts used in the feature norming study of McRae et al. (2005). We derive a taxonomy of 412 visual at-tributes and explain how we learn attribute clas-sifiers following recent work in computer vision (Lampert et al., 2009; Farhadi et al., 2009). Next,
we show that this attribute-based image represen-tation can be usefully integrated with textual data to create distributional models that give a better fit to human word association data over models that rely on human generated feature norms.
2 Related Work
Grounding semantic representations with visual information is an instance of multimodal learn-ing. In this setting the data consists of multiple input modalities with different representations and the learner’s objective is to extract a unified repre-sentation that fuses the modalities together. The literature describes several successful approaches to multimodal learning using different variants of deep networks (Ngiam et al., 2011; Srivastava and Salakhutdinov, 2012) and data sources including text, images, audio, and video.
Special-purpose models that address the fusion of distributional meaning with visual information have been also proposed. Feng and Lapata (2010) represent documents and images by a common multimodal vocabulary consisting of textual words and visual terms which they obtain by quantizing SIFT descriptors (Lowe, 2004). Their model is es-sentially Latent Dirichlet Allocation (LDA, Blei et al., 2003) trained on a corpus of multimodal docu-ments (i.e., BBC news articles and their associated images). Meaning in this model is represented as a vector whose components correspond to word-topic distributions. A related model has been pro-posed by Bruni et al. (2012b) who obtain distinct representations for the textual and visual modali-ties. Specifically, they extract a visual space from images contained in the ESP-Game data set (von Ahn and Dabbish, 2004) and a text-based seman-tic space from a large corpus collection totaling approximately two billion words. They concate-nate the two modalities and subsequently project them to a lower-dimensionality space using Sin-gular Value Decomposition (Golub et al., 1981).
Traditionally, computer vision algorithms de-scribe visual phenomena (e.g., objects, scenes, faces, actions) by giving each instance a categor-ical label (e.g., cat, beer garden, Brad Pitt, drink-ing). The ability to describe images by their at-tributes allows to generalize to new instances for which there are no training examples available. Moreover, attributes can transcend category and task boundaries and thus provide a generic de-scription of visual data.
focused on simple color and texture attributes (e.g., blue, stripes) and showed that these can be learned in a weakly supervised setting from im-ages returned by a search engine when using the attribute as a query. Farhadi et al. (2009) were among the first to use visual attributes in an ob-ject recognition task. Using an inventory of 64 at-tribute labels, they developed a dataset of approx-imately 12,000 instances representing 20 objects from the PASCAL Visual Object Classes Chal-lenge 2008 (Everingham et al., 2008). Visual semantic attributes (e.g., hairy, four-legged) were used to identify familiar objects and to describe unfamiliar objects when new images and bound-ing box annotations were provided. Lampert et al. (2009) showed that attribute-based representations can be used to classify objects when there are no training examples of the target classes available. Their dataset contained over 30,000 images repre-senting 50 animal concepts and used 85 attributes from the norming study of Osherson et al. (1991). Attribute-based representations have also been ap-plied to the tasks of face detection (Kumar et al., 2009), action identification (Liu et al., 2011), and scene recognition (Patterson and Hays, 2012).
The use of visual attributes in models of distri-butional semantics is novel to our knowledge. We argue that they are advantageous for two reasons. Firstly, they are cognitively plausible; humans em-ploy visual attributes when describing the proper-ties of concept classes. Secondly, they occupy the middle ground between non-linguistic low-level image features and linguistic words. Attributes crucially represent image properties, however by being words themselves, they can be easily inte-grated in any text-based distributional model thus eschewing known difficulties with rendering im-ages into word-like units.
A key prerequisite in describing images by their attributes is the availability of training data for learning attribute classifiers. Although our database shares many features with previous work (Lampert et al., 2009; Farhadi et al., 2009) it dif-fers in focus and scope. Since our goal is to develop distributional models that are applicable to many words, it contains a considerably larger number of concepts (i.e., more than 500) and at-tributes (i.e., 412) based on a detailed taxonomy which we argue is cognitively plausible and ben-eficial for image and natural language processing tasks. Our experiments evaluate a number of mod-els previously proposed in the literature and in
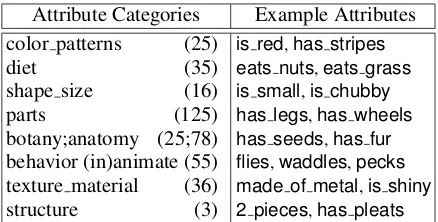
[image:3.595.307.526.62.173.2]Attribute Categories Example Attributes color patterns (25) is red,has stripes diet (35) eats nuts,eats grass shape size (16) is small,is chubby parts (125) has legs,has wheels botany;anatomy (25;78) has seeds,has fur behavior (in)animate (55) flies,waddles,pecks texture material (36) made of metal,is shiny structure (3) 2 pieces,has pleats
Table 1: Attribute categories and examples of at-tribute instances. Parentheses denote the number of attributes per category.
all cases show that the attribute-based represen-tation brings performance improvements over just using the textual modality. Moreover, we show that automatically computed attributes are compa-rable and in some cases superior to those provided by humans (e.g., in norming studies).
3 The Attribute Dataset
Concepts and Images We created a dataset of images and their visual attributes for the nouns contained in McRae et al.’s (2005) feature norms. The norms cover a wide range of concrete con-cepts including animate and inanimate things (e.g., animals, clothing, vehicles, utensils, fruits, and vegetables) and were collected by presenting participants with words and asking them to list properties of the objects to which the words re-ferred. To avoid confusion, in the remainder of this paper we will use the termattributeto refer to properties of concepts and the termfeatureto refer to image features, such as color or edges.
Images for the concepts in McRae et al.’s (2005) production norms were harvested from ImageNet (Deng et al., 2009), an ontology of images based on the nominal hierarchy of WordNet (Fellbaum, 1998). ImageNet has more than 14 million im-ages spanning 21K WordNet synsets. We chose this database due to its high coverage and the high quality of its images (i.e., cleanly labeled and high resolution). McRae et al.’s norms contain 541 con-cepts out of which 516 appear in ImageNet1 and are represented by 688K images overall. The av-erage number of images per concept is 1,310 with the most popular beingcloset (2,149 images) and the least popularprune (5 images).
behavior eats, walks, climbs, swims, runs
diet drinks water, eats anything
shape size is tall, is large
anatomy has mouth, has head, has nose, has tail, has claws, has jaws, has neck, has snout, has feet, has tongue color patterns is black, is brown, is white
botany has skin, has seeds, has stem, has leaves, has pulp color patterns purple, white, green, has green top
shape size is oval, is long texture material is shiny
behavior rolls
parts has step through frame, has fork, has 2 wheels, has chain, has pedals has gears, has handlebar, has bell, has breaks has seat, has spokes texture material made of metal
[image:4.595.78.221.61.258.2]color patterns different colors, is black, is red, is grey, is silver
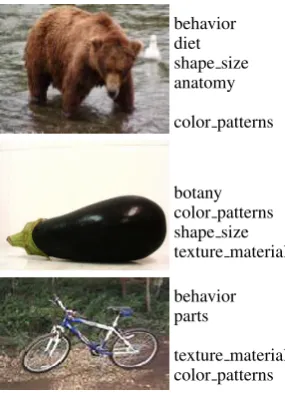
Table 2: Human-authored attributes forbear,eggplant, andbike.
The images depicting each concept were ran-domly partitioned into a training, development, and test set. For most concepts the development set contained a maximum of 100 images and the test set a maximum of 200 images. Concepts with less than 800 images in total were split into 1/8 test and development set each, and 3/4 training set. The development set was used for devising and re-fining our attribute annotation scheme. The train-ing and test sets were used for learntrain-ing and eval-uating, respectively, attribute classifiers (see Sec-tion 4).
Attribute Annotation Our aim was to develop a set of visual attributes that are both discriminating and cognitively plausible, i.e., humans would gen-erally use them to describe a concrete concept. As a starting point, we thus used the visual attributes from McRae et al.’s (2005) norming study. At-tributes capturing other primary sensory informa-tion (e.g., smell, sound), funcinforma-tional/motor proper-ties, or encyclopaedic information were not taken into account. For example,is purpleis a valid vi-sual attribute for aneggplant, whereasa vegetable is not, since it cannot be visualized. Collating all the visual attributes in the norms resulted in a to-tal of 673 which we further modified and extended during the annotation process explained below.
The annotation was conducted on aper-concept rather than a per-imagebasis (as for example in Farhadi et al. (2009)). For each concept (e.g.,bear
oreggplant), we inspected the images in the devel-opment set and chose all McRae et al. (2005) vi-sual attributes that applied. If an attribute was gen-erally true for the concept, but the images did not
provide enough evidence, the attribute was never-theless chosen and labeled with<no evidence>. For example, aplumhas a pit, but most images in ImageNet show plums where only the outer part of the fruit is visible. Attributes supported by the image data but missing from the norms were added. For example, has lights and has bumper are attributes of cars but are not included in the norms. Attributes were grouped in eight general classes shown in Table 1. Annotation proceeded on a category-by-category basis, e.g., first all food-related concepts were annotated, then animals, ve-hicles, and so on. Two annotators (both co-authors of this paper) developed the set of attributes for each category. One annotator first labeled con-cepts with their attributes, and the other annota-tor reviewed the annotations, making changes if needed. Annotations were revised and compared per category in order to ensure consistency across all concepts of that category.
has 2 pieces, has pointed end, has strap, has thumb, has buckles, has heels
has shoe laces, has soles, is black, is brown, is white, made of leather, made of rubber
climbs, climbs trees, crawls, hops, jumps, eats, eats nuts, is small, has bushy tail has 4 legs, has head, has neck, has nose, has snout, has tail, has claws has eyes, has feet, has toes,
diff colours, has 2 legs, has 2 wheels, has windshield, has floorboard, has stand, has tank has mudguard, has seat, has exhaust pipe, has frame, has handlebar, has lights, has mirror has step-through frame, is black, is blue, is red, is white, made of aluminum, made of steel
Table 3: Attribute predictions forsandals,squirrel, andmotorcycle.
in meaning (e.g.,has stemandhas stalk). Finally, our aim was to collect an exhaustive list of vi-sual attributes for each concept which is consis-tent across all members of a category. This is un-fortunately not the case in McRae et al.’s norms. Participants were asked to list up to 14 different properties that describe a concept. As a result, the attributes of a concept denote the set of properties humans consider most salient. For example, both, lemonsandorangeshave pulp. But the norms pro-vide this attribute only for the second concept.
On average, each concept was annotated with 19 attributes; approximately 14.5 of these were not part of the semantic representation created by McRae et al.’s (2005) participants for that con-cept even though they figured in the representa-tions of other concepts. Furthermore, on average two McRae et al. attributes per concept were dis-carded. Examples of concepts and their attributes from our database2are shown in Table 2.
4 Attribute-based Classification
Following previous work (Farhadi et al., 2009; Lampert et al., 2009) we learned one classifier per attribute (i.e., 350 classifiers in total).3 The train-ing set consisted of 91,980 images (with a maxi-mum of 350 images per concept). We used an L2-regularized L2-loss linear SVM (Fan et al., 2008) to learn the attribute predictions. We adopted the training procedure of Farhadi al. (2009).4To learn a classifier for a particular attribute, we used all images in the training data. Images of concepts annotated with the attribute were used as positive examples, and the rest as negative examples. The
2Available from http://homepages.inf.ed.ac.uk/
mlap/index.php?page=resources.
3We only trained classifiers for attributes corroborated by the images and excluded those labeled with<no evidence>.
4http://vision.cs.uiuc.edu/attributes/
data was randomly split into a training and valida-tion set of equal size in order to find the optimal cost parameterC. The final SVM for the attribute was trained on the entire training data, i.e., on all positive and negative examples.
The SVM learners used the four different fea-ture types proposed in Farhadi et al. (2009), namely color, texture, visual words, and edges. Texture descriptors were computed for each pixel and quantized to the nearest 256 k-means centers. Visual words were constructed with a HOG spa-tial pyramid. HOG descriptors were quantized into 1000 k-means centers. Edges were detected using a standard Canny detector and their orien-tations were quantized into eight bins. Color de-scriptors were sampled for each pixel and quan-tized to the nearest 128 k-means centers. Shapes and locations were represented by generating his-tograms for each feature type for each cell in a grid of three vertical and horizontal blocks. Our clas-sifiers used 9,688 features in total. Table 3 shows their predictions for three test images.
Note that attributes are predicted on an image-by-image basis; our task, however, is to describe a conceptwby its visual attributes. Since concepts are represented by many images we must some-how aggregate their attributes into a single repre-sentation. For each image iw∈Iw of concept w,
we output anF-dimensional vector containing pre-diction scores scorea(iw)for attributesa=1, ...,F.
We transform these attribute vectors into a single vectorpw ∈[0,1]1×F, by computing the centroid
of all vectors for concept w. The vector is nor-malized to obtain a probability distribution over attributes givenw:
pw=(∑iw∈Iwscorea(iw))a=1,...,F
∑F
a=1∑iw∈Iwscorea(iw)
(1)
0.4 0.5 0.6 0.7 0.8 0.9 1
0 0.1 0.2 0.3 0.4 0.5 0.6 0.7 0.8 0.9 1
Precision
[image:6.595.71.287.60.217.2]Recall
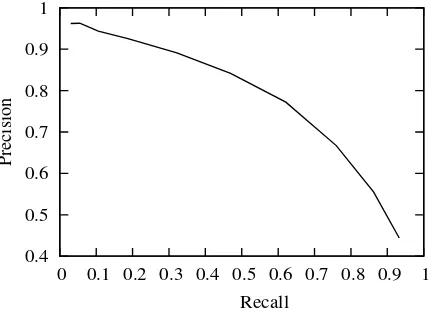
Figure 1: Attribute classifier performance for dif-ferent thresholdsδ(test set).
ting each entry less thanδto zero.
Figure 1 shows the results of the attribute pre-diction on the test set on the basis of the computed centroids; specifically, we plot recall against pre-cision based on threshold δ.5 Table 4 shows the 10 nearest neighbors for five example concepts from our dataset. Again, we measure the cosine similarity between a concept and all other con-cepts in the dataset when these are represented by their visual attribute vectorpw.
5 Attribute-based Semantic Models
We evaluated the effectiveness of our attribute classifiers by integrating their predictions with tra-ditional text-only models of semantic representa-tion. These models have been previously proposed in the literature and were also described in a recent comparative study (Silberer and Lapata, 2012).
We represent the visual modality by attribute vectors computed as shown in Equation (1). The linguistic environment is approximated bytextual attributes. We used Strudel (Baroni et al., 2010) to obtain these attributes for the nouns in our dataset. Given a list of target words, Strudel ex-tracts weighted word-attribute pairs from a lem-matized and pos-tagged text corpus (e.g., egg-plant–cook-v, eggplant–vegetable-n). The weight of each word-attribute pair is a log-likelihood ratio score expressing the pair’s strength of association. In our experiments we learned word-attribute pairs from a lemmatized and pos-tagged (2009) dump of the English Wikipedia.6 In the remainder of this section we will briefly describe the models we
5Threshold values ranged from 0 to 0.9 with 0.1 stepsize. 6The corpus can be downloaded from http://wacky.
sslmit.unibo.it/doku.php?id=corpora.
Concept Nearest Neighbors
boat ship, sailboat, yacht, submarine, canoe, whale, airplane, jet, helicopter, tank (army)
rooster chicken, turkey, owl, pheasant, peacock, stork, pigeon, woodpecker, dove, raven
shirt blouse, robe, cape, vest, dress, coat, jacket, skirt, camisole, nightgown
spinach lettuce, parsley, peas, celery, broccoli, cab-bage, cucumber, rhubarb, zucchini, asparagus
squirrel chipmunk, raccoon, groundhog, gopher, por-cupine, hare, rabbit, fox, mole, emu
Table 4: Ten most similar concepts computed on the basis of averaged attribute vectors and ordered according to cosine similarity.
used in our study and how the textual and visual modalities were fused to create a joint representa-tion.
Concatenation Model Variants of this model were originally proposed in Bruni et al. (2011) and Johns and Jones (2012). Let T ∈RN×D
de-note a term-attribute co-occurrence matrix, where each cell records a weighted co-occurrence score of a word and a textual attribute. LetP∈[0,1]N×F denote a visual matrix, representing a probability distribution over visual attributes for each word. A word’s meaning can be then represented by the concatenation of its normalized textual and visual vectors.
Canonical Correlation Analysis The second model uses Canonical Correlation Analysis (CCA, Hardoon et al. (2004)) to learn a joint semantic representation from the textual and visual modali-ties. Given two random variablesxandy(or two sets of vectors), CCA can be seen as determining two sets of basis vectors in such a way, that the cor-relation between the projections of the variables onto these bases is mutually maximized (Borga, 2001). In effect, the representation-specific de-tails pertaining to the two views of the same phe-nomenon are discarded and the underlying hidden factors responsible for the correlation are revealed. The linguistic and visual views are the same as in the simple concatenation model just explained. We use a kernelized version of CCA (Hardoon et al., 2004) that first projects the data into a higher-dimensional feature space and then performs CCA in this new feature space. The two kernel matrices areKT=T T0andKP=PP0. After applying CCA
[image:6.595.306.526.61.197.2]textual matrixT onto the new basis and ˜P∈RN×l,
resulting from the projection of the corresponding visual attribute matrix. The meaning of a word is then represented by ˜T or ˜P.
Attribute-topic Model Andrews et al. (2009) present an extension of LDA (Blei et al., 2003) where words in documents and their associated attributes are treated as observed variables that are explained by a generative process. The idea is that each document in a document col-lection
D
is generated by a mixture of com-ponents {x1, ...,xc, ...,xC} ∈C
, where acompo-nentxccomprises a latent discourse topic coupled
with an attribute cluster. Inducing these attribute-topic components from
D
with the extended LDA model gives two sets of parameters: word prob-abilities given componentsPW(wi|X =xc)forwi,i=1, ...,n, and attribute probabilities given com-ponentsPA(ak|X=xc)forak,k=1, ...,F. For
ex-ample, most of the probability mass of a compo-nentxwould be reserved for the wordsshirt, coat, dress and the attributes has 1 piece, has seams, made of materialand so on.
Word meaning in this model is represented by the distribution PX|W over the learned
compo-nents. Assuming a uniform distribution over com-ponentsxcin
D
,PX|W can be approximated as:PX=xc|W=wi=
P(wi|xc)P(xc)
P(wi) ≈
P(wi|xc) C ∑ l=1P(wi|xl)
(2)
whereCis the total number of components. In our work, the training data is a corpus
D
of textual attributes (rather than documents). Each attribute is represented as a bag-of-concepts, i.e., words demonstrating the property expressed by the attribute (e.g.,vegetable-n is a property ofeggplant, spinach, carrot). For some of these con-cepts, our classifiers predict visual attributes. In this case, the concepts are paired with one of their visual attributes. We sample attributes for a con-ceptwfrom their distribution givenw(Eq. (1)).
6 Experimental Setup
Evaluation Task We evaluated the distribu-tional models presented in Section 5 on the word association norms collected by Nelson et al. (1998).7 These were established by presenting a large number of participants with a cue word (e.g.,rice) and asking them to name an associate
7Fromhttp://w3.usf.edu/FreeAssociation/.
word in response (e.g., Chinese, wedding, food, white). For each cue, the norms provide a set of associates and the frequencies with which they were named. We can thus compute the prob-ability distribution over associates for each cue. Analogously, we can estimate the degree of sim-ilarity between a cue and its associates using our models. The norms contain 63,619 unique cue-associate pairs. Of these, 435 pairs were covered by McRae et al. (2005) and our models. We also experimented with 1,716 pairs that werenot part of McRae et al.’s study but belonged to concepts covered by our attribute taxonomy (e.g., animals, vehicles), and were present in our corpus and Ima-geNet. Using correlation analysis (Spearman’sρ), we examined the degree of linear relationship be-tween the human cue-associate probabilities and the automatically derived similarity values.8
Parameter Settings In order to integrate the vi-sual attributes with the models described in Sec-tion 5 we must select the appropriate threshold value δ (see Eq. (1)). We optimized this value on the development set and obtained best results with δ=0. We also experimented with thresh-olding the attribute prediction scores and with ex-cluding attributes with low precision. In both cases, we obtained best results when using all at-tributes. We could apply CCA to the vectors rep-resenting each image separately and then compute a weighted centroid on the projected vectors. We refrained from doing this as it involves additional parameters and assumes input different from the other models. We measured the similarity between two words using the cosine of the angle. For the attribute-topic model, the number of predefined componentsC was set to 10. In this model, sim-ilarity was measured as defined by Griffiths et al. (2007). The underlying idea is that word associa-tion can be expressed as a condiassocia-tional distribuassocia-tion. With regard to the textual attributes, we obtained a 9,394-dimensional semantic space after discarding word-attribute pairs with a log-likelihood ratio score less than 19.9 We also discarded attributes co-occurring with less than two different words.
8Previous work (Griffiths et al., 2007) which also predicts word association reports how many times the word with the highest score under the model was the first associate in the human norms. This evaluation metric assumes that there are many associates for a given cue which unfortunately is not the case in our study which is restricted to the concepts rep-resented in our attribute taxonomy.
Nelson Concat CCA TopicAttr TextAttr Concat 0.24
CCA 0.30 0.72 TopicAttr 0.26 0.55 0.28
TextAttr 0.21 0.80 0.83 0.34
[image:8.595.307.525.60.138.2]VisAttr 0.23 0.65 0.52 0.40 0.39
Table 5: Correlation matrix for seen Nelson et al. (1998) cue-associate pairs and five distributional models. All correlation coefficients are statisti-cally significant (p<0.01,N=435).
7 Results
Our experiments were designed to answer four questions: (1) Do visual attributes improve the performance of distributional models? (2) Are there performance differences among different models, i.e., are some models better suited to the integration of visual information? (3) How do computational models fare against gold standard norming data? (4) Does the attribute-based repre-sentation bring advantages over more conventional approaches based on raw image features?
Our results are broken down into seen (Table 5) and unseen (Table 6) concepts. The former are known to the attribute classifiers and form part of our database, whereas the latter are unknown and are not included in McRae et al.’s (2005) norms. We report the correlation coefficients we obtain when human-derived cue-associate proba-bilities (Nelson et al., 1998) are compared against the simple concatenation model (Concat), CCA, and Andrews et al.’s (2009) attribute-topic model (TopicAttr). We also report the performance of a distributional model that is based solely on the output of our attribute classifiers, i.e., without any textual input (VisAttr) and conversely the perfor-mance of a model that uses textual information only (i.e., Strudel attributes) without any visual in-put (TextAttr). The results are displayed as a cor-relation matrix so that inter-model corcor-relations can also be observed.
As can be seen in Table 5 (second column), two modalities are in most cases better than one when evaluating model performance on seen data. Dif-ferences in correlation coefficients between mod-els with two versus one modality are all statis-tically significant (p<0.01 using a t-test), with
the exception of Concat when compared against VisAttr. It is also interesting to note that Topi-cAttr is the least correlated model when compared against other bimodal models or single
modali-Nelson Concat CCA TopicAttr TextAttr Concat 0.11
CCA 0.15 0.66 TopicAttr 0.17 0.69 0.48
TextAttr 0.11 0.65 0.25 0.39
VisAttr 0.13 0.57 0.87 0.57 0.34
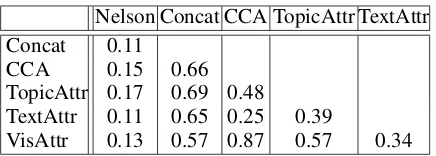
Table 6: Correlation matrix for unseen Nelson et al. (1998) cue-associate pairs and five distribu-tional models. All correlation coefficients are sta-tistically significant (p<0.01,N=1,716).
ties. This indicates that the latent space obtained by this model is most distinct from its constituent parts (i.e., visual and textual attributes). Perhaps unsuprisingly Concat, CCA, VisAttr, and TextAttr are also highly intercorrelated.
On unseen pairs (see Table 6), Concat fares worse than CCA and TopicAttr, achieving simi-lar performance to TextAttr. CCA and TopicAttr are significantly better than TextAttr and VisAttr (p<0.01). This indicates that our attribute
classi-fiers generalize well beyond the concepts found in our database and can produce useful visual infor-mation even on unseen images. Compared to Con-cat and CCA, TopicAttr obtains a better fit with the human association norms on the unseen data.
To answer our third question, we obtained dis-tributional models from McRae et al.’s (2005) norms and assessed how well they predict Nelson et al.’s (1998) word-associate similarities. Each concept was represented as a vector with dimen-sions corresponding to attributes generated by par-ticipants of the norming study. Vector components were set to the (normalized) frequency with which participants generated the corresponding attribute when presented with the concept. We measured the similarity between two words using the co-sine coefficient. Table 7 presents results for dif-ferent model variants which we created by ma-nipulating the number and type of attributes in-volved. The first model uses the full set of at-tributes present in the norms (All Atat-tributes). The second model (Text Attributes) uses all attributes but those classified as visual (e.g., functional, en-cyclopaedic). The third model (Visual Attributes) considers solely visual attributes.
[image:8.595.69.290.60.138.2]Models Seen All Attributes 0.28 Text Attributes 0.20 Visual Attributes 0.25
Table 7: Model performance on seen Nelson et al. (1998) cue-associate pairs; models are based on gold human generated attributes (McRae et al., 2005). All correlation coefficients are statistically significant (p<0.01,N=435).
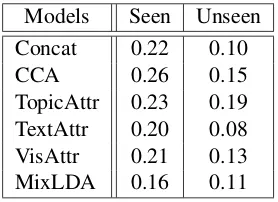
Models Seen Unseen Concat 0.22 0.10 CCA 0.26 0.15 TopicAttr 0.23 0.19 TextAttr 0.20 0.08 VisAttr 0.21 0.13 MixLDA 0.16 0.11
Table 8: Model performance on a subset of Nelson et al. (1998) cue-associate pairs. Seen are concepts known to the attribute classifiers and covered by MixLDA (N=85). Unseen are concepts covered by LDA but unknown to the attribute classifiers (N=388). All correlation coefficients are statisti-cally significant (p<0.05).
performance is comparable to the All Attributes model (see Table 5, second column), despite us-ing automatic attributes (both textual and visual). Furthermore, visual attributes obtained through our classifiers (see Table 5) achieve a marginally lower correlation coefficient against human gener-ated ones (see Table 7).
Finally, to address our last question, we com-pared our approach against Feng and Lapata (2010) who represent visual information via quan-tized SIFT features. We trained their MixLDA model on their corpus consisting of 3,361 BBC news documents and corresponding images (Feng and Lapata, 2008). We optimized the model pa-rameters on a development set consisting of cue-associate pairs from Nelson et al. (1998), exclud-ing the concepts in McRae et al. (2005). We used a vocabulary of approximately 6,000 words. The best performing model on the development set used 500 visual terms and 750 topics and the asso-ciation measure proposed in Griffiths et al. (2007). The test set consisted of 85 seen and 388 unseen cue-associate pairs that were covered by our mod-els and MixLDA.
Table 8 reports correlation coefficients for our models and MixLDA against human probabili-ties. All attribute-based models significantly out-perform MixLDA on seen pairs (p<0.05 using a
t-test). MixLDA performs on a par with the con-catenation model on unseen pairs, however CCA, TopicAttr, and VisAttr are all superior. Although these comparisons should be taken with a grain of salt, given that MixLDA and our models are trained on different corpora (MixLDA assumes that texts and images are collocated, whereas our images do not have collateral text), they seem to indicate that attribute-based information is indeed beneficial.
8 Conclusions
In this paper we proposed the use of automatically computed visual attributes as a way of physically grounding word meaning. Our results demonstrate that visual attributes improve the performance of distributional models across the board. On a word association task, CCA and the attribute-topic model give a better fit to human data when com-pared against simple concatenation and models based on a single modality. CCA consistently out-performs the attribute-topic model on seen data (it is in fact slightly better over a model that uses gold standard human generated attributes), whereas the attribute-topic model generalizes better on unseen data (see Tables 5, 6, and 8). Since the attribute-based representation is general and text-attribute-based we argue that it can be conveniently integrated with any type of distributional model or indeed other grounded models that rely on low-level image fea-tures (Bruni et al., 2012a; Feng and Lapata, 2010) In the future, we would like to extend our database to actions and show that this attribute-centric representation is useful for more applied tasks such as image description generation and ob-ject recognition. Finally, we have only scratched the surface in terms of possible models for inte-grating the textual and visual modality. Interest-ing frameworks which we plan to explore are deep belief networks and Bayesian non-parametrics.
References
M. Andrews, G. Vigliocco, and D. Vinson. 2009. Integrating Experiential and Distributional Data to Learn Semantic Representations. Psychological Re-view, 116(3):463–498.
[image:9.595.112.251.213.314.2]Based on Properties and Types. Cognitive Science, 34(2):222–254.
L. W. Barsalou. 2008. Grounded Cognition. Annual Review of Psychology, 59:617–845.
D. M. Blei, A. Y. Ng, and M. I. Jordan. 2003. Latent Dirichlet Allocation. Journal of Machine Learning Research, 3:993–1022, March.
M. Borga. 2001. Canonical Correlation – a Tutorial, January.
M. H. Bornstein, L. R. Cote, S. Maital, K. Painter, S.-Y. Park, L. Pascual, M. G. Pˆecheux, J. Ruel, P. Venuti, and A. Vyt. 2004. Cross-linguistic Analysis of Vocabulary in Young Children: Spanish, Dutch, French, Hebrew, Italian, Korean, and American En-glish. Child Development, 75(4):1115–1139. B. B¨orschinger, B. K. Jones, and M. Johnson. 2011.
Reducing Grounded Learning Tasks to Grammatical Inference. InProceedings of the 2011 Conference on Empirical Methods in Natural Language Pro-cessing, pages 1416–1425, Edinburgh, UK.
S.R.K. Branavan, H. Chen, L. S. Zettlemoyer, and R. Barzilay. 2009. Reinforcement Learning for Mapping Instructions to Actions. InProceedings of the Joint Conference of the 47th Annual Meeting of the ACL and the 4th International Joint Conference on Natural Language Processing of the AFNLP, pages 82–90, Suntec, Singapore.
E. Bruni, G. Tran, and M. Baroni. 2011. Distributional Semantics from Text and Images. InProceedings of the GEMS 2011 Workshop on GEometrical Models of Natural Language Semantics, pages 22–32, Edin-burgh, UK.
E. Bruni, G. Boleda, M. Baroni, and N. Tran. 2012a. Distributional Semantics in Technicolor. In Pro-ceedings of the 50th Annual Meeting of the Associa-tion for ComputaAssocia-tional Linguistics (Volume 1: Long Papers), pages 136–145, Jeju Island, Korea. E. Bruni, J. Uijlings, M. Baroni, and N. Sebe. 2012b.
Distributional semantics with eyes: Using im-age analysis to improve computational representa-tions of word meaning. In Proceedings of the 20th ACM International Conference on Multimedia, pages 1219–1228., New York, NY.
C. Chai and C. Hung. 2008. Automatically Annotating Images with Keywords: A Review of Image Annota-tion Systems. Recent Patents on Computer Science, 1:55–68.
R. Datta, D. Joshi, J. Li, and J. Z. Wang. 2008. Image Retrieval: Ideas, Influences, and Trends of the New Age.ACM Computing Surveys, 40(2):1–60. J. Deng, W. Dong, R. Socher, L. Li, K. Li, and L.
Fei-Fei. 2009. ImageNet: A Large-Scale Hierarchi-cal Image Database. In Proceedings of the IEEE Computer Society Conference on Computer Vision and Pattern Recognition, pages 248–255, Miami, Florida.
M. Everingham, L. Van Gool, C. K. I. Williams, J. Winn, and A. Zisserman. 2008. The PASCAL Visual Object Classes Challenge 2008 (VOC2008) Results. http://www.pascal-network.org/challenges/VOC/voc2008/workshop. R. Fan, K. Chang, C. Hsieh, X. Wang, and C. Lin.
2008. LIBLINEAR: A Library for Large Linear Classification. Journal of Machine Learning Re-search, 9:1871–1874.
A. Farhadi, I. Endres, D. Hoiem, and D. Forsyth. 2009. Describing Objects by their Attributes. In Proceed-ings of the IEEE Computer Society Conference on Computer Vision and Pattern Recognition, pages 1778–1785, Miami Beach, Florida.
L. Fei-Fei and P. Perona. 2005. A Bayesian Hierarchi-cal Model for Learning Natural Scene Categories. In Proceedings of the IEEE Computer Society Confer-ence on Computer Vision and Pattern Recognition, pages 524–531, San Diego, California.
C. Fellbaum, editor. 1998. WordNet: an Electronic Lexical Database. MIT Press.
Y. Feng and M. Lapata. 2008. Automatic image anno-tation using auxiliary text information. In Proceed-ings of ACL-08: HLT, pages 272–280, Columbus, Ohio.
Y. Feng and M. Lapata. 2010. Visual Informa-tion in Semantic RepresentaInforma-tion. In Human Lan-guage Technologies: The 2010 Annual Conference of the North American Chapter of the Association for Computational Linguistics, pages 91–99, Los Angeles, California. ACL.
V. Ferrari and A. Zisserman. 2007. Learning Visual Attributes. In J.C. Platt, D. Koller, Y. Singer, and S. Roweis, editors,Advances in Neural Information Processing Systems 20, pages 433–440. MIT Press, Cambridge, Massachusetts.
G. H. Golub, F. T. Luk, and M. L. Overton. 1981. A block lanczoz method for computing the singular values and corresponding singular vectors of a ma-trix. ACM Transactions on Mathematical Software, 7:149–169.
P. Gorniak and D. Roy. 2004. Grounded Semantic Composition for Visual Scenes. Journal of Artificial Intelligence Research, 21:429–470.
T. L. Griffiths, M. Steyvers, and J. B. Tenenbaum. 2007. Topics in Semantic Representation. Psycho-logical Review, 114(2):211–244.
D. R. Hardoon, S. R. Szedmak, and J. R. Shawe-Taylor. 2004. Canonical Correlation Analysis: An Overview with Application to Learning Methods. Neural Computation, 16(12):2639–2664.
B. T. Johns and M. N. Jones. 2012. Perceptual Infer-ence through Global Lexical Similarity. Topics in Cognitive Science, 4(1):103–120.
R. J. Kate and R. J. Mooney. 2007. Learning Lan-guage Semantics from Ambiguous Supervision. In Proceedings of the 22nd Conference on Artificial In-telligence, pages 895–900, Vancouver, Canada. N. Kumar, A. C. Berg, P. N. Belhumeur, and S. K.
Na-yar. 2009. Attribute and Simile Classifiers for Face Verification. In Proceedings of the IEEE 12th In-ternational Conference on Computer Vision, pages 365–372, Kyoto, Japan.
C. H. Lampert, H. Nickisch, and S. Harmeling. 2009. Learning To Detect Unseen Object Classes by Between-Class Attribute Transfer. InComputer Vi-sion and Pattern Recognition, pages 951–958, Mi-ami Beach, Florida.
B. Landau, L. Smith, and S. Jones. 1998. Object Per-ception and Object Naming in Early Development. Trends in Cognitive Science, 27:19–24.
C. Leong and R. Mihalcea. 2011. Going Beyond Text: A Hybrid Image-Text Approach for Measuring Word Relatedness. In Proceedings of 5th Interna-tional Joint Conference on Natural Language Pro-cessing, pages 1403–1407, Chiang Mai, Thailand.
J. Liu, B. Kuipers, and S. Savarese. 2011. Recognizing Human Actions by Attributes. InProceedings of the IEEE Conference on Computer Vision and Pattern Recognition, pages 3337–3344, Colorado Springs, Colorado.
D. G. Lowe. 1999. Object Recognition from Local Scale-invariant Features. InProceedings of the In-ternational Conference on Computer Vision, pages 1150–1157, Corfu, Greece.
D. Lowe. 2004. Distinctive Image Features from Scale-invariant Keypoints. International Journal of Computer Vision, 60(2):91–110.
W. Lu, H. T. Ng, W.S. Lee, and L. S. Zettlemoyer. 2008. A Generative Model for Parsing Natural Lan-guage to Meaning Representations. InProceedings of the 2008 Conference on Empirical Methods in Natural Language Processing, pages 783–792, Hon-olulu, Hawaii.
K. McRae, G. S. Cree, M. S. Seidenberg, and C. Mc-Norgan. 2005. Semantic Feature Production Norms for a Large Set of Living and Nonliving Things. Be-havior Research Methods, 37(4):547–559.
D. L. Nelson, C. L. McEvoy, and T. A. Schreiber. 1998. The University of South Florida Word Association, Rhyme, and Word Fragment Norms.
J. Ngiam, A. Khosla, M. Kim, J. Nam, H. Lee, and A. Y. Ng. 2011. Multimodal deep learning. In Proceedings of the 28th International Conference on Machine Leanring, pages 689–696, Bellevue, Wash-ington.
A. Oliva and A. Torralba. 2007. The Role of Context in Object Recognition. Trends in Cognitive Sciences, 11(12):520–527.
D. N. Osherson, J. Stern, O. Wilkie, M. Stob, and E. E. Smith. 1991. Default Probability. Cognitive Sci-ence, 2(15):251–269.
G. Patterson and J. Hays. 2012. SUN Attribute Database: Discovering, Annotating and Recogniz-ing Scene Attributes. InProceedings of the IEEE Conference on Computer Vision and Pattern Recog-nition, pages 2751–2758, Providence, Rhode Island. T. Regier. 1996. The Human Semantic Potential. MIT
Press, Cambridge, Massachusetts.
D. Roy and A. Pentland. 2002. Learning Words from Sights and Sounds: A Computational Model. Cog-nitive Science, 26(1):113–146.
C. Silberer and M. Lapata. 2012. Grounded Mod-els of Semantic Representation. In Proceedings of the 2012 Joint Conference on Empirical Methods in Natural Language Processing and Computational Natural Language Learning, pages 1423–1433, Jeju Island, Korea.
J. M. Siskind. 2001. Grounding the Lexical Semantics of Verbs in Visual Perception using Force Dynamics and Event Logic. Journal of Artificial Intelligence Research, 15:31–90.
S. A. Sloman and L. J. Ripps. 1998. Similarity as an Explanatory Construct.Cognition, 65:87–101. N. Srivastava and R. Salakhutdinov. 2012. Multimodal
learning with deep boltzmann machines. In Pro-ceedings of the 26th Annual Conference on Neural Information Processing Systems, pages 2231–2239, Lake Tahoe, Nevada.
M. Steyvers. 2010. Combining feature norms and text data with topic models. Acta Psychologica, 133(3):234–342.
S. Tellex, T. Kollar, S. Dickerson, M. R. Walter, A. Gopal Banerjee, S. Teller, and N. Roy. 2011. Understanding Natural Language Commands for Robotic Navigation and Manipulation. In Proceed-ings of the 25th National Conference on Artificial Intelligence, pages 1507–1514, San Francisco, Cali-fornia.
L. von Ahn and L. Dabbish. 2004. Labeling images with a computer game. InProceeings of the Human Factors in Computing Systems Conference, pages 319–326, Vienna, Austria.
C. Yu and D. H. Ballard. 2007. A Unified Model of Early Word Learning Integrating Statistical and So-cial Cues. Neurocomputing, 70:2149–2165. M. D. Zeigenfuse and M. D. Lee. 2010. Finding the
Features that Represent Stimuli. Acta Psychologi-cal, 133(3):283–295.
J. M. Zelle and R. J. Mooney. 1996. Learning to Parse Database Queries Using Inductive Logic Program-ming. In Proceedings of the 13th National Con-ference on Artificial Intelligence, pages 1050–1055, Portland, Oregon.